2025 LL Price Prediction: Expert Analysis and Market Forecast for the Coming Year

Introduction: LL's Market Position and Investment Value
LightLink (LL) is an Ethereum Layer 2 blockchain that offers instant, gasless transactions to users of dApps and enterprises. Since its inception in 2017, the project has been developing blockchain solutions for major enterprises in the APAC region. As of 2025, LL's market cap has reached $3,066,769.69, with a circulating supply of approximately 417.53 million tokens, trading at $0.007345 per token. This asset, which provides seamless interoperability between dApps and enterprise partners, is playing an increasingly pivotal role in bridging millions of users toward an interconnected economy.
This article will provide a comprehensive analysis of LL's price trends through 2030, integrating historical patterns, market supply and demand dynamics, ecosystem development, and macroeconomic factors to deliver professional price forecasts and actionable investment strategies for investors.
I. LL Price History Review and Market Status
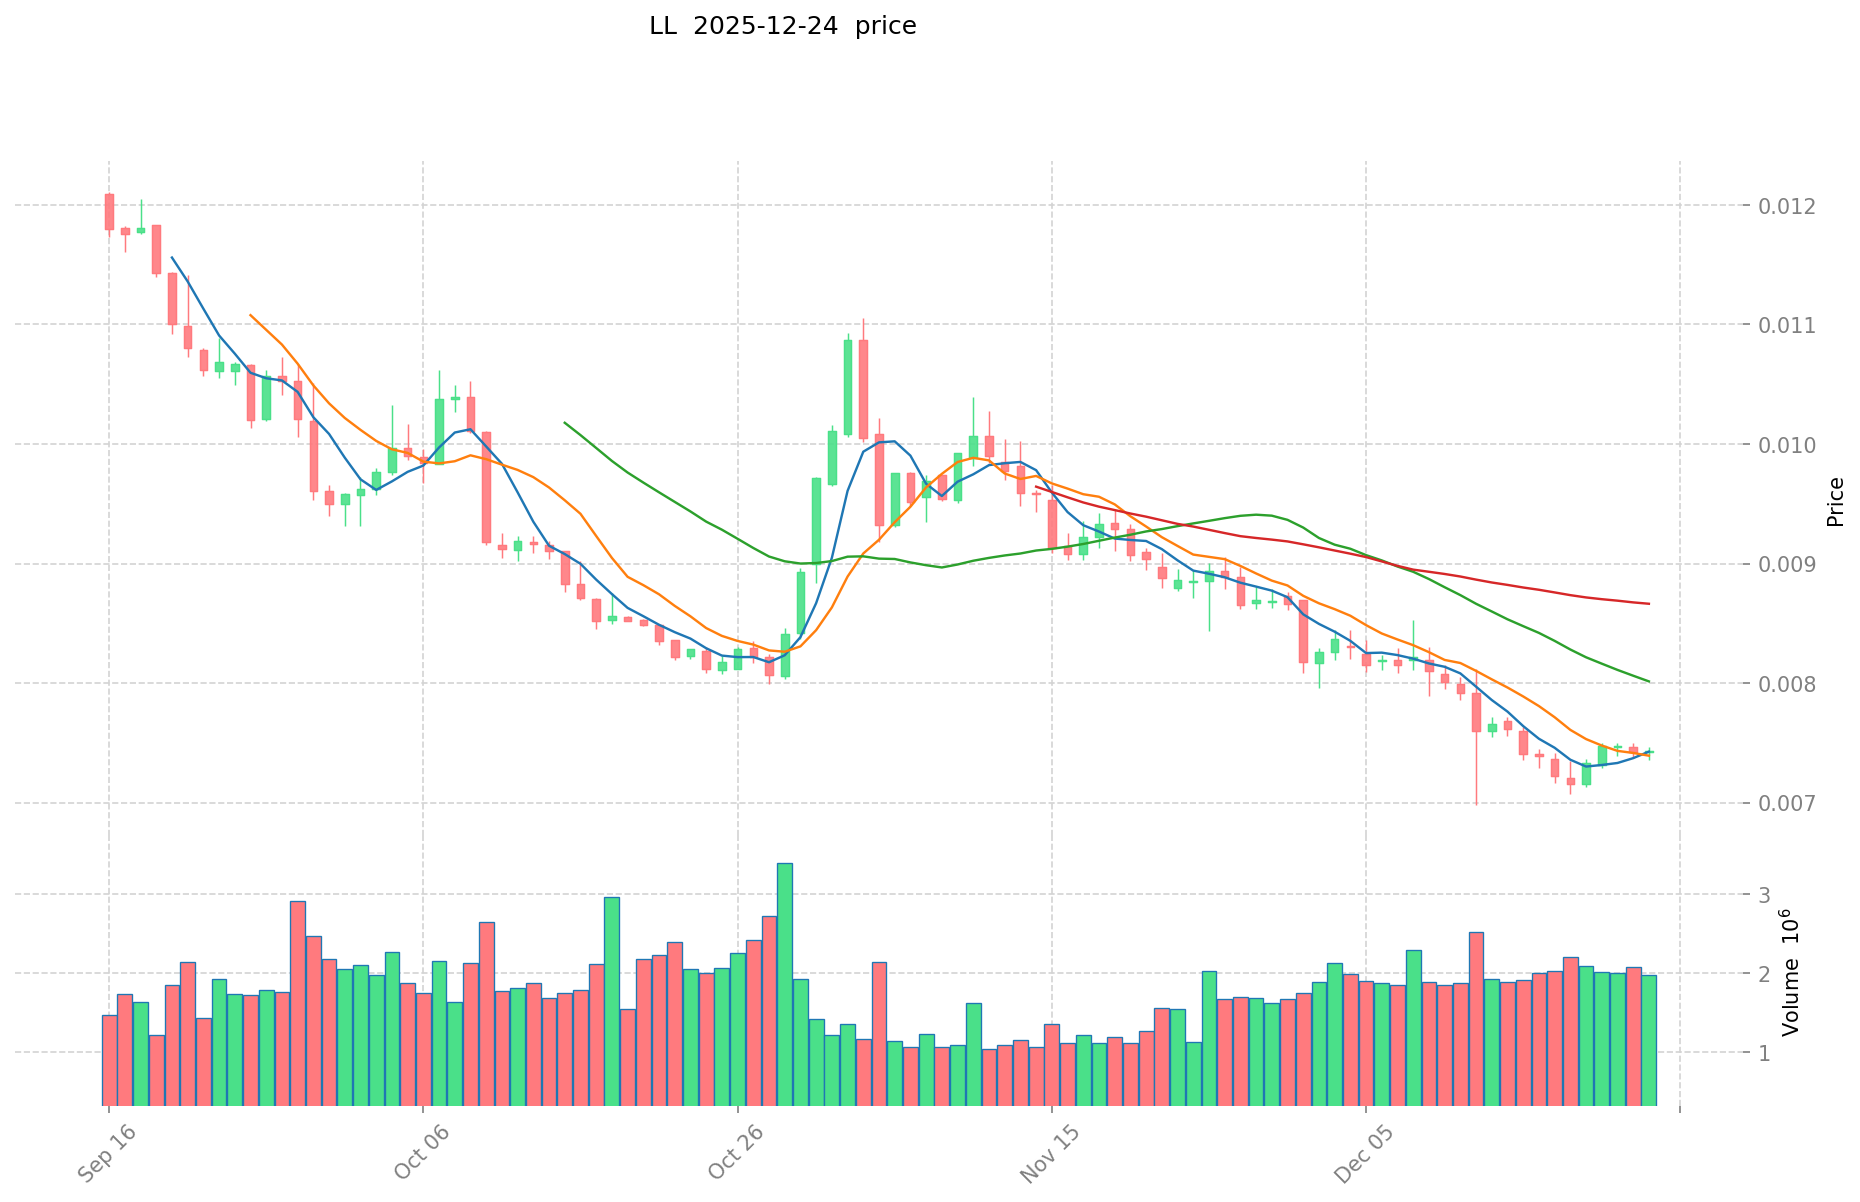
LL Historical Price Evolution Trajectory
- April 2024: LightLink token launched on April 24, 2024, with an initial price of $0.3, marking the all-time high (ATH).
- December 2025: The token experienced significant depreciation, with the price declining to $0.006976 on December 12, 2025, establishing a new all-time low (ATL) within the trading period, representing an 83.67% decline over one year.
LL Current Market Situation
As of December 24, 2025, LightLink (LL) is trading at $0.007345, reflecting minimal volatility in the short term. The token has experienced a -0.75% decline over the past 24 hours and a -16.41% decline over the past 30 days. However, it shows modest recovery signals with a +0.12% gain in the last hour and a +0.75% gain over the past 7 days.
The 24-hour trading volume stands at $14,572.69, indicating relatively low liquidity. The circulating supply is 417.53 million LL tokens out of a total supply of 1 billion tokens, representing 41.75% circulation. The fully diluted valuation (FDV) is approximately $7.345 million, with a current market capitalization of approximately $3.067 million. The token maintains a market dominance of 0.00023%, ranking 1,853 among all cryptocurrencies.
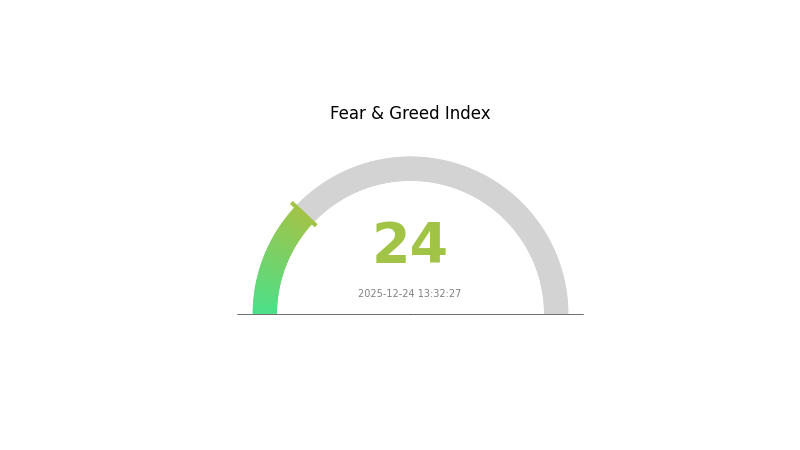
LightLink currently has 4,893 token holders and is traded on 3 exchanges. Market sentiment indicates extreme fear (VIX: 24), reflecting broader market uncertainty.
Click to view current LL market price
LL Market Sentiment Index
2025-12-24 Fear and Greed Index: 24 (Extreme Fear)
Click to view current Fear & Greed Index
Market Analysis: The cryptocurrency market is experiencing extreme fear with a fear and greed index of 24. This indicates strong bearish sentiment and heightened risk aversion among investors. Market participants are showing significant anxiety about price movements and overall market direction. Such extreme fear often creates opportunities for contrarian investors, as panic selling may have pushed prices lower than fundamental valuations suggest. However, caution remains warranted as further downside pressure could occur before sentiment stabilizes.
LL Holdings Distribution
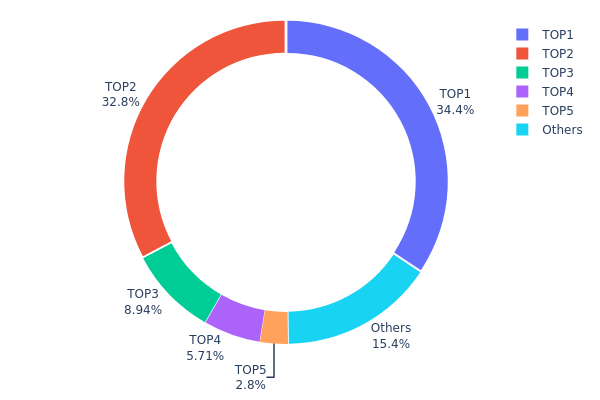
The holdings distribution chart illustrates the concentration of LL tokens across blockchain addresses, revealing how token ownership is distributed among top holders and the broader market. This metric serves as a critical indicator of network decentralization, liquidity concentration, and potential market manipulation risks. By analyzing the top addresses and their proportional stake in total supply, investors and analysts can assess the token's vulnerability to large-scale sell-offs and evaluate the overall health of the on-chain ecosystem.
LL demonstrates a notably concentrated holding structure, with the top two addresses commanding 67.11% of the total token supply. The leading address (0x6310...121ee9) holds 34.35%, while the second address (0x8c6e...80ca8e) accounts for 32.76%, indicating significant concentration risk. The third through fifth largest holders collectively represent 17.45% of supply, while other addresses comprise 15.44%. This distribution pattern raises concerns regarding token centralization, as the top five addresses control 84.56% of circulating tokens, substantially exceeding healthy decentralization benchmarks.
Such concentrated ownership structure poses considerable implications for market dynamics and price stability. The dominance of a small number of addresses creates elevated liquidity concentration risk and increases the potential for coordinated or unilateral trading activities that could trigger significant price volatility. Additionally, the massive stakes held by top addresses suggest that large capital flows, redemptions, or strategic token movements could substantially impact LL's market price and overall trading conditions. From a structural perspective, this extreme concentration reflects a relatively early-stage or centralized token distribution model, where decentralization remains underdeveloped compared to established cryptocurrency networks with more distributed holder bases.
Click to view current LL Holdings Distribution
| Top | Address | Holding Qty | Holding (%) |
|---|---|---|---|
| 1 | 0x6310...121ee9 | 343528.04K | 34.35% |
| 2 | 0x8c6e...80ca8e | 327601.76K | 32.76% |
| 3 | 0x2da1...82872e | 89403.72K | 8.94% |
| 4 | 0xf89d...5eaa40 | 57112.72K | 5.71% |
| 5 | 0x58ed...a36a51 | 28018.75K | 2.80% |
| - | Others | 154335.01K | 15.44% |
II. Core Factors Influencing LL's Future Price
Supply Mechanism
- Token Circulation: As of 2025, LL has a circulating supply of approximately 305,250,045 tokens with a market capitalization of $2,804,637 and a current price around $0.009188.
Technology Development and Ecosystem Building
-
Ethereum Layer 2 Solution: LightLink operates as a Layer 2 blockchain platform built on the Ethereum ecosystem, designed to enhance network performance and scalability. This Layer 2 positioning increases investment attractiveness by enabling higher throughput and faster transaction settlements.
-
Zero Gas Fee Transaction Model: LightLink's core distinctive feature is its "instant zero gas fee transactions" positioning, which differentiates it from other Layer 2 solutions. This mechanism reduces transaction costs and speeds up transaction execution, positioning LL to drive broader blockchain adoption among decentralized applications (dApps) and enterprises.
-
Ecosystem Applications: LightLink is designed specifically for dApps and enterprises seeking cost-efficient and high-speed transaction capabilities within the DeFi landscape, supporting the development of decentralized finance applications on its platform.
Macroeconomic Environment
- Market Sentiment and Demand Drivers: Long-term price trends for LL depend heavily on market demand for Layer 2 scaling solutions and regulatory developments within the cryptocurrency sector. Current market performance and investor sentiment play significant roles in price movement. The broader adoption of Layer 2 technology solutions creates expansion opportunities for platforms like LightLink.
Three、2025-2030 Year LL Price Forecast
2025 Outlook
- Conservative Forecast: $0.00662 - $0.0089
- Base Case Forecast: $0.00736
- Bullish Forecast: $0.0089 (requires sustained market recovery and increased adoption)
2026-2028 Medium-term Outlook
- Market Stage Expectation: Gradual accumulation phase with moderate growth trajectory, characterized by increasing institutional interest and expanding use cases
- Price Range Predictions:
- 2026: $0.00691 - $0.01195 (10% upside potential)
- 2027: $0.00954 - $0.01034 (36% cumulative gains)
- 2028: $0.00917 - $0.01487 (38% cumulative gains)
- Key Catalysts: Network infrastructure improvements, ecosystem development partnerships, regulatory clarity, and growing DeFi protocol integrations
2029-2030 Long-term Outlook
- Base Case Scenario: $0.01276 - $0.01825 (assumes continued market maturation and moderate adoption acceleration)
- Bullish Scenario: $0.01491 (assumes strong market momentum and significant protocol upgrades)
- Bull Run Scenario: $0.01825+ (assumes breakthrough adoption, major institutional inflows, and favorable macroeconomic conditions)
- 2030-12-31: LL projected at $0.01372 average valuation (mid-cycle consolidation phase)
Note: Price forecasts are subject to market volatility, regulatory changes, and technological developments. Monitor real-time data on Gate.com for accurate market pricing and trading opportunities.
| 年份 | 预测最高价 | 预测平均价格 | 预测最低价 | 涨跌幅 |
|---|---|---|---|---|
| 2025 | 0.0089 | 0.00736 | 0.00662 | 0 |
| 2026 | 0.01195 | 0.00813 | 0.00691 | 10 |
| 2027 | 0.01034 | 0.01004 | 0.00954 | 36 |
| 2028 | 0.01487 | 0.01019 | 0.00917 | 38 |
| 2029 | 0.01491 | 0.01253 | 0.0089 | 70 |
| 2030 | 0.01825 | 0.01372 | 0.01276 | 87 |
LightLink (LL) Investment Strategy and Risk Management Report
IV. LL Professional Investment Strategy and Risk Management
LL Investment Methodology
(1) Long-Term Hold Strategy
- Target Investors: Risk-averse institutional investors and long-term value seekers who believe in Ethereum Layer 2 ecosystem expansion
- Operational Recommendations:
- Accumulate LL tokens during market downturns, particularly when price falls below historical support levels
- Hold for 2-5 year periods to capture potential Layer 2 adoption growth and enterprise partnership expansion
- Dollar-cost averaging (DCA) approach to reduce timing risk across multiple tranches
(2) Active Trading Strategy
- Technical Analysis Tools:
- Support/Resistance Levels: Monitor key price points at $0.007345 (current price) and historical resistance at $0.3 (all-time high) to identify entry and exit opportunities
- Volume Analysis: Track the 24-hour volume of $14,572.69 to confirm price movements and identify potential breakouts
- Wave Trading Key Points:
- Entry signals: Watch for positive momentum during the 1-hour (+0.12%) and 7-day (+0.75%) price movements
- Exit signals: Consider profit-taking when approaching resistance zones, given the -83.67% 1-year decline indicates heightened volatility
LL Risk Management Framework
(1) Asset Allocation Principles
- Conservative Investors: 1-2% of total crypto portfolio
- Active Investors: 2-5% of total crypto portfolio
- Professional Investors: 5-10% of total crypto portfolio
(2) Risk Hedging Solutions
- Diversification Strategy: Balance LL holdings with other Ethereum Layer 2 projects and established cryptocurrencies to mitigate concentration risk
- Position Sizing: Set maximum loss thresholds at 10-15% of allocated capital per position, with stop-loss orders at key support levels
(3) Secure Storage Solutions
- Hot Wallet Option: Gate.com Web3 Wallet for frequent trading and liquidity management
- Cold Storage Method: Transfer long-term holdings to hardware wallets via gate.com for enhanced security
- Security Precautions: Never share private keys; use multi-signature wallets for large positions; enable two-factor authentication on all trading accounts; verify contract addresses before token transfers (LL contract: 0x0921799cb1d702148131024d18fcde022129dc73 on Ethereum)
V. LL Potential Risks and Challenges
LL Market Risk
- Extreme Volatility: LL has declined 83.67% over the past year and trades 97.55% below its all-time high of $0.3, indicating severe price instability and potential liquidation cascades during market stress events
- Low Liquidity: 24-hour trading volume of only $14,572.69 relative to market cap suggests insufficient liquidity for large position entries or exits, creating slippage and execution risks
- Market Sentiment Risk: Low market share (0.00023%) and ranking at #1853 indicate limited market acceptance and potential difficulty in attracting new capital inflows
LL Regulatory Risk
- Uncertain Classification: Layer 2 blockchain tokens may face evolving regulatory treatment across different jurisdictions, potentially impacting trading accessibility and token utility
- Compliance Requirements: Changes in securities regulations or anti-money laundering rules could restrict trading on current exchange networks, affecting liquidity
- Geographic Restrictions: Enterprise-focused positioning in APAC region may create regulatory conflicts if global compliance standards shift
LL Technical Risk
- Layer 2 Scalability Challenges: Dependency on Ethereum Layer 2 infrastructure means LL inherits risks from mainnet congestion, bridge security vulnerabilities, and protocol upgrades
- Smart Contract Vulnerabilities: ERC20 token implementation carries risks of contract bugs or exploits that could result in fund loss
- Adoption Uncertainty: Success depends on enterprise partner integration and dApp migration to LightLink network; failure to achieve adoption would diminish token utility
VI. Conclusion and Action Recommendations
LL Investment Value Assessment
LightLink presents a high-risk, high-uncertainty investment profile. While the Layer 2 blockchain ecosystem shows long-term potential for addressing Ethereum scalability, LL's current metrics—including a 97.55% decline from all-time high, minimal market capitalization of $7.35M, extremely low trading volume, and rank #1853 by market cap—indicate the project remains in early, volatile stages. The enterprise-focused APAC strategy differentiates it from consumer-oriented Layer 2s, but execution risk on partnership development and network adoption is substantial. Investors should view LL as a speculative venture requiring years for potential returns.
LL Investment Recommendations
✅ Beginners: Start with micro-positions (0.5-1% of crypto portfolio) through Gate.com; focus on learning Layer 2 technology fundamentals before scaling investment; avoid using leverage or margin trading ✅ Experienced Investors: Consider 2-5% allocation with DCA strategy during price support zones; utilize technical analysis to identify retracement opportunities; maintain strict stop-losses at 15% below entry ✅ Institutional Investors: Conduct due diligence on LightLink enterprise partnerships and network growth metrics; consider 5-10% allocation only after validating business development traction and Layer 2 market expansion
LL Trading Participation Methods
- Gate.com Spot Trading: Purchase LL directly using Gate.com's spot market for straightforward long-term holding
- OTC Trading: For large institutional positions, consider over-the-counter settlement to minimize slippage given low 24-hour volume
- Staking or DeFi Integration: Monitor potential rewards programs or Layer 2 DeFi opportunities on LightLink network once ecosystem matures
Cryptocurrency investment carries extreme risk and this report does not constitute investment advice. Investors must carefully assess their risk tolerance before committing capital. Always consult with professional financial advisors before making investment decisions. Never invest more than you can afford to lose.
FAQ
Will Chainlink ever reach $1000?
Yes, Chainlink could potentially reach $1,000 in the long term as the Web3 ecosystem expands and oracle services become increasingly critical infrastructure. With continued adoption and innovation, achieving this milestone is theoretically possible, though it would require sustained growth over many years.
What is the price prediction for the LL token?
LL token is predicted to reach $0.007429 by December 25, 2025, and $0.01505 by 2030. Based on technical analysis, the price may experience slight volatility in the short term before potential growth.
How high can a link go in 2025?
LINK could potentially reach $20-$30 in 2025 based on current market trends and institutional adoption momentum. Strong technical support and whale accumulation suggest positive upside potential throughout the year.
How much will Chainlink cost in 2030?
Analysts predict Chainlink (LINK) could reach an average price of $4.94 by 2030, with projections ranging between $4.32 and $5.82. Some forecasts suggest it could potentially reach $60.77 depending on market conditions.
What factors could influence Chainlink's price in the future?
Chainlink's price could be influenced by macroeconomic factors, institutional partnerships, whale activity, Total Value Secured growth, and adoption of its oracle solutions. Long-term fundamentals remain strong.
How does Chainlink's current price compare to its historical highs?
Chainlink's current price of $18.80 represents a strong position relative to historical levels. While still below its all-time peak of around $52, the token has recovered significantly, reflecting growing adoption and market confidence in decentralized oracle solutions.
Share
Content
Introduction: LL's Market Position and Investment Value
I. LL Price History Review and Market Status
II. Core Factors Influencing LL's Future Price
Three、2025-2030 Year LL Price Forecast
IV. LL Professional Investment Strategy and Risk Management
V. LL Potential Risks and Challenges
VI. Conclusion and Action Recommendations
FAQ
Trending Cryptocurrencies


ATS vs LRC: Comparing Automated Tracking Systems and Learning Resource Centers in Modern Education

DEEP vs OP: Unveiling the Power of Neural Networks in Competitive Gaming

Is Netswap (NETT) a good investment?: Analyzing the Potential and Risks of this DeFi Token
Is Netswap (NETT) a good investment?: Analyzing the potential and risks of this decentralized exchange token

ONX vs LRC: Comparing Two Promising Blockchain Projects in the DeFi Space

2025 DYDX Price Prediction: Analyzing Market Trends and Potential Growth Factors for the DeFi Token

What is ENSO? New Infrastructure for Web3 and Smart Contract Automation
Michael Saylor: The Path to Leadership in the Cryptocurrency Sphere
What is a Bitcoin hardware wallet
Introduction to Phantom Wallet and How to Use It
What is LYP: A Comprehensive Guide to Understanding Lymphocyte Yield Protocol in Modern Medical Testing