2025 LIME Price Prediction: Expert Analysis and Market Outlook for the Coming Year


Introduction: LIME's Market Position and Investment Value
LIME (LIME), as an intelligent platform that integrates Telegram-based communication software, encrypted wallet, and DeFi tools, has been empowering users since its launch in 2021. As of 2025, LIME's market capitalization has reached $5,188,575.51, with a circulating supply of approximately 757.55 million tokens, and the price is currently maintained around $0.005209. This innovative asset, recognized for bridging mainstream communities and the crypto ecosystem, is playing an increasingly important role in facilitating user-friendly cryptocurrency management and DeFi functionality.
This article will comprehensively analyze LIME's price trends from 2025 to 2030, combining historical patterns, market supply and demand dynamics, ecosystem development, and macroeconomic environment factors to provide investors with professional price forecasts and practical investment strategies.
LIME Price History Review and Market Status
I. LIME Price History Review and Current Market Status
LIME Historical Price Evolution
-
November 20, 2021: LIME reached its all-time high (ATH) of $0.271381, marking the peak of the token's market valuation during the 2021 cryptocurrency bull market cycle.
-
November 10, 2022: LIME hit its all-time low (ATL) of $0.00400618, reflecting significant depreciation from its historical peak and indicating substantial market correction during the 2022 bear market period.
-
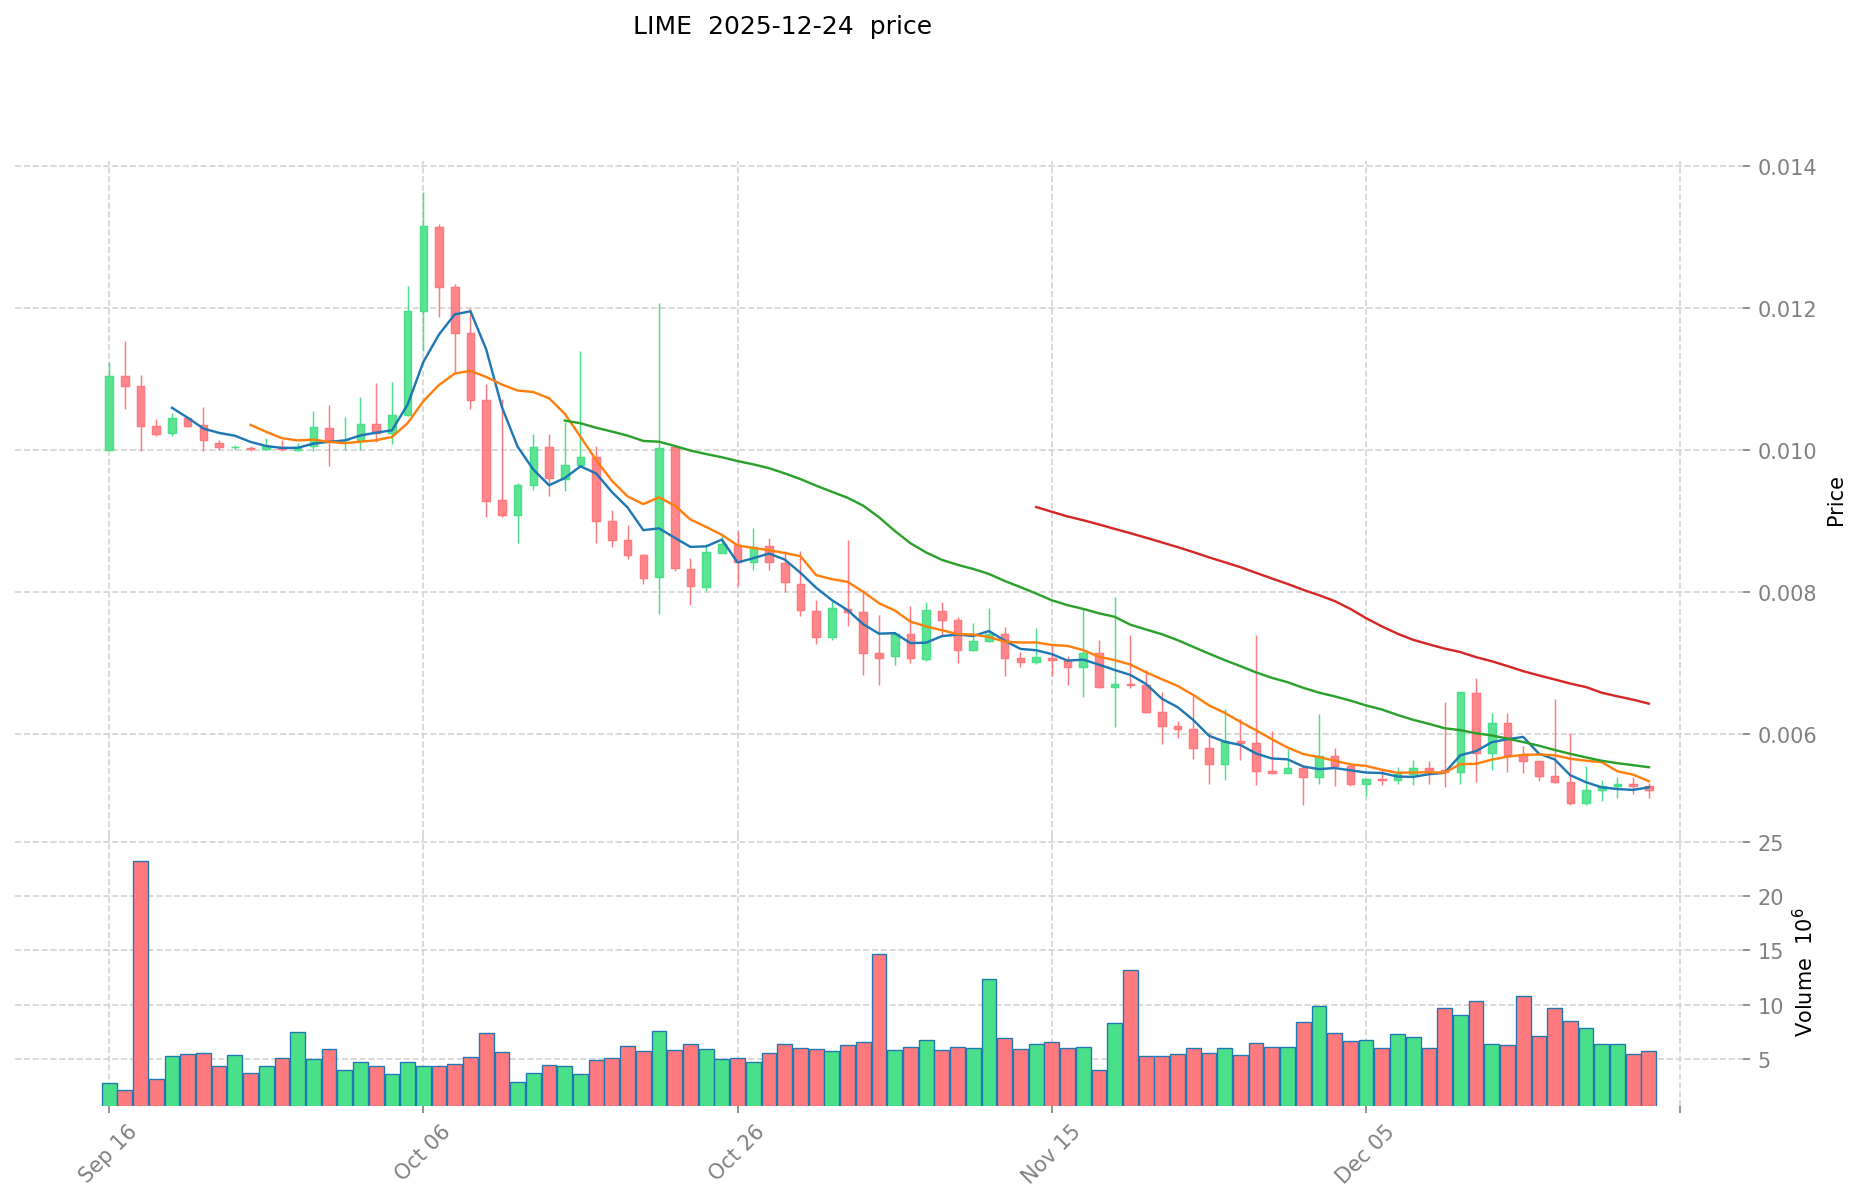
2025 Performance: Over the past year, LIME has experienced a sharp decline of -89.85%, falling from approximately $0.047320 to the current level of $0.005209, demonstrating sustained downward pressure.
LIME Current Market Status
As of December 24, 2025, LIME is trading at $0.005209, representing a modest 24-hour decline of -1.15%. The token has experienced additional short-term pressure, with 1-hour and 7-day changes of -0.22% and -3.57% respectively.
The 24-hour trading range stands between $0.0051 and $0.005314, with a daily trading volume of $31,319.01. LIME's fully diluted market capitalization is valued at approximately $5.19 million, while its circulating market cap stands at $3.95 million. The token maintains a circulating supply of 757.55 million LIME out of a maximum supply of 996.08 million tokens, representing a circulation ratio of 76.05%.
With a market dominance of 0.00016%, LIME ranks 1,687 among all cryptocurrency assets. The current market sentiment reflects "Extreme Fear" conditions in the broader cryptocurrency market (VIX: 24).
Click to view current LIME market price
LIME Market Sentiment Index
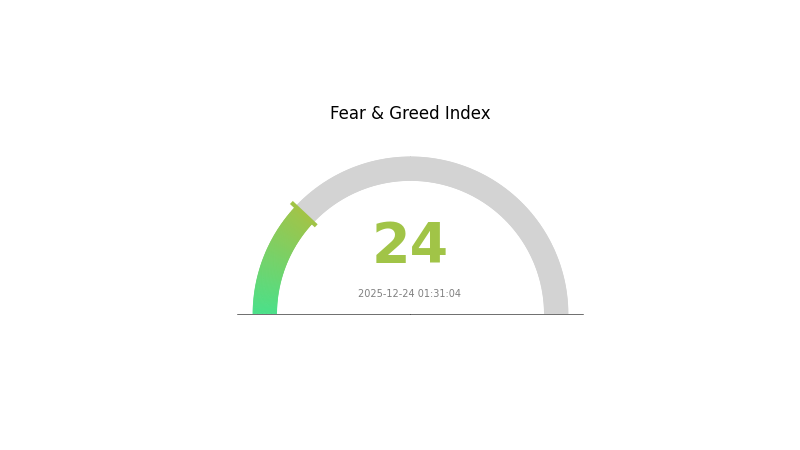
2025-12-24 Fear and Greed Index: 24 (Extreme Fear)
Click to view current Fear & Greed Index
The crypto market is currently experiencing extreme fear with an index reading of 24. This indicates heightened market anxiety and pessimistic sentiment among investors. During periods of extreme fear, historically savvy investors often view market corrections as potential buying opportunities. However, it's crucial to conduct thorough research and assess your risk tolerance before making investment decisions. Monitor market developments closely on Gate.com to stay informed about price movements and emerging opportunities in this volatile environment.
LIME Holdings Distribution
Click to view current LIME holdings distribution
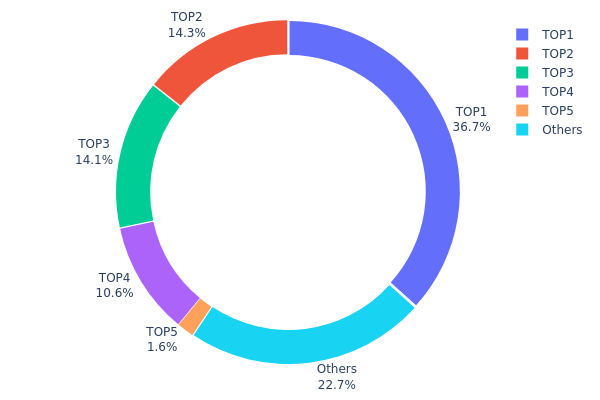
The address holdings distribution chart illustrates the concentration of token ownership across blockchain addresses, serving as a critical indicator of network decentralization and potential market manipulation risks. By analyzing the top holders and their respective percentages, investors and analysts can assess the degree of wealth concentration and the vulnerability of the token to coordinated selling pressure or price volatility.
LIME exhibits significant concentration risk, with the top four addresses collectively controlling 75.67% of the total supply. The leading address (0x2912...fcbf7b) alone commands 36.67% of holdings, representing an exceptionally dominant position that substantially exceeds healthy decentralization thresholds. The second and third addresses maintain comparable stakes at 14.29% and 14.08% respectively, while the fourth address holds 10.63%. This distribution pattern reveals a highly top-heavy structure characteristic of tokens in early distribution phases or those with substantial allocations reserved for core teams, strategic investors, or ecosystem reserves.
The remaining addresses constitute 24.33% of the supply, with the dispersed "Others" category accounting for 22.73%. This bifurcated structure suggests a market characterized by limited liquidity depth and elevated vulnerability to price manipulation through concentrated selling. The significant concentration among a small cohort of addresses elevates systemic risk, as coordinated liquidation or substantial position reduction by top holders could generate substantial downward price pressure. Furthermore, the current distribution pattern indicates a nascent market structure with limited organic decentralization, warranting careful monitoring of holder behavior and token flow dynamics.
| Top | Address | Holding Qty | Holding (%) |
|---|---|---|---|
| 1 | 0x2912...fcbf7b | 18338.62K | 36.67% |
| 2 | 0x707f...ac6e05 | 7148.98K | 14.29% |
| 3 | 0x6cae...4d6898 | 7044.85K | 14.08% |
| 4 | 0x4de8...f6caae | 5318.47K | 10.63% |
| 5 | 0x54dd...4ccac6 | 800.00K | 1.60% |
| - | Others | 11349.07K | 22.73% |
II. Core Factors Influencing LIME's Future Price
Machine and Whale Dynamics
-
Holder Concentration: The top 5 wallet addresses hold approximately 76.67% of LIME tokens, with the largest holder controlling 36.67% of the circulating supply. This high concentration presents significant centralization risk and potential price volatility triggered by large holder movements.
-
Market Sentiment: As of November 2025, market sentiment is characterized as "extreme fear" based on the Fear and Greed Index, indicating depressed investor confidence despite the project's fundamental positioning.
Macroeconomic Environment
-
Monetary Policy Impact: Interest rate adjustments and central bank policy decisions directly influence the attractiveness of cryptocurrency investments like LIME as alternative assets.
-
Safe-Haven Properties: In inflationary environments, LIME demonstrates "digital gold" characteristics, providing portfolio hedging functionality and increasing investment demand during periods of macroeconomic uncertainty.
-
Geopolitical Factors: International political instability can amplify demand for LIME as investors seek to diversify away from traditional financial assets and fiat currency exposure.
III. LIME Price Forecast for 2025-2030
2025 Outlook
- Conservative Forecast: $0.00465 - $0.00522
- Base Case Forecast: $0.00522
- Bullish Forecast: $0.00632 (requires sustained market interest and positive ecosystem developments)
2026-2028 Medium-term Outlook
- Market Stage Expectations: Consolidation phase with gradual accumulation, followed by recovery and early expansion phases as adoption metrics improve
- Price Range Predictions:
- 2026: $0.00294 - $0.00779 (10% upside potential)
- 2027: $0.00563 - $0.00963 (30% upside potential)
- 2028: $0.00788 - $0.01181 (57% upside potential)
- Key Catalysts: Protocol upgrades, increased institutional participation, expansion of use cases, growing DeFi integration, and enhanced market liquidity through platforms like Gate.com
2029-2030 Long-term Outlook
- Base Case Scenario: $0.00941 - $0.01001 (92% growth potential by 2029, assuming steady market conditions and consistent development progress)
- Bullish Scenario: $0.01091 - $0.01181 (reflecting accelerated adoption and positive regulatory environment)
- Transformative Scenario: $0.01462 (109% growth by 2030 under extreme favorable conditions including major partnerships, mainstream adoption breakthrough, and favorable macroeconomic conditions)
- December 24, 2025: LIME trading near $0.00522 (early consolidation phase)
| 年份 | 预测最高价 | 预测平均价格 | 预测最低价 | 涨跌幅 |
|---|---|---|---|---|
| 2025 | 0.00632 | 0.00522 | 0.00465 | 0 |
| 2026 | 0.00779 | 0.00577 | 0.00294 | 10 |
| 2027 | 0.00963 | 0.00678 | 0.00563 | 30 |
| 2028 | 0.01181 | 0.0082 | 0.00788 | 57 |
| 2029 | 0.01181 | 0.01001 | 0.00941 | 92 |
| 2030 | 0.01462 | 0.01091 | 0.00785 | 109 |
iMe Lab (LIME) Investment Strategy and Risk Management Report
IV. LIME Professional Investment Strategy and Risk Management
LIME Investment Methodology
(1) Long-term Holding Strategy
- Suitable Investors: Those who believe in the long-term potential of integrated communication and DeFi platforms, with extended investment horizons of 2+ years
- Operational Recommendations:
- Accumulate during market downturns when LIME trades significantly below historical highs, given the current 89.85% decline from all-time high
- Dollar-cost averaging (DCA) approach to reduce timing risk and entry point volatility
- Store acquired LIME tokens securely in Gate Web3 wallet for long-term holding
(2) Active Trading Strategy
- Market Analysis Tools:
- Price Action: Monitor the 24-hour and 7-day price trends; current data shows -1.15% in 24h and -3.57% in 7d volatility
- Volume Analysis: Track the 24-hour trading volume of $31,319 USD to identify liquidity conditions and potential breakout opportunities
- Trading Operation Key Points:
- Watch for support levels near historical low price of $0.00400618 and resistance near recent highs around $0.005314
- Consider entry points during significant oversold conditions, but remain cautious given the project's extended downtrend
LIME Risk Management Framework
(1) Asset Allocation Principles
- Conservative Investors: 1-2% portfolio allocation maximum
- Active Investors: 3-5% portfolio allocation
- Professional Investors: 5-10% portfolio allocation for qualified traders familiar with emerging platform tokens
(2) Risk Hedging Solutions
- Position Sizing Control: Limit LIME holdings to predetermined percentages of total crypto portfolio to manage volatility exposure
- Diversification Strategy: Combine LIME investments with more established blockchain assets to balance portfolio risk
(3) Secure Storage Solutions
- Hot Wallet Option: Gate Web3 Wallet recommendation for frequent traders requiring liquidity and ease of access
- Cold Storage Approach: Transfer LIME tokens to secure offline storage for long-term holders prioritizing security over accessibility
- Security Considerations: Never share private keys or seed phrases; enable two-factor authentication on all trading and storage accounts; verify smart contract addresses before token transfers
V. LIME Potential Risks and Challenges
LIME Market Risk
- Extreme Price Volatility: LIME has experienced an 89.85% decline over the past year, indicating significant market uncertainty and liquidity challenges
- Liquidity Constraints: With only 6 exchange listings and relatively modest 24-hour volume of $31,319, trading large positions may face slippage and execution challenges
- Market Sentiment Deterioration: The persistent downtrend reflects declining investor confidence, which may continue suppressing price recovery
LIME Regulatory Risk
- Emerging Platform Compliance: As an integrated communication and DeFi platform, LIME faces evolving regulatory scrutiny regarding financial services, especially in different jurisdictions
- Telegram Integration Complexity: Potential regulatory concerns regarding financial services operations through messaging platforms remain uncertain
- Global Regulatory Uncertainty: The absence of clear regulatory frameworks for integrated communication-DeFi platforms creates ongoing compliance risk
LIME Technology Risk
- Smart Contract Vulnerabilities: As a BSC-based token, LIME depends on the security of its deployed smart contracts and the underlying Binance Smart Chain infrastructure
- Integration Complexity: The combination of communication software, wallet, and DeFi tools presents complex technical dependencies that could introduce operational risks
- Adoption Challenges: The platform must overcome significant barriers to achieve meaningful user adoption alongside established competitors in both communication and DeFi sectors
VI. Conclusion and Action Recommendations
LIME Investment Value Assessment
iMe Lab presents a conceptually ambitious platform attempting to bridge mainstream communication users and the cryptocurrency ecosystem through Telegram integration. However, the project faces substantial headwinds evidenced by its 89.85% depreciation from all-time highs and limited market capitalization of approximately $5.19 million USD. The current market dynamics suggest investors maintain significant caution, as the project struggles to establish sufficient liquidity and user adoption to justify recovery. While the long-term vision of integrated communication and DeFi tools holds theoretical merit, execution risks and competitive pressures remain considerable.
LIME Investment Recommendations
✅ Beginners: Start with minimal allocations (0.5-1% of crypto holdings maximum) only after thorough research; consider this an extremely high-risk, speculative position unsuitable for most retail investors
✅ Experienced Investors: Implement strict position sizing discipline (3-5% maximum) with predetermined exit rules; treat LIME as a venture-stage investment requiring high risk tolerance
✅ Institutional Investors: Conduct extensive due diligence on team credentials, technical architecture, and regulatory compliance; consider LIME only as a small allocation within a diversified crypto venture portfolio (under 5%)
LIME Trading Participation Methods
- Direct Token Purchase: Acquire LIME through available exchanges on Gate.com or other listed platforms; verify contract address 0x7bc75e291e656e8658d66be1cc8154a3769a35dd (BSC network)
- Decentralized Exchange Trading: Access LIME through integrated DeFi tools available within the iMe platform itself for users already on the ecosystem
- Dollar-Cost Averaging: Execute systematic purchases over extended periods to reduce downside risk from volatile entry points
Cryptocurrency investment carries extreme risk. This report does not constitute investment advice. Investors must make decisions according to their personal risk tolerance and should consult professional financial advisors. Never invest capital you cannot afford to lose completely.
FAQ
What is the current price of LIME token and what is its all-time high price?
LIME token is currently trading at $0.0091727. The all-time high price information is not currently available in our data sources.
What is the 12-month price prediction for LIME?
Based on analyst forecasts as of December 24, 2025, LIME's 12-month average price target is $125. This represents the consensus prediction, with highest and lowest targets also at $125, indicating strong analyst confidence in this price level.
What are the main factors affecting LIME price?
LIME price is primarily influenced by supply and demand dynamics, market sentiment, trading volume, news events, and investor behavior. Social media discussions and broader market conditions also play significant roles in price movements.
What are LIME's advantages and risks compared to similar projects?
LIME offers superior user experience and technical support with lower operational risks compared to competitors. Key advantages include stable market positioning and efficient resource management. Main risks involve high maintenance costs and market volatility dependency.
Share
Content
Introduction: LIME's Market Position and Investment Value
I. LIME Price History Review and Current Market Status
II. Core Factors Influencing LIME's Future Price
III. LIME Price Forecast for 2025-2030
IV. LIME Professional Investment Strategy and Risk Management
V. LIME Potential Risks and Challenges
VI. Conclusion and Action Recommendations
FAQ
How to Buy Cryptocurrency


Trending Cryptocurrencies


2025 EULPrice Prediction: Market Analysis and Future Trends for Euler Finance Token in the DeFi Ecosystem
2025 EDGEPrice Prediction: Analysis of Growth Potential and Market Factors Influencing the Future Value
2025 BENQI Price Prediction: Analyzing Market Trends and Future Valuation for the DeFi Protocol
2025 ASTER Price Prediction: Analyzing Market Trends and Growth Potential for the Emerging Cryptocurrency

2025 OMG Price Prediction: Analyzing Market Trends and Future Potential of the Token in a Maturing Crypto Ecosystem

2025 MORPHO Price Prediction: Analyzing Market Trends and Growth Potential for the DeFi Token

Hamster Kombat Daily Combo & Cipher Answer 3 january 2026
Dropee Daily Combo for 3 january 2026
How Does Chainlink (LINK) Price Volatility Compare to Bitcoin and Ethereum in 2026?
How Does GTETH Price Volatility Compare to ETH: Support and Resistance Analysis in 2026?

What Does ADA Technical Analysis Reveal: MACD Death Cross and RSI Signals Explained