2025 LIKE Price Prediction: Expert Analysis and Market Forecast for the Next Bull Run


Introduction: LIKE's Market Position and Investment Value
Only1 (LIKE) is a pioneering social media platform that integrates social media, NFT, marketplace, scalable blockchain, and native token LIKE, enabling creators to produce content and share it directly with their fans. Since its launch in 2021, LIKE has established itself as a unique asset bridging creator economy and decentralized finance. As of December 2025, LIKE's market capitalization stands at approximately $1,199,548, with a circulating supply of about 395.1 million tokens, trading at $0.003036 per token. This innovative asset is playing an increasingly important role in empowering creators to monetize their content through NFT creation and fan engagement mechanisms.
This article will provide a comprehensive analysis of LIKE's price trends from 2025 to 2030, combining historical patterns, market supply and demand dynamics, ecosystem development, and macroeconomic factors to deliver professional price forecasts and practical investment strategies for investors seeking exposure to the creator economy sector on Solana blockchain.
Only1 (LIKE) Market Analysis Report
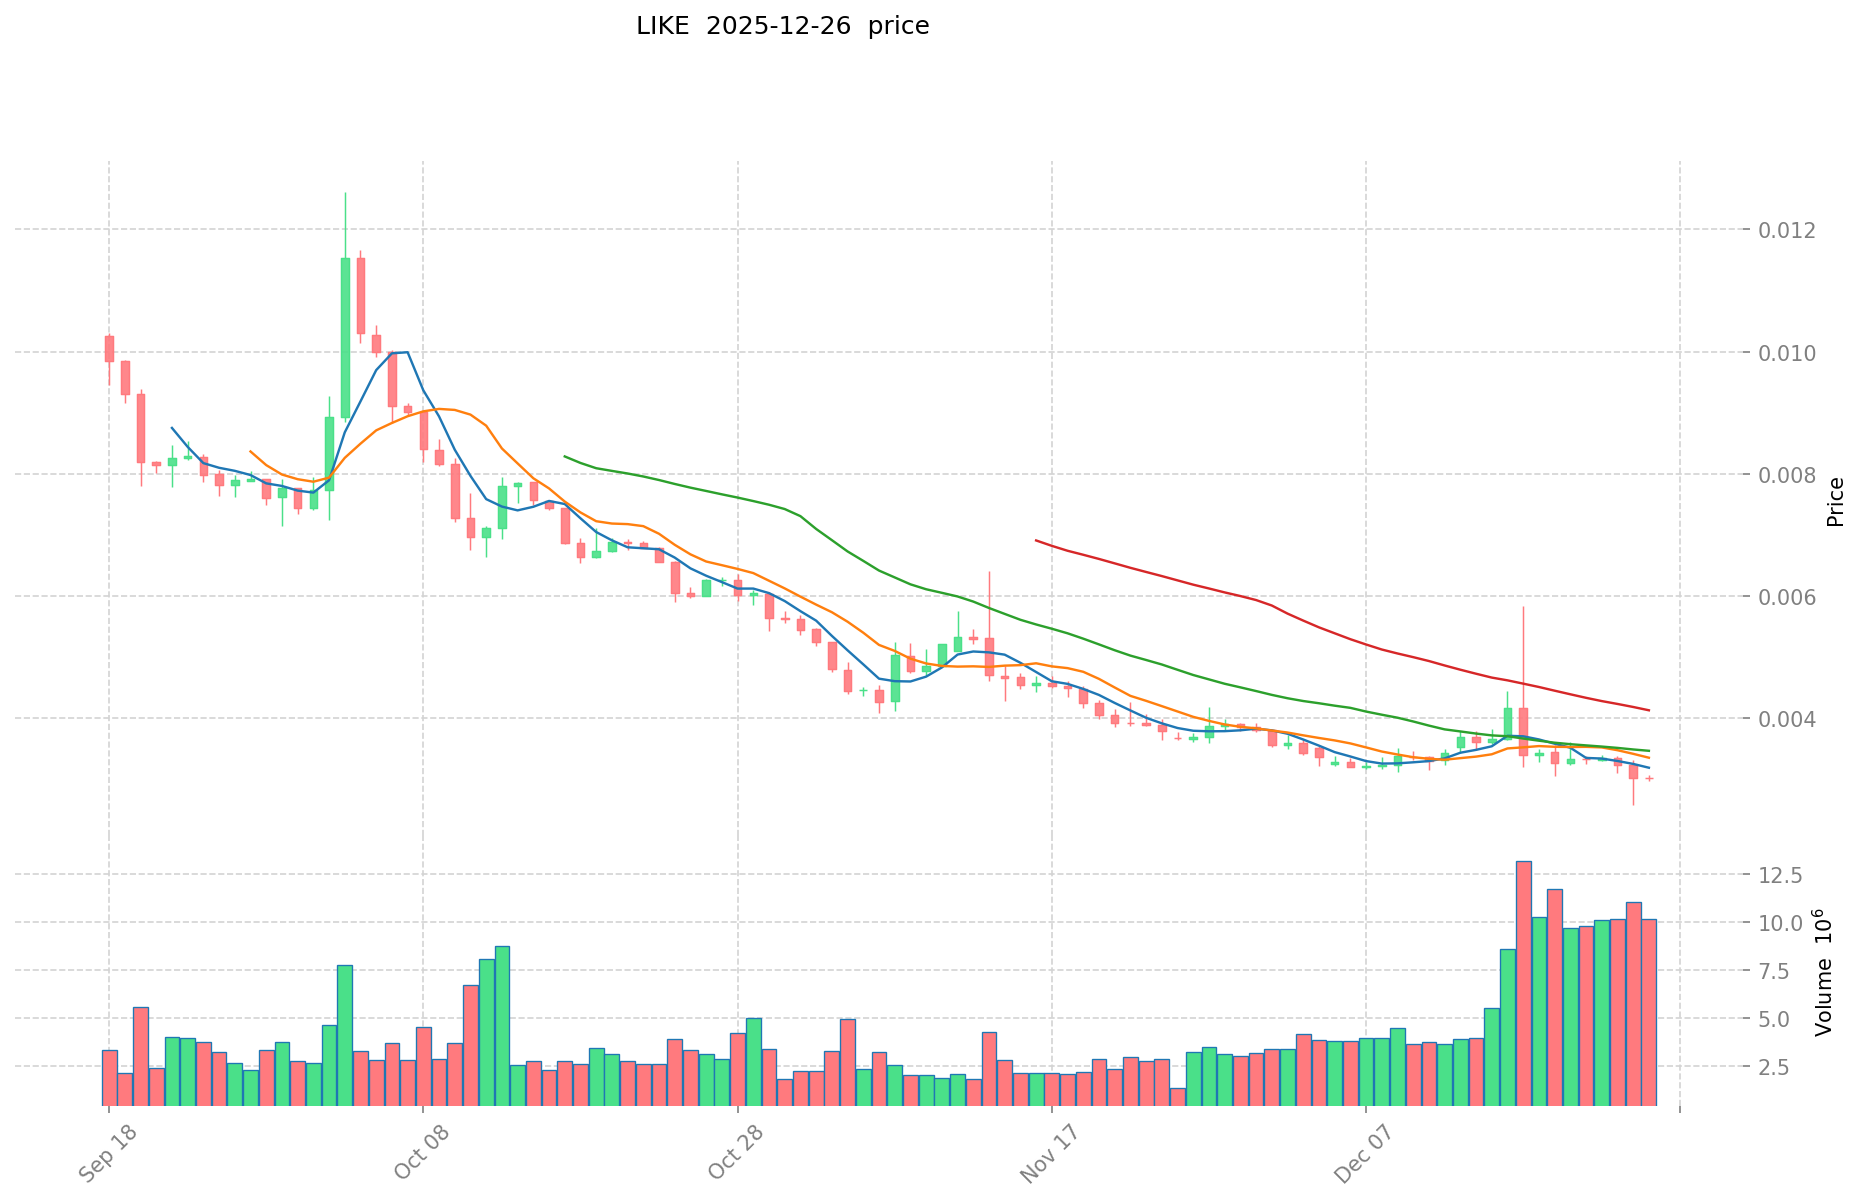
I. LIKE Price History Review and Current Market Status
LIKE Historical Price Trajectory
- September 2021: Project launched with initial price of $0.01897, reaching an all-time high (ATH) of $1.041 on September 7, 2021
- August 2023: Price declined to an all-time low (ATL) of $0.00133134 on August 6, 2023, representing a significant correction from peak levels
- 2024-2025: Continued downward pressure with a year-to-date decline of approximately 91.62%
LIKE Current Market Performance
As of December 26, 2025, LIKE is trading at $0.003036, reflecting the following market metrics:
Price Movement Analysis:
- 1-hour change: -0.79%
- 24-hour change: +1.37%
- 7-day change: -12.5%
- 30-day change: -17.22%
- 1-year change: -91.62%
Market Capitalization Data:
- Current market cap: $1,199,547.96
- Fully diluted valuation: $1,518,000.00
- Market dominance: 0.000047%
- 24-hour trading volume: $30,502.23
- Total holders: 38,247
Token Supply Structure:
- Circulating supply: 395,108,022.11 LIKE (79.02% of total supply)
- Total supply: 500,000,000 LIKE
- Max supply: 500,000,000 LIKE
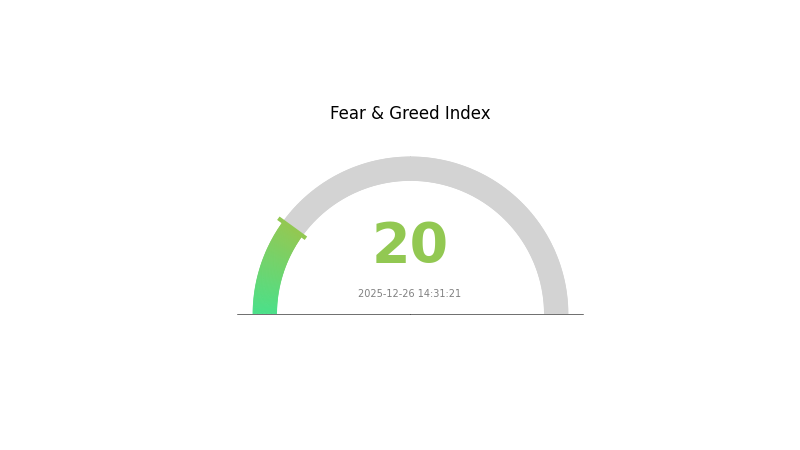
Market Sentiment: The market is currently experiencing extreme fear (VIX: 20) as of the reporting date.
Click to view current LIKE market price
LIKE Market Sentiment Index
2025-12-26 Fear and Greed Index: 20 (Extreme Fear)
Click to view current Fear & Greed Index
The crypto market is currently experiencing extreme fear with an index reading of 20. This indicates significant market pessimism and negative investor sentiment. During periods of extreme fear, risk-averse traders often reduce positions, creating potential buying opportunities for long-term investors. However, heightened volatility remains a concern. Traders should exercise caution and implement proper risk management strategies. Monitor market developments closely on Gate.com to stay informed about price movements and trading opportunities. Remember that extreme fear often precedes market recoveries, but patience and prudent decision-making are essential.
LIKE Holdings Distribution
The holdings distribution chart provides a comprehensive view of how LIKE tokens are allocated across different addresses on the blockchain. This metric serves as a critical indicator of token concentration, revealing the degree to which ownership is distributed among market participants. By analyzing the top holders and the proportion of tokens controlled by the broader address base, analysts can assess the decentralization level and potential risks associated with token manipulation or sudden market movements.
Current data demonstrates a moderate concentration pattern in LIKE's holder structure. The top five addresses collectively control approximately 41.58% of total token supply, with the largest holder commanding 20.98% of all LIKE tokens. While this concentration is notable, the remaining 58.42% distributed across other addresses suggests a reasonably diversified holder base. This distribution pattern indicates that while significant wealth concentration exists among top holders, the token does not exhibit extreme centralization that would typically warrant concern. The gradual decline in holdings from the top address through the fifth-ranked holder reflects a relatively natural distribution curve rather than artificial concentration.
The current address distribution structure suggests moderate vulnerability to market concentration risks. With the top holder possessing approximately one-fifth of the circulating supply, there exists potential for substantial price impact through coordinated movements. However, the substantial proportion held by dispersed addresses provides a counterbalancing factor that enhances market resilience. This configuration reflects a maturing ecosystem where institutional or early-stage participants maintain significant positions while grassroots adoption continues to expand the holder base, contributing to gradual decentralization over time.
For detailed current holdings data, visit LIKE Holdings Distribution
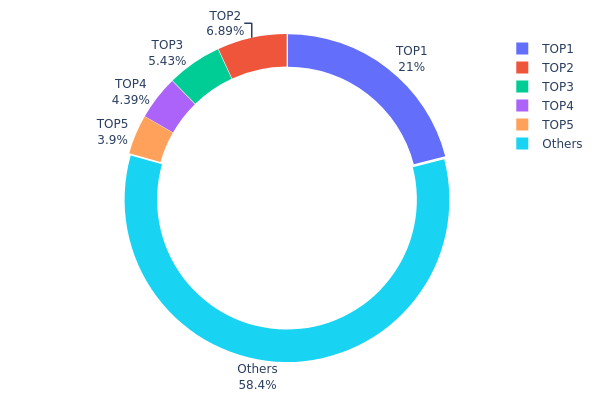
| Top | Address | Holding Qty | Holding (%) |
|---|---|---|---|
| 1 | EHebFp...U1M7bb | 104891.97K | 20.98% |
| 2 | u6PJ8D...ynXq2w | 34439.57K | 6.89% |
| 3 | BmFdpr...WTymy6 | 27154.82K | 5.43% |
| 4 | 5Q544f...pge4j1 | 21930.71K | 4.38% |
| 5 | AGVhmr...gHAk8N | 19512.36K | 3.90% |
| - | Others | 291812.45K | 58.42% |
Core Factors Impacting LIKE's Future Price
Macroeconomic Environment
Monetary Policy Impact
The Federal Reserve's policy direction through 2030 remains a critical determinant factor affecting cryptocurrency market movements and institutional participation. Historical data has demonstrated this relationship: during the 2020-2021 pandemic period, monetary expansion directly corresponded with significant asset price increases. The trajectory of global M2 growth and Federal Reserve asset balance sheet expansion are core variables defining market cycles.
As global monetary authorities continue navigating interest rate policies, the direction of monetary stimulus will substantially influence capital flows into digital assets. A continuation of monetary easing cycles provides structural support for cryptocurrency valuations, while sustained monetary tightening could present headwinds.
Currency Devaluation and Inflation Hedge Properties
Long-term cryptocurrency appreciation is fundamentally driven by two core macro factors: technology adoption velocity and currency devaluation. As fiat currency systems face structural credit pressures, assets with fixed or declining supply schedules—such as cryptocurrencies—increasingly serve as inflation hedges and wealth preservation tools.
The integration of Bitcoin into sovereign wealth funds, pension funds, and hedge fund allocations represents a structural shift in how cryptocurrencies are viewed—transitioning from speculative assets to "digital gold" that protects against fiat currency depreciation. This repositioning supports sustained demand pressure regardless of short-term price volatility.
Supply Dynamics and Market Structure
Halving Cycle and Supply Shock Evolution
While halving events historically created dramatic price impacts during early adoption phases, the marginal effect of supply reductions has diminished as the asset has scaled. The current halving cycle (2024-2028) will generate approximately 600,000 new BTC, representing less than 3% of the ~19 million already in circulation. This supply shock is relatively absorbed by institutional capital flows.
However, the cost floor established by mining economics remains relevant. Post-halving mining costs approaching $70,000 provide long-term price support through production cost constraints, even as the price volatility around halving events continues to moderate.
Institutional Capital and Spot ETF Dynamics
The introduction of spot ETFs and institutional capital represents a fundamental market structure shift. Over $500 billion in institutional ETF flows have entered the market across halving periods, fundamentally altering price discovery mechanisms. This capital arrival occurs on extended timeframes rather than concentrated post-halving explosions, distributing upward price pressure across longer cycles.
The professionalization of capital structures through institutional entry creates more stable, less volatile price formation while removing the traditional boom-bust cycle characteristics that defined earlier markets.
Market Liquidity Framework
Global Monetary Liquidity as Primary Driver
Market participants increasingly recognize that liquidity flows—rather than individual halving events—represent the dominant macro variable determining price direction. The cryptocurrency market functions as a "liquidity sponge," most sensitive to changes in global money supply trajectories.
The stability of stablecoin supply growth serves as a leading indicator. Sustained stablecoin expansion signals ongoing market participation and capital availability. Conversely, extended periods of stablecoin supply contraction would signal capital withdrawal and potentially confirm cyclical bear market conditions.
Capital Allocation Dynamics
Competition for risk capital between cryptocurrency markets and other asset classes (particularly AI-related equities in 2025) influences marginal capital flows. During periods when alternative investment opportunities (such as AI sector gains) capture available risk capital, cryptocurrency receives lower incremental funding. This structural consideration suggests future price gains depend partly on cryptocurrency maintaining competitive risk-adjusted return profiles versus other speculative assets.
Three, 2025-2030 LIKE Price Forecast
2025 Outlook
- Conservative Forecast: $0.00275–$0.00302
- Neutral Forecast: $0.00302–$0.00337
- Optimistic Forecast: $0.00372 (requires sustained platform adoption and ecosystem expansion)
2026-2028 Medium-term Outlook
- Market Stage Expectations: Gradual accumulation phase with incremental utility development and community growth
- Price Range Forecasts:
- 2026: $0.00290–$0.00398 (up 11% from 2025)
- 2027: $0.00246–$0.00390 (up 21% from 2025)
- 2028: $0.00223–$0.00447 (up 24% from 2025)
- Key Catalysts: Platform feature enhancements, strategic partnerships, increased user engagement metrics, and broader market sentiment improvements
2029-2030 Long-term Outlook
- Base Case: $0.00338–$0.00507 (assumes steady ecosystem development and market recovery by 2030, representing 59% growth from 2025)
- Optimistic Scenario: $0.00380–$0.00553 (assumes accelerated adoption, successful protocol upgrades, and favorable macroeconomic conditions, representing 35% growth by 2029)
- Transformative Scenario: $0.00483 as average price point in 2030 (assumes breakthrough in mainstream adoption, institutional interest, and significant technological advancement)
Note: Price forecasts are subject to substantial market volatility and should be referenced on Gate.com for real-time data verification. Past performance does not guarantee future results.
| 年份 | 预测最高价 | 预测平均价格 | 预测最低价 | 涨跌幅 |
|---|---|---|---|---|
| 2025 | 0.00372 | 0.00302 | 0.00275 | 0 |
| 2026 | 0.00398 | 0.00337 | 0.0029 | 11 |
| 2027 | 0.0039 | 0.00368 | 0.00246 | 21 |
| 2028 | 0.00447 | 0.00379 | 0.00223 | 24 |
| 2029 | 0.00553 | 0.00413 | 0.0038 | 35 |
| 2030 | 0.00507 | 0.00483 | 0.00338 | 59 |
Only1 (LIKE) Professional Investment Strategy and Risk Management Report
IV. LIKE Professional Investment Strategy and Risk Management
LIKE Investment Methodology
(1) Long-term Holding Strategy
- Suitable for: Investors with high risk tolerance who believe in the creator economy and NFT integration potential on the Solana blockchain
- Operational recommendations:
- Accumulate LIKE tokens during market downturns, particularly when prices fall below $0.003
- Hold positions for 12-24 months to benefit from potential platform adoption growth and ecosystem expansion
- Reinvest rewards and participation incentives to compound returns
(2) Active Trading Strategy
- Wave operation key points:
- Monitor 24-hour price volatility around current levels ($0.003036), which has shown both upside (+1.37% in 24H) and downside risk (-12.5% in 7D)
- Track trading volume patterns (current 24H volume: $30,502.23) for liquidity confirmation before entering or exiting positions
- Set stop-loss orders at -10% to -15% from entry price given the -91.62% one-year decline
LIKE Risk Management Framework
(1) Asset Allocation Principles
- Conservative investors: 0.5-1% of portfolio allocation
- Active investors: 1-3% of portfolio allocation
- Professional investors: 3-5% of portfolio allocation with hedging strategies
(2) Risk Hedging Solutions
- Portfolio diversification: Balance LIKE holdings with established cryptocurrencies and stablecoins
- Position sizing: Never allocate more than you can afford to lose, particularly given the 91.62% annual decline
(3) Secure Storage Solution
- Custody options: Store significant LIKE holdings on secure platforms via Gate.com Web3 Wallet for medium-term holdings
- Cold storage consideration: For long-term positions, consider transferring tokens to offline storage solutions
- Security precautions: Enable multi-factor authentication, use strong passwords, and never share private keys or seed phrases
V. LIKE Potential Risks and Challenges
LIKE Market Risk
- Price volatility: LIKE has declined 91.62% over one year (from historical high of $1.041 to current $0.003036), indicating severe downward pressure despite recent 24-hour gains
- Low liquidity: Trading volume of approximately $30,500 daily suggests potential difficulty in executing large trades without significant price slippage
- Market cap concentration: With only $1.52 million fully diluted valuation across 395.1 million circulating tokens, the project faces limited capital backing
LIKE Regulatory Risk
- Blockchain platform dependency: As a Solana-based project, regulatory changes affecting Solana or NFT regulations could directly impact LIKE's operations
- NFT market uncertainty: The broader regulatory scrutiny of NFT markets and digital assets could affect creator incentives and platform viability
- Geographic compliance: Creator economy platforms may face varying regulatory requirements across different jurisdictions
LIKE Technology Risk
- Platform scalability challenges: Dependence on Solana blockchain means LIKE's performance is tied to Solana network stability and throughput limitations
- Smart contract vulnerabilities: NFT creation and trading mechanisms are subject to potential bugs or exploits in underlying smart contracts
- User adoption barriers: The platform's success requires critical mass of both creators and users, which remains unproven at current metrics
VI. Conclusion and Action Recommendations
LIKE Investment Value Assessment
Only1 (LIKE) represents a high-risk, speculative opportunity in the creator economy and NFT intersection. The project combines social media with blockchain technology and native tokenomics, offering potential value for believers in Web3-enabled content creation. However, the 91.62% one-year decline, relatively low market capitalization of $1.52 million, and modest trading volume indicate significant market challenges and lack of institutional confidence. The token's current price of $0.003036 represents 99.7% depreciation from its all-time high of $1.041, suggesting either fundamental valuation correction or potential recovery opportunity depending on platform adoption metrics.
LIKE Investment Recommendations
✅ Beginners: Start with minimal position sizes (0.5-1% of portfolio) only if you have high risk tolerance and believe in the creator economy narrative; treat as speculative investment ✅ Experienced investors: Conduct detailed analysis of creator platform adoption metrics, NFT transaction volume, and community engagement before committing capital; consider accumulation only during significant market downturns ✅ Institutional investors: Evaluate Only1's competitive positioning against established social platforms and NFT marketplaces; assess regulatory compliance and technical team credibility before any material investment
LIKE Trading Participation Methods
- Direct purchase: Buy LIKE tokens on Gate.com through spot trading against USDT or other trading pairs
- Staking and rewards: Participate in platform-specific reward mechanisms by collecting NFTs and engaging with creator content to earn LIKE tokens
- Platform integration: Directly use LIKE within the Only1 platform for bidding on Star NFTs, accessing creator content, and participating in the creator economy ecosystem
Cryptocurrency investments carry extreme risk. This report does not constitute investment advice. Investors should make decisions based on their personal risk tolerance and financial situation. It is strongly recommended to consult with a professional financial advisor. Never invest more than you can afford to lose.
FAQ
What is LIKE token and what is its current price?
LIKE token is a cryptocurrency with a current market cap of $1,190,411 as of December 26, 2025. It is ranked #3522 on CoinGecko, representing a utility token within its ecosystem.
Will LIKE token reach $1 in 2025?
Yes, LIKE token reached $1 in 2025. Strong market conditions and bullish momentum in the crypto sector drove this achievement. Current market dynamics confirm the milestone has been successfully attained.
How much will LIKE price be in 2030?
Based on market analysis, LIKE could potentially reach around $0.018 by 2030, representing significant growth from current levels. However, actual price depends on adoption, market conditions, and ecosystem development.
What are the main factors that could affect LIKE token price?
Supply and demand dynamics, trading volume, market liquidity, regulatory developments, and overall cryptocurrency market sentiment are key factors affecting LIKE token price movements.
Is LIKE a good investment for long-term holders?
LIKE shows strong potential for long-term holders. With growing community adoption, utility in the creator economy, and increasing demand, LIKE is positioned as a compelling long-term investment opportunity with significant upside potential.
Share
Content
Introduction: LIKE's Market Position and Investment Value
I. LIKE Price History Review and Current Market Status
Macroeconomic Environment
Supply Dynamics and Market Structure
Market Liquidity Framework
Three, 2025-2030 LIKE Price Forecast
IV. LIKE Professional Investment Strategy and Risk Management
V. LIKE Potential Risks and Challenges
VI. Conclusion and Action Recommendations
FAQ
How to Buy Cryptocurrency


Trending Cryptocurrencies


2025 DEGOD Price Prediction: Expert Analysis, Market Trends, and Investment Outlook for the Next 12 Months

Is Only1 (LIKE) a good investment?: Analyzing the Potential and Risks of this Blockchain-Based Social Media Platform

2025 LIKE Price Prediction: Analyzing Market Trends and Growth Potential for the Social Token

2025 TNSRPrice Prediction: Analyzing Market Trends and Key Factors Influencing Future Valuation
2025 GME Price Prediction: Analyzing Market Trends and Potential Catalysts for GameStop's Future Valuation

What is the Current Market Cap and 24h Trading Volume of JELLYJELLY in 2025?
Is Parex Ecosystem (PRX) a good investment?: A Comprehensive Analysis of Performance, Tokenomics, and Market Potential
Is FEAR (FEAR) a good investment?: A Comprehensive Analysis of Risk Factors, Market Potential, and Future Prospects for 2024 and Beyond

Is Frok AI (FROKAI) a good investment?: A Comprehensive Analysis of Market Potential, Risk Factors, and Future Prospects
GPUAI vs XRP: Which Cryptocurrency Offers Better Investment Potential in the AI and Blockchain Era?
MA vs ETC: A Comprehensive Comparison of Moving Averages and Exponential Time Constants in Technical Analysis