2025 KYVE Price Prediction: Expert Analysis and Market Forecasts for the Year Ahead


Introduction: KYVE's Market Position and Investment Value
KYVE (KYVE) is a decentralized archival network that reconstitutes data streams as permanent resources, leveraging Arweave to ensure scalability, immutability, and long-term availability of blockchain data. Since its inception, KYVE has established itself as a critical infrastructure solution in the Web3 ecosystem. As of December 2025, KYVE's market capitalization stands at approximately $4.2 million, with a circulating supply of around 1.125 billion tokens, trading at $0.003736 per token. This innovative "data archival protocol" is playing an increasingly vital role in decentralized data preservation and validation across blockchain networks.
This article will provide a comprehensive analysis of KYVE's price movements and market dynamics, incorporating historical performance patterns, market supply-demand dynamics, ecosystem development, and macroeconomic factors to deliver professional price forecasts and actionable investment strategies for the 2025-2030 period.
KYVE Network Market Analysis Report
I. KYVE Price History Review and Current Market Status
KYVE Historical Price Evolution
- January 2024: KYVE reached its all-time high (ATH) of $0.2 on January 27, 2024, representing a peak valuation period for the project.
- 2024-2025: The token experienced a significant downtrend throughout the year, declining approximately 85.36% from its peak over the 1-year period.
- December 2025: KYVE touched its all-time low (ATL) of $0.003099 on December 18, 2025, marking a substantial depreciation from historical highs.
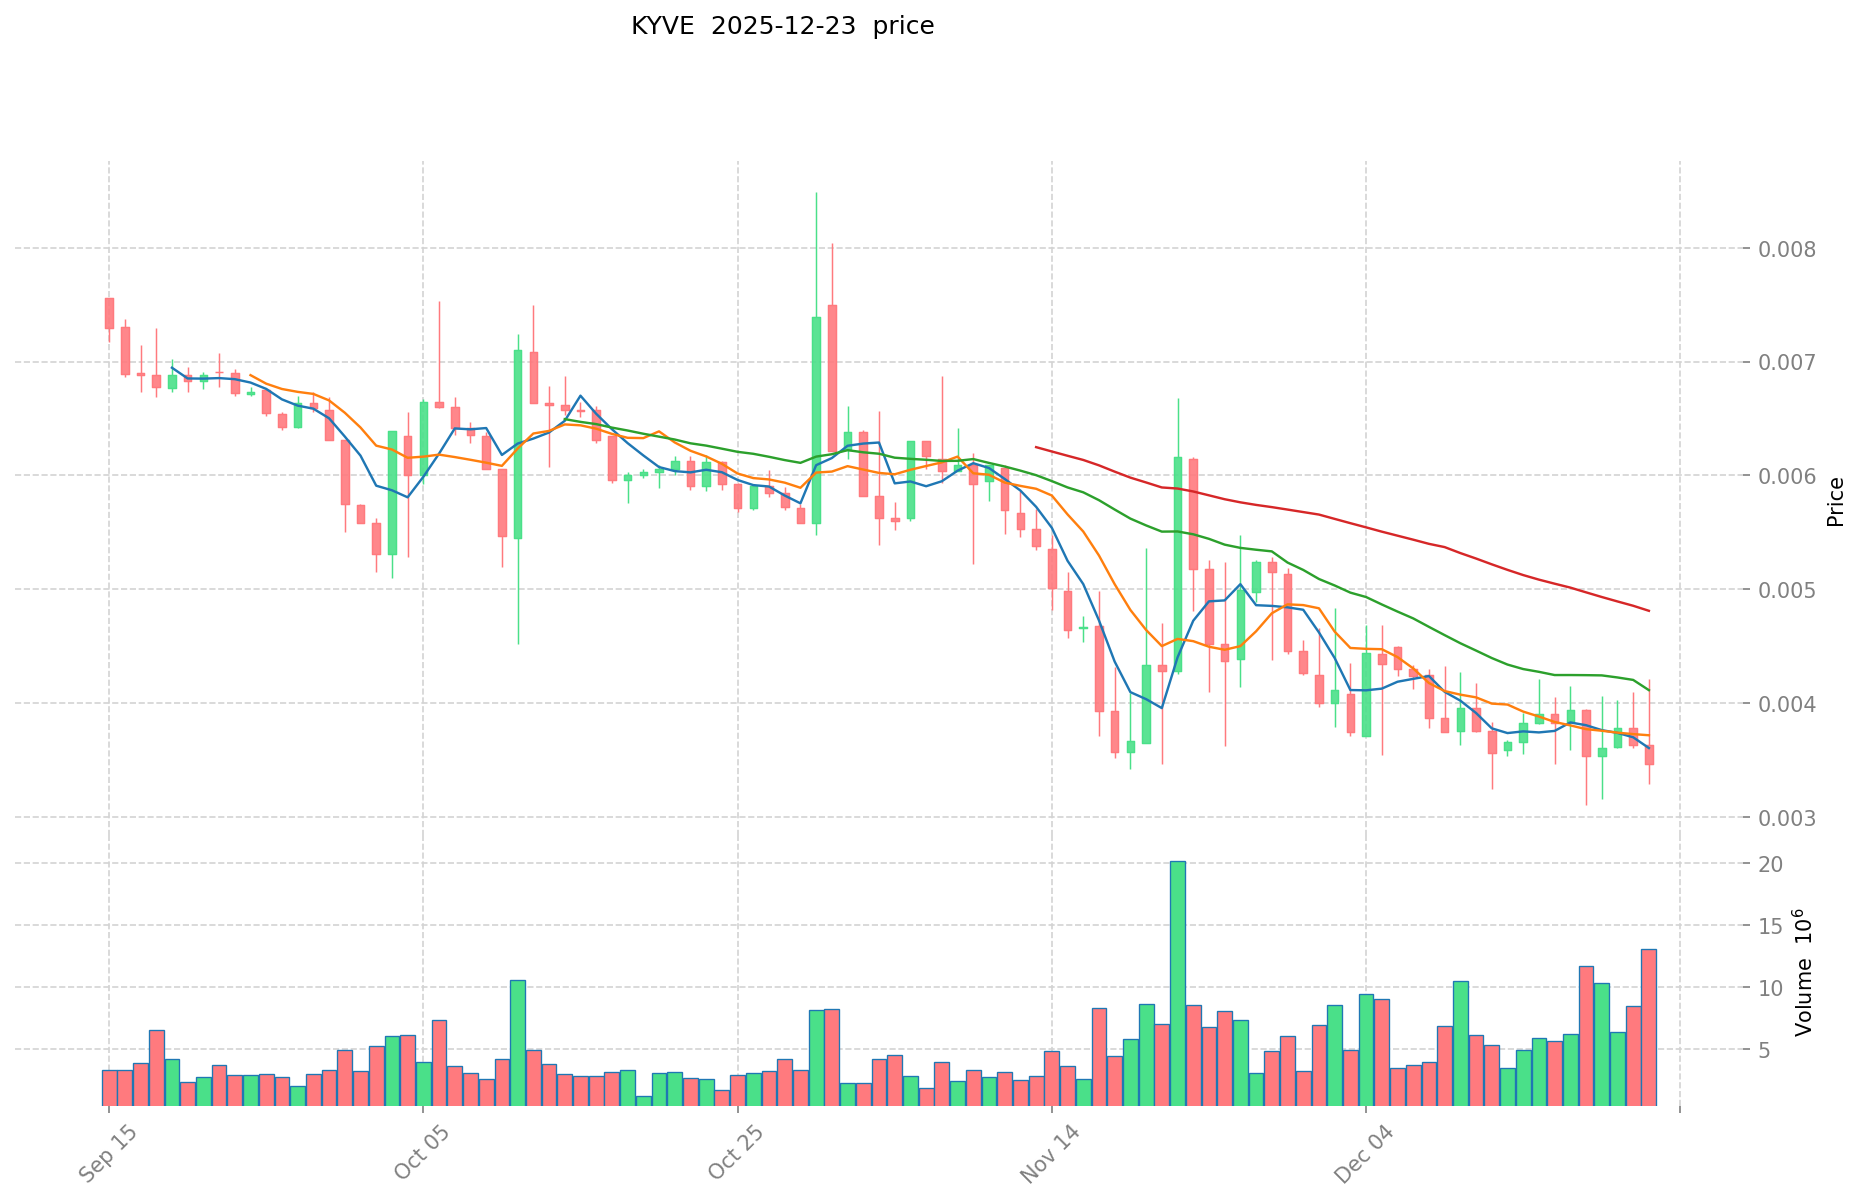
KYVE Current Market Situation
As of December 24, 2025, KYVE is trading at $0.003736, reflecting the following market characteristics:
Price Performance:
- 1-hour change: +0.05% ($0.000001867 gain)
- 24-hour change: -2.19% ($0.000083650 decline)
- 7-day change: -4.83% ($0.000189606 decline)
- 30-day change: -28.68% ($0.001502362 decline)
- 1-year change: -85.36% ($0.021783125 decline)
Market Metrics:
- Market Capitalization: $4,203,930.35
- Fully Diluted Valuation (FDV): $3,736,000.00
- Circulating Supply: 1,125,249,022.10 KYVE tokens
- Total Supply: 1,000,000,000 KYVE tokens
- Max Supply: Unlimited
- 24-hour Trading Volume: $46,809.08
- Market Dominance: 0.00011%
- 24-hour High: $0.004213
- 24-hour Low: $0.003284
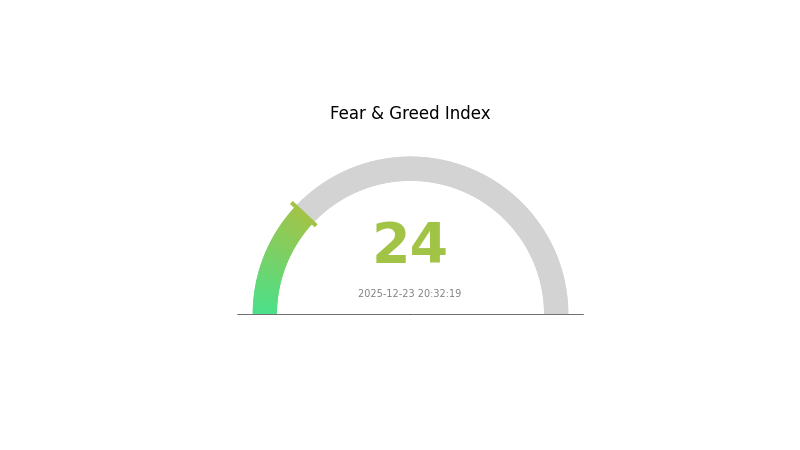
Market Sentiment: The current market sentiment index stands at 1, indicating "Extreme Fear" with a VIX reading of 24, reflecting heightened market anxiety and risk aversion among investors.
Click to view current KYVE market price
KYVE Market Sentiment Index
2025-12-23 Fear and Greed Index: 24 (Extreme Fear)
Click to view the current Fear & Greed Index
The cryptocurrency market is currently experiencing extreme fear, with the Fear and Greed Index plummeting to 24. This indicates significant market pessimism and heightened investor anxiety. During periods of extreme fear, market volatility tends to increase substantially, creating both risks and opportunities. Risk-averse investors may consider reducing exposure, while contrarian traders often view such conditions as potential accumulation points. It is essential to maintain a diversified portfolio and adhere to your investment strategy regardless of short-term market sentiment fluctuations. Always conduct thorough research before making any trading decisions on Gate.com.
KYVE Holding Distribution
The address holding distribution chart provides a comprehensive snapshot of how KYVE tokens are allocated across the blockchain ecosystem. This metric serves as a critical indicator for assessing token concentration levels, evaluating decentralization characteristics, and understanding the potential for market manipulation. By examining the distribution patterns among top holders, analysts can gauge the overall health of the network's governance structure and identify whether wealth concentration poses risks to protocol stability.
Based on the available holding distribution data, a complete analysis requires detailed address metrics and percentage allocations. However, the framework for such assessment would typically examine whether the top addresses collectively control an excessive proportion of the total supply. A healthy token distribution generally sees top holders representing a diversified ecosystem including protocol developers, institutional stakeholders, early supporters, and decentralized community members. Excessive concentration among a small number of addresses raises concerns about voting power consolidation and potential price volatility stemming from large-scale liquidations or coordinated movements.
The distribution structure directly influences market microstructure dynamics and long-term protocol sustainability. A well-distributed token base fosters organic price discovery, reduces vulnerability to manipulation, and strengthens community-driven governance legitimacy. Conversely, highly concentrated holdings may constrain market liquidity depth and create asymmetric information advantages for dominant stakeholders. Understanding these distribution patterns enables market participants to better contextualize KYVE's on-chain fundamentals within the broader digital asset landscape.
Click to view current KYVE Holding Distribution

| Top | Address | Holding Qty | Holding (%) |
|---|
II. Core Factors Affecting KYVE's Future Price
Technology Development and Ecosystem Construction
-
Protocol Upgrade: KYVE continuously optimizes its data validation and storage protocol, enhancing network efficiency and reliability. These improvements support the core infrastructure needs of the Web3 ecosystem.
-
Ecosystem Application Expansion: As a Web3 foundational infrastructure, KYVE's price is influenced by DApp development and application deployment within its ecosystem. The proliferation of Web3 data solutions is expected to significantly impact KYVE's future price trajectory.
III. 2025-2030 KYVE Price Forecast
2025 Outlook
- Conservative Forecast: $0.00194 - $0.00374
- Neutral Forecast: $0.00374
- Bullish Forecast: $0.00441 (requires sustained demand for decentralized data validation services)
2026-2028 Mid-term Perspective
- Market Stage Expectation: Gradual accumulation phase with increasing adoption of KYVE's data validation infrastructure across blockchain ecosystems.
- Price Range Forecast:
- 2026: $0.00240 - $0.00578
- 2027: $0.00365 - $0.00577
- 2028: $0.00289 - $0.00743
- Key Catalysts: Expansion of protocol partnerships, integration with major blockchain networks, growing demand for reliable on-chain data feeds, and ecosystem development milestones.
2029-2030 Long-term Outlook
- Base Case Scenario: $0.00434 - $0.00639 in 2029, advancing to $0.00577 - $0.00712 in 2030 (assumes steady ecosystem growth and moderate market conditions)
- Bullish Scenario: $0.00639 - $0.00786 in 2029, reaching $0.00712 - $0.00776 in 2030 (assumes accelerated adoption and strengthened market position)
- Transformative Scenario: $0.00786+ in 2029, potentially exceeding $0.00776 by 2030 (assumes breakthrough partnerships, regulatory clarity, and emergence as critical infrastructure)
- December 24, 2030: KYVE demonstrates 90% cumulative appreciation from 2025 baseline (reflecting potential for sustained value capture through data validation prominence)
| 年份 | 预测最高价 | 预测平均价格 | 预测最低价 | 涨跌幅 |
|---|---|---|---|---|
| 2025 | 0.00441 | 0.00374 | 0.00194 | 0 |
| 2026 | 0.00578 | 0.00407 | 0.0024 | 9 |
| 2027 | 0.00577 | 0.00493 | 0.00365 | 31 |
| 2028 | 0.00743 | 0.00535 | 0.00289 | 43 |
| 2029 | 0.00786 | 0.00639 | 0.00434 | 71 |
| 2030 | 0.00776 | 0.00712 | 0.00577 | 90 |
KYVE Network (KYVE) Professional Investment Strategy and Risk Management Report
I. Executive Summary
KYVE is a decentralized archival network that reconstitutes data streams as permanent resources. As of December 24, 2025, KYVE is trading at $0.003736, representing a significant decline of 85.36% over the past year from its all-time high of $0.2 (January 27, 2024). With a market capitalization of $4,203,930 and a circulating supply of 1,125,249,022 tokens, KYVE presents both substantial opportunities and considerable risks for investors.
II. Market Performance Analysis
Current Market Metrics
| Metric | Value |
|---|---|
| Current Price | $0.003736 |
| 24H Price Change | -2.19% |
| 7D Price Change | -4.83% |
| 30D Price Change | -28.68% |
| 1Y Price Change | -85.36% |
| Market Cap | $4,203,930 |
| 24H Volume | $46,809.08 |
| Circulating Supply | 1,125,249,022 KYVE |
| Total Supply | 1,000,000,000 KYVE |
| Market Dominance | 0.00011% |
Price Trend Analysis
The token has experienced significant volatility, with a 24-hour range between $0.003284 (low) and $0.004213 (high). The year-over-year decline of 85.36% indicates sustained downward pressure, though short-term positive movement (0.05% in the past hour) suggests potential consolidation patterns.
III. KYVE Protocol and Tokenomics Assessment
Network Architecture
KYVE's fully decentralized architecture comprises two primary components:
-
Autonomous Governance System: Utilizes staking and slashing mechanisms to ensure participant alignment with network objectives and enforce "breach of contract" penalties.
-
Computational Layer: Enables participants to operate customizable nodes that perform validation, standardization, and archival of data streams in exchange for $KYVE token rewards.
Token Utility and Distribution
The $KYVE token serves as the governance mechanism for the protocol, distributed to successful network participants as rewards for meeting network objectives. The token enables decentralized governance within the KYVE protocol ecosystem.
IV. KYVE Professional Investment Strategy and Risk Management
KYVE Investment Methodology
(1) Long-Term Hold Strategy
-
Target Investors: Institutional investors, blockchain infrastructure believers, and long-term DeFi participants with high risk tolerance
-
Operational Recommendations:
- Accumulate during periods of market weakness and sustained negative sentiment
- Position size should reflect the highly speculative nature of infrastructure tokens in development phases
- Establish a multi-year holding horizon aligned with KYVE network maturation cycles
-
Storage Solution:
- Gate Web3 Wallet for secure self-custody of KYVE tokens with institutional-grade security features
- Maintain private key backup protocols and enable hardware wallet integration for large holdings
(2) Active Trading Strategy
-
Technical Analysis Considerations:
- Support/Resistance Levels: Monitor the 30-day moving average and historical support at $0.003099 (recent all-time low)
- Volume Analysis: Current 24H volume of $46,809 indicates relatively thin liquidity; traders should exercise caution regarding slippage on large positions
-
Swing Trading Considerations:
- Position-taking during oversold conditions (when 7D momentum turns positive)
- Risk-reward ratio management with stops set below recent support levels
- Account for the token's low trading volume requiring patient entry and exit execution
KYVE Risk Management Framework
(1) Asset Allocation Principles
- Conservative Investors: 0-1% portfolio allocation to KYVE tokens
- Aggressive Investors: 2-5% portfolio allocation (within infrastructure token allocation category)
- Institutional Investors: 0.5-2% allocation within blockchain infrastructure research position
(2) Risk Mitigation Strategies
- Diversification: Hold KYVE alongside other decentralized infrastructure protocols to reduce single-protocol concentration risk
- Position Sizing: Limit individual KYVE positions to percentages aligned with investor risk tolerance, given the extreme volatility demonstrated (85.36% YTD decline)
(3) Secure Storage Solutions
- Custody Recommendation: Gate Web3 Wallet provides professional-grade custody with multi-signature support and institutional security protocols
- Self-Custody Best Practices: Enable two-factor authentication and maintain encrypted backup of private keys in geographically separated locations
- Critical Security Warnings:
- Never share private keys or seed phrases with any entity
- Verify all wallet software through official KYVE Network channels only
- Be cautious of phishing attempts targeting KYVE holders through social engineering
V. KYVE Potential Risks and Challenges
Market Risks
- Extreme Volatility: The 85.36% annual decline demonstrates significant downside risk; token holders face potential further depreciation if network adoption fails to materialize
- Liquidity Risk: Daily trading volume of approximately $46,809 is minimal relative to market cap, creating substantial slippage for medium to large trades and limiting exit opportunities during market stress
- Market Sentiment: Prolonged negative price action (-28.68% over 30 days) indicates weakness in investor conviction regarding the project's viability
Regulatory Risks
- Classification Uncertainty: Regulatory treatment of archival infrastructure tokens remains ambiguous across jurisdictions; potential SEC or equivalent authority reclassification could impact token value
- Jurisdiction Exposure: Changes in blockchain regulation across major markets (EU, US, Asia-Pacific) could restrict KYVE token trading or staking activities
- Compliance Requirements: Potential future KYC/AML requirements for KYVE network participation could reduce validator participation and network security
Technical Risks
- Network Adoption: KYVE's viability depends on sustained adoption for data archival services; lower-than-expected validator participation could undermine security guarantees
- Arweave Dependency: The protocol's reliance on Arweave for permanent storage creates external technical and economic dependencies; Arweave network failures could impact KYVE's core functionality
- Protocol Vulnerabilities: As a decentralized protocol, KYVE faces ongoing risks related to smart contract vulnerabilities, consensus mechanism attacks, or unforeseen technical issues
VI. Conclusion and Action Recommendations
KYVE Investment Value Assessment
KYVE represents a high-risk, speculative investment in decentralized data archival infrastructure. While the protocol addresses a genuine need for permanent blockchain data storage, the substantial 85.36% year-over-year decline, minimal trading liquidity, and unproven market demand for the service create significant headwinds. The token's technical functionality and protocol design are sound, but practical network adoption metrics and economic sustainability require validation. Investors should approach KYVE exclusively as a venture-stage infrastructure bet unsuitable for portfolio core positions.
KYVE Investment Recommendations
✅ Beginners: Do not initiate positions until you have completed comprehensive technical and economic research. KYVE is inappropriate for portfolio beginners; consider establishing infrastructure token exposure through more established protocols first.
✅ Experienced Investors: May consider small speculative positions (2-5% of venture allocation) if conviction regarding data archival infrastructure demand is high. Employ strict position sizing and stop-loss discipline given volatility.
✅ Institutional Investors: May conduct research stage monitoring and small pilot positions as part of blockchain infrastructure research programs, with full awareness that protocol remains in early development stages.
KYVE Trading Participation Methods
- Spot Trading: Execute through Gate.com, which provides KYVE trading pairs with institutional-grade order execution and security infrastructure
- Dollar-Cost Averaging: For long-term conviction positions, implement monthly accumulation programs to reduce timing risk and average entry prices
- Staking/Validation: Qualified participants may operate validator nodes to earn KYVE token rewards directly; requires technical infrastructure and capital lockup
CRITICAL DISCLAIMER: Cryptocurrency investment carries extreme risk. This report does not constitute investment advice. Investors must make decisions independently based on personal risk tolerance and thorough due diligence. Consult qualified financial advisors before making investment decisions. Never invest funds you cannot afford to lose completely. Past performance does not guarantee future results. KYVE token value could decline to zero.
FAQ
What is Kyve crypto?
Kyve is a Cosmos-based layer 1 blockchain providing decentralized data validation, immutability, and retrieval services. It enables secure, tamper-proof data management for web3 applications.
What is the price prediction for KYVE in 2025?
KYVE is expected to reach approximately $0.006 by end of 2025. With current market cap at $4.60M and recent price momentum, strong growth potential anticipated.
What factors influence KYVE token price?
KYVE token price is driven by supply and demand dynamics, investor sentiment, market trends, trading volume, network adoption, and broader cryptocurrency market conditions.
Is KYVE a good investment for long-term holders?
Yes, KYVE presents strong long-term investment potential due to its strategic position in the decentralized data storage sector. Its robust infrastructure and growing market adoption support sustained value appreciation for patient investors.
Share
Content
Introduction: KYVE's Market Position and Investment Value
I. KYVE Price History Review and Current Market Status
II. Core Factors Affecting KYVE's Future Price
III. 2025-2030 KYVE Price Forecast
I. Executive Summary
II. Market Performance Analysis
III. KYVE Protocol and Tokenomics Assessment
IV. KYVE Professional Investment Strategy and Risk Management
V. KYVE Potential Risks and Challenges
VI. Conclusion and Action Recommendations
FAQ
How to Buy Cryptocurrency


Trending Cryptocurrencies


How Active is the Community and Ecosystem of Akash Network (AKT) in 2025?

What is MVL: Understanding the Multi-Value Logic System in Modern Computing

How Active is Pi Network's Community in 2025?

What is GEOD: Understanding the Global Environmental Observation Database and Its Impact on Climate Research
How Does FIL Compare to Its Competitors in Performance, Market Cap, and User Base?

How Does HNT Compare to Its Competitors in Performance, Market Cap, and User Base?
How Does Chainlink (LINK) Price Volatility Compare to Bitcoin and Ethereum in 2026?
How Does GTETH Price Volatility Compare to ETH: Support and Resistance Analysis in 2026?

What Does ADA Technical Analysis Reveal: MACD Death Cross and RSI Signals Explained

How Do MACD and RSI Indicators Signal ZORA Price Recovery in 2025?

What are the key derivatives market signals for crypto trading in 2026: futures open interest, funding rates, and liquidation data explained