2025 KDA Price Prediction: Expert Analysis and Market Outlook for Kadena's Token Performance
Introduction: KDA's Market Position and Investment Value
Kadena (KDA) is a leader in distributed digital ledger technology, positioning itself as an industry-leading secure and scalable platform with a simple smart contract language designed to help institutions improve efficiency through blockchain solutions. Since its launch in 2020, Kadena has established itself as a comprehensive blockchain platform offering both public chain and alliance chain solutions that can be integrated together to create innovative market use cases.
As of December 24, 2025, Kadena's market capitalization stands at $3,819,251, with a circulating supply of approximately 338,586,083.5 KDA tokens priced at $0.01128. Despite experiencing significant market volatility—having reached an all-time high of $27.64 in November 2021—KDA continues to maintain relevance in the blockchain ecosystem as a platform designed to enhance institutional efficiency and interoperability.
This article will conduct a comprehensive analysis of KDA's price trajectory and market dynamics, examining historical performance patterns, supply and demand dynamics, ecosystem development, and macroeconomic factors to provide investors with professional price forecasts and actionable investment strategies for the period through 2030.
Kadena (KDA) Market Analysis Report
I. KDA Price History Review and Current Market Status
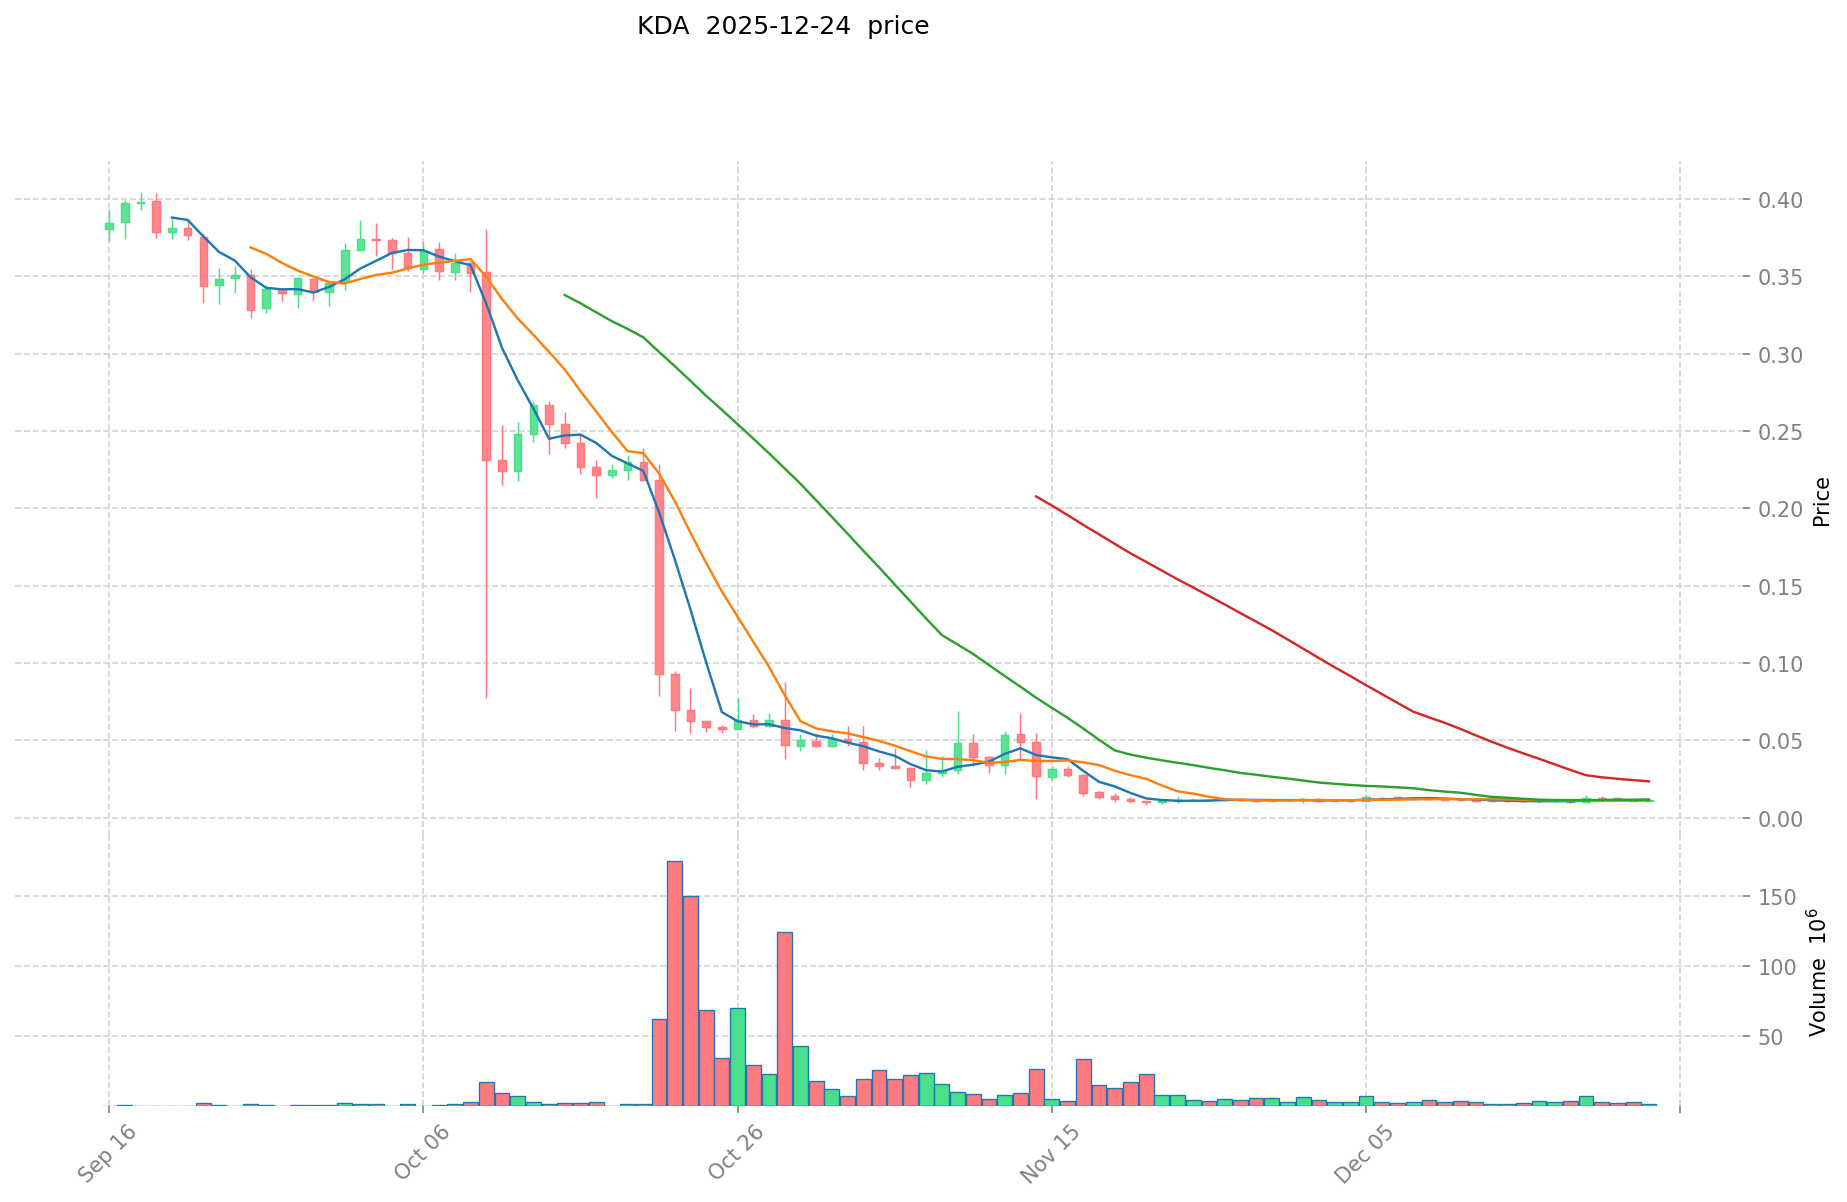
KDA Historical Price Movement Trajectory
- November 2021: KDA reached its all-time high of $27.64, marking the peak of the bull market cycle during this period.
- 2021-2024: Following the market peak, KDA experienced a significant correction phase, declining substantially from its historical highs as the broader cryptocurrency market entered a consolidation phase.
- November 2025: KDA reached its all-time low of $0.00842517, representing a cumulative decline of approximately 98.91% from its peak value.
KDA Current Market Status
As of December 24, 2025, KDA is trading at $0.01128, with a 24-hour trading volume of $18,233.65. The token shows positive short-term momentum with a 24-hour price increase of 2.82%, though it remains down 0.26% in the past hour. Over the 7-day period, KDA has gained 6.25%, suggesting potential recovery momentum.
The total market capitalization stands at approximately $3.82 million, with a circulating supply of 338,586,083.5196 KDA tokens out of a maximum supply of 1 billion tokens. The circulating supply represents 33.86% of the total maximum supply, indicating significant room for additional token distribution.
Market sentiment indicates extreme fear conditions, with current market conditions characterized by elevated volatility. KDA maintains a market dominance of 0.00012%, reflecting its relatively small position within the broader cryptocurrency ecosystem. The fully diluted valuation to market cap ratio shows that the circulating supply represents 33.86% of the fully diluted valuation.
Visit KDA Market Price on Gate.com to view current pricing and trading information.
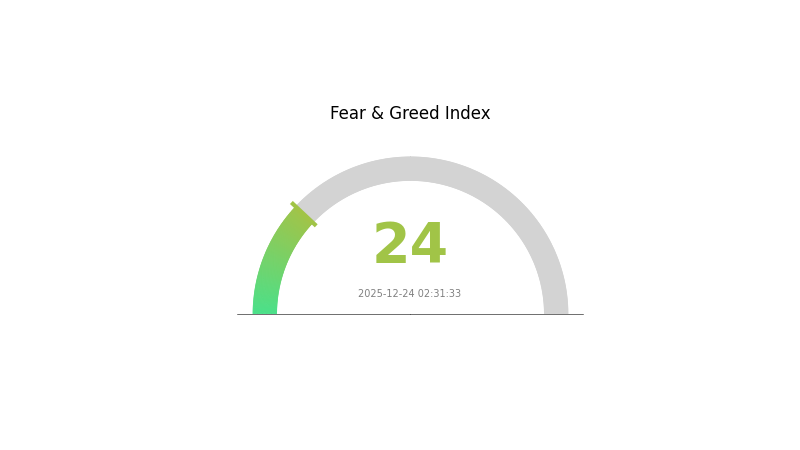
KDA Market Sentiment Index
2025-12-24 Fear and Greed Index: 24 (Extreme Fear)
Click to view current Fear & Greed Index
The market is experiencing extreme fear, with the index dropping to 24. This indicates widespread investor anxiety and heightened market volatility. During such periods, experienced traders often view it as a potential buying opportunity, as extreme fear can signal market bottoms. However, caution is advised, as prices may continue declining before stabilizing. Monitor key support levels and diversify your portfolio accordingly. Consider using limit orders on Gate.com to manage entries during high-volatility conditions.
KDA Holding Distribution
The address holding distribution chart serves as a critical metric for assessing the concentration of token ownership across the Kadena network. By displaying the distribution of KDA holdings across various addresses, this indicator provides insights into the degree of decentralization, market structure vulnerability, and the potential for coordinated price movements. Understanding this distribution is essential for evaluating the overall health and resilience of the KDA ecosystem.
Unfortunately, the provided dataset appears to be empty, with no specific address holdings or concentration percentages available for analysis at this time. Without concrete distribution data, a comprehensive assessment of KDA's current concentration characteristics cannot be completed. However, it is important to note that when evaluating address distribution patterns, analysts typically examine whether holdings are excessively concentrated among a small number of addresses, which could indicate centralization risks and heightened vulnerability to market manipulation.
The absence of available data suggests that either the snapshot period contains insufficient information or the distribution metrics are not currently accessible. To conduct a thorough evaluation of KDA's decentralization status and chain structure stability, updated holding distribution data would be necessary. Investors and stakeholders are encouraged to monitor this metric regularly on Gate.com's crypto market data platform to track changes in ownership concentration and assess the evolving market structure of the Kadena network.
View current KDA Holding Distribution

| Top | Address | Holding Qty | Holding (%) |
|---|
II. Core Factors Affecting KDA's Future Price
Supply Mechanism
-
Long-term Emission Schedule: KDA has a fixed total supply of 1 billion tokens with a 120-year mining period. The project commenced issuance in 2019 and will continue releasing tokens until 2139, representing a gradual and extended emission model.
-
Historical Pattern: KDA's price demonstrated high correlation with Bitcoin's market movements. When Bitcoin traded at historical highs, KDA followed suit. However, when Bitcoin entered a downtrend from Q1 2022, declining below $20,000, KDA experienced a value drop exceeding 90% from its 2021 historical peak of $69,000, representing approximately a 70% decline.
-
Pre-allocation Mechanism: Beyond mining rewards, pre-allocated tokens constitute another source of KDA in the Kadena ecosystem. This distribution was defined in the network's genesis block and subsequent blocks are derived from this foundation.
Technology Development and Ecosystem Construction
-
Chainweb Consensus: The core architecture component of Kadena is the "Chainweb" consensus mechanism, which consists of a network of 20 interconnected chains providing power to the Kadena layer. This serves as the foundation of Kadena's first-layer network.
-
Pact Smart Contract Language: Kadena employs Pact as its native smart contract language, featuring built-in error detection functionality. As the first human-readable programming language with Turing incompleteness, it enables both technical and non-technical users to construct blockchain applications in a pre-verified, direct, and secure manner.
-
Proof of Work Design: Kadena utilizes a novel Proof of Work consensus mechanism where multiple independently mined chains operate in parallel to execute network transactions. This design theoretically supports high transaction throughput at the base layer without requiring second-layer scalability or sidechain solutions.
Three、2025-2030 KDA Price Forecast
2025 Outlook
- Conservative forecast: $0.00614 - $0.01116
- Neutral forecast: $0.01116
- Optimistic forecast: $0.01384 (requires sustained network adoption and positive market sentiment)
2026-2028 Medium-term Outlook
- Market phase expectation: Gradual recovery and consolidation phase with incremental growth trajectory
- Price range forecast:
- 2026: $0.01087 - $0.01412 (10% upside potential)
- 2027: $0.00825 - $0.01371 (18% cumulative gain)
- 2028: $0.00878 - $0.01662 (19% additional appreciation)
- Key catalysts: Enhanced ecosystem development, increased institutional interest, mainstream adoption acceleration, and improved market liquidity conditions
2029-2030 Long-term Outlook
- Base case scenario: $0.01091 - $0.01582 (assumes steady technological progress and moderate market growth)
- Optimistic scenario: $0.01657 - $0.02025 (assumes significant protocol upgrades and expanded use cases)
- Transformative scenario: $0.02025+ (assumes breakthrough adoption rates and network effects becoming dominant market driver)
- 2030-12-31: KDA $0.02025 (representing 40% cumulative appreciation from 2025 baseline, reflecting sustained long-term value creation)
Note: All forecasts are based on historical data analysis and market trend projections. Investors should conduct thorough due diligence on Gate.com and other platforms before making investment decisions. Cryptocurrency markets remain highly volatile and subject to regulatory changes.
| 年份 | 预测最高价 | 预测平均价格 | 预测最低价 | 涨跌幅 |
|---|---|---|---|---|
| 2025 | 0.01384 | 0.01116 | 0.00614 | -1 |
| 2026 | 0.01412 | 0.0125 | 0.01087 | 10 |
| 2027 | 0.01371 | 0.01331 | 0.00825 | 18 |
| 2028 | 0.01662 | 0.01351 | 0.00878 | 19 |
| 2029 | 0.01657 | 0.01507 | 0.00994 | 33 |
| 2030 | 0.02025 | 0.01582 | 0.01091 | 40 |
Kadena (KDA) Professional Investment Strategy and Risk Management Report
IV. KDA Professional Investment Strategy and Risk Management
KDA Investment Methodology
(1) Long-term Holding Strategy
-
Target Investors: Institutional investors, blockchain infrastructure believers, and long-term value investors seeking exposure to scalable blockchain solutions
-
Operational Recommendations:
- Accumulate KDA during periods of high volatility, focusing on the support levels established during market downturns
- Maintain a strategic position for 12-24 months to benefit from potential ecosystem growth and enterprise adoption of Kadena's hybrid blockchain solutions
- Reinvest any potential staking rewards or governance distributions back into the position to compound gains
-
Storage Solution:
- Use Gate.com's Web3 wallet for convenient access to trading and ecosystem participation while maintaining security standards
- Consider self-custody options for holdings exceeding your active trading amount, ensuring private key management and backup protocols are properly implemented
(2) Active Trading Strategy
-
Technical Analysis Tools:
- 24-Hour Price Action: Monitor resistance at $0.01168 and support at $0.01069 for intraday trading opportunities
- 7-Day Trend Analysis: Track the positive 6.25% weekly momentum to identify potential breakout patterns and consolidation phases
-
Range Trading Key Points:
- Capitalize on the narrow 24-hour trading range ($0.01069 - $0.01168) by executing buy orders at support levels and sell orders at resistance levels
- Monitor volume patterns during price movements to confirm the strength of directional moves before entering positions
KDA Risk Management Framework
(1) Asset Allocation Principles
- Conservative Investors: 1-3% portfolio allocation to KDA
- Aggressive Investors: 3-8% portfolio allocation to KDA
- Professional Investors: 5-15% portfolio allocation to KDA (with hedging mechanisms)
(2) Risk Hedging Solutions
- Volatility Mitigation: Implement dollar-cost averaging (DCA) strategies over 3-6 month periods to reduce the impact of short-term price fluctuations
- Portfolio Diversification: Maintain KDA exposure as part of a broader blockchain infrastructure portfolio, balancing with other Layer-1 solutions and staking-enabled protocols
(3) Secure Storage Solutions
- Hot Wallet Option: Gate.com Web3 wallet for active trading and frequent transactions, offering both convenience and security standards
- Cold Storage Protocol: Transfer the majority of holdings to secure, offline storage for long-term positions exceeding 12 months
- Critical Security Considerations: Never share private keys or seed phrases; enable multi-signature authorization for large transactions; regularly update security protocols and monitor account activity; use hardware backup solutions for recovery phrases
V. KDA Potential Risks and Challenges
KDA Market Risk
- Extreme Historical Volatility: KDA has experienced a 98.91% decline over the past year and a -99.97% decline from its all-time high of $27.64 (November 2021), indicating substantial downside risk and limited recovery certainty
- Low Market Capitalization and Liquidity: With a market cap of approximately $3.8 million and relatively low trading volume ($18,233 in 24-hour volume), KDA faces liquidity challenges that could result in high slippage during significant buy or sell orders
- Minimal Market Dominance: At 0.00012% market dominance, KDA has negligible influence on broader blockchain adoption trends and remains highly dependent on niche enterprise use cases
KDA Regulatory Risk
- Blockchain Regulatory Uncertainty: Changing regulatory frameworks across jurisdictions may impact the viability of Kadena's hybrid chain architecture and enterprise blockchain solutions
- Enterprise Adoption Barriers: Regulatory compliance requirements for institutional adoption could delay or prevent scaling of Kadena's target market
- Jurisdictional Risks: Different regulatory treatment of public versus private blockchain solutions may affect Kadena's ability to operate both its public and alliance chain solutions
KDA Technical Risk
- Ecosystem Maturity: As a lower-ranked cryptocurrency (1708th by market cap), Kadena's ecosystem remains relatively underdeveloped compared to established blockchain platforms
- Limited Network Effects: With minimal trading activity and market participation, network effects that typically drive blockchain value creation remain weak
- Smart Contract Language Adoption: The success of Kadena's Pact smart contract language depends on developer adoption, which remains substantially lower than competing platforms
VI. Conclusion and Action Recommendations
KDA Investment Value Assessment
Kadena positions itself as a distributed digital ledger leader with unique hybrid blockchain capabilities combining public and alliance chain solutions. However, the project faces significant headwinds reflected in its dramatic 98.91% year-over-year decline and ultra-low market capitalization. While Kadena's technical architecture and enterprise-focused approach offer differentiated value propositions, current market conditions suggest the token remains in a challenging phase with limited short-to-medium-term catalysts. The project's success is contingent on substantial enterprise adoption that has yet to materialize at scale.
KDA Investment Recommendations
✅ Beginners: Start with minimal allocations (0.5-1%) only after thoroughly understanding Kadena's technical architecture and hybrid blockchain model; use Gate.com for convenient trading while researching ecosystem developments
✅ Experienced Investors: Consider strategic accumulation during extreme volatility using dollar-cost averaging; implement strict stop-loss orders at 15-20% below entry points; maintain position sizing between 3-8% of speculative portfolio allocation
✅ Institutional Investors: Evaluate Kadena's enterprise solutions through direct engagement with the project team; conduct due diligence on actual client adoptions and deployment timelines; implement comprehensive hedging strategies given the high risk profile
KDA Trading Participation Methods
- Spot Trading on Gate.com: Execute buy and sell orders using Gate.com's trading platform, which provides access to KDA liquidity and market data
- Technical Analysis Monitoring: Track price movements through the established support ($0.01069) and resistance ($0.01168) levels to time entry and exit points
- Strategic Position Building: Use limit orders to accumulate positions at predetermined price levels rather than market orders, minimizing slippage in the thin liquidity environment
Cryptocurrency investment carries extreme risk. This report does not constitute investment advice. Investors should make decisions based on their individual risk tolerance and financial circumstances. Consult with a professional financial advisor before making significant investment decisions. Never invest more capital than you can afford to lose completely.
FAQ
Can Kadena reach $50?
Yes, Kadena could potentially reach $50 if market conditions improve and adoption increases significantly. With its unique Proof of Work technology and growing ecosystem development, reaching $50 remains within the realm of possibility for long-term investors.
Is Kadena a good investment?
Kadena offers strong potential through its high-speed, scalable blockchain technology. Its focus on security and efficiency positions it well for growth. Current market indicators suggest promising prospects for long-term value appreciation.
Does KDA have a future?
Yes, Kadena blockchain remains operational through its decentralized network of independent miners. KDA's future depends on community and developer support to continue building the ecosystem.
Is Kadena a dead coin?
No, Kadena is not dead. The network remains fully operational and decentralized. While the foundation ceased operations, the blockchain continues functioning independently with active community support and development.
Share
Content
Introduction: KDA's Market Position and Investment Value
I. KDA Price History Review and Current Market Status
II. Core Factors Affecting KDA's Future Price
Three、2025-2030 KDA Price Forecast
IV. KDA Professional Investment Strategy and Risk Management
V. KDA Potential Risks and Challenges
VI. Conclusion and Action Recommendations
FAQ
Trending Cryptocurrencies


What Is the Fundamental Analysis of Kadena (KDA) Project in 2025?
How does Kaspa (KAS) compare to its competitors in the crypto market in 2025?

Kaspa (KAS) Price Trend Analysis: 2024–2030

What Will Drive Kaspa (KAS) Price Volatility in 2025?

How Will Decred's Price Volatility Evolve by 2030?
What Does Kaspa (KAS) On-Chain Data Reveal About Whale Activity and Network Health?

What is ENSO? New Infrastructure for Web3 and Smart Contract Automation
Michael Saylor: The Path to Leadership in the Cryptocurrency Sphere
What is a Bitcoin hardware wallet
Introduction to Phantom Wallet and How to Use It
What is LYP: A Comprehensive Guide to Understanding Lymphocyte Yield Protocol in Modern Medical Testing