2025 GCOIN Price Prediction: Analyzing Potential Growth and Market Trends for the Digital Asset

Introduction: GCOIN's Market Position and Investment Value
Galaxy Fight Club (GCOIN) as a cross-IP PvP play-to-earn game project, has emerged as a unique player in the blockchain gaming sector since its inception. As of 2025, GCOIN's market capitalization stands at $65,609.38, with a circulating supply of approximately 79,594,052 tokens, and a price hovering around $0.0008243. This asset, often referred to as the "NFT Battle Arena," is playing an increasingly crucial role in the intersection of gaming and blockchain technology.
This article will provide a comprehensive analysis of GCOIN's price trends from 2025 to 2030, combining historical patterns, market supply and demand, ecosystem development, and macroeconomic factors to offer professional price predictions and practical investment strategies for investors.
I. GCOIN Price History Review and Current Market Status
GCOIN Historical Price Evolution
- 2022: All-time high of $2.16 reached on January 13, marking the peak of early investor enthusiasm
- 2023-2024: Gradual decline in price as the initial hype subsided and market conditions changed
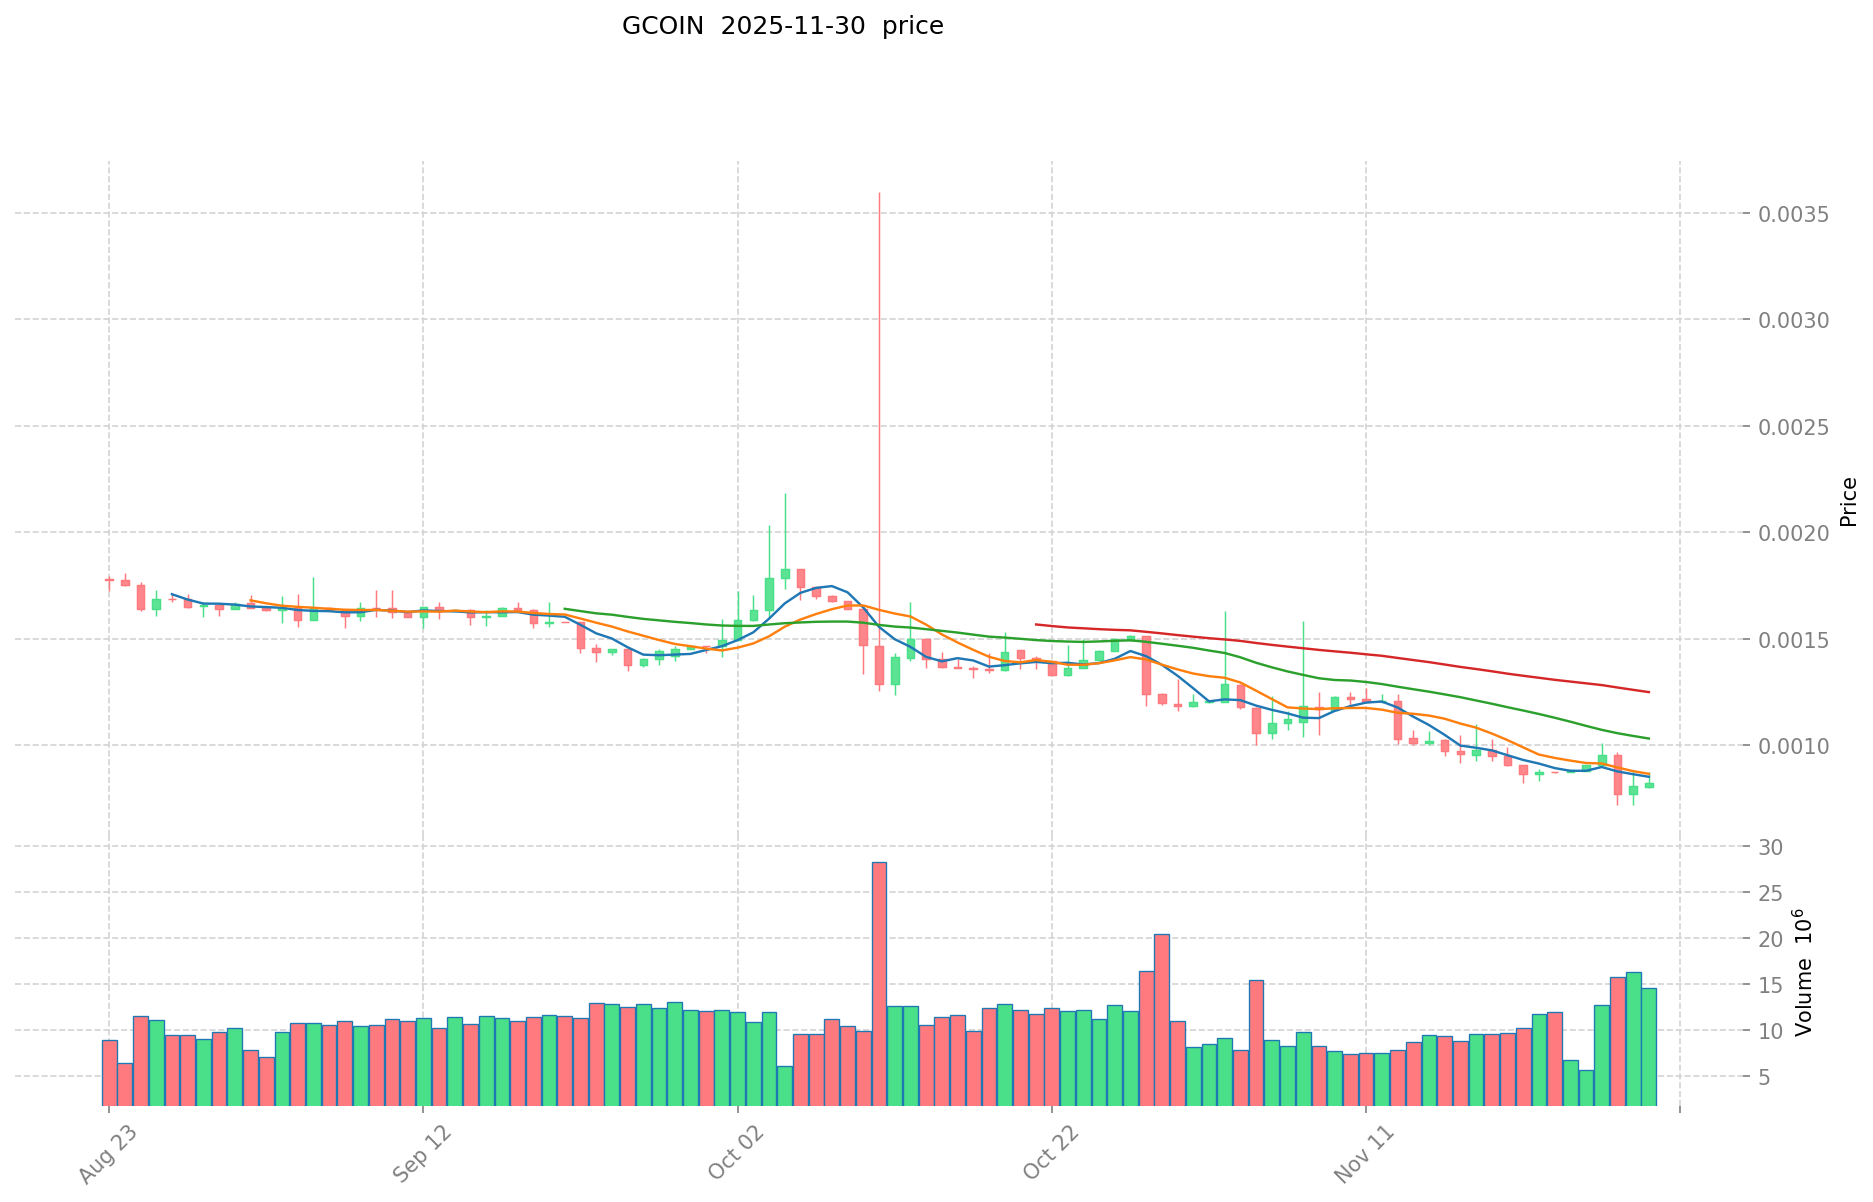
- 2025: Significant price drop, reaching an all-time low of $0.00072111 on November 28
GCOIN Current Market Situation
As of November 30, 2025, GCOIN is trading at $0.0008243, showing a slight recovery from its recent all-time low. The 24-hour trading volume stands at $12,009.54, indicating moderate market activity. GCOIN has experienced a 2.13% increase in the last 24 hours, suggesting a minor positive momentum in the short term.
However, the longer-term trend remains bearish, with a 5.56% decrease over the past week and a substantial 30.4% decline in the last 30 days. The year-to-date performance is particularly concerning, showing a 79.21% drop in value.
The current market capitalization of GCOIN is $65,609.38, ranking it at 5370th position in the overall cryptocurrency market. With a circulating supply of 79,594,052 GCOIN and a total supply of 149,735,250, the token has a circulating ratio of 53.06%.
Click to view the current GCOIN market price
GCOIN Market Sentiment Indicator
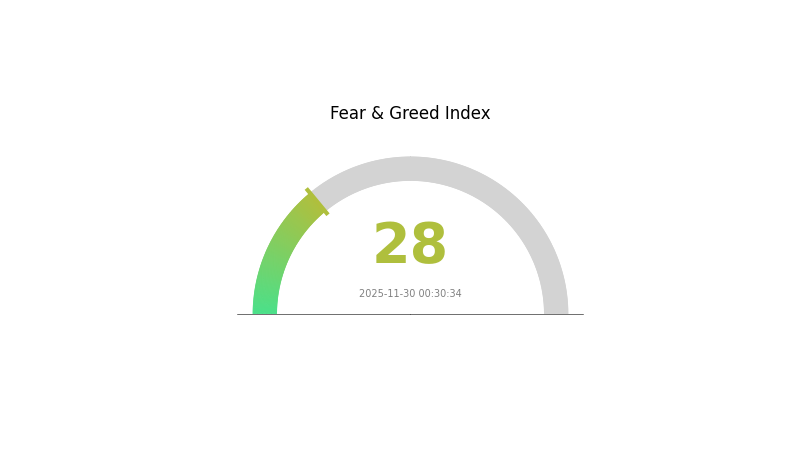
2025-11-30 Fear and Greed Index: 28 (Fear)
Click to view the current Fear & Greed Index
The crypto market sentiment remains cautious as the Fear and Greed Index hovers at 28, indicating a prevailing sense of fear among investors. This risk-averse atmosphere suggests potential buying opportunities for long-term believers. However, traders should exercise caution and conduct thorough research before making investment decisions. As market conditions can shift rapidly, staying informed and maintaining a balanced portfolio is crucial. Remember, extreme fear often precedes market rebounds, but timing remains unpredictable.
GCOIN Holdings Distribution
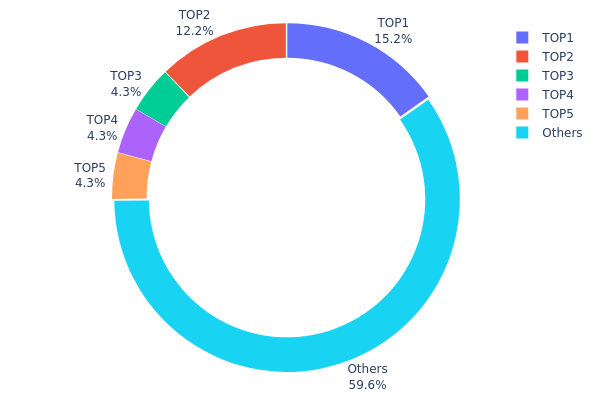
The address holdings distribution data provides crucial insights into the concentration of GCOIN ownership. Analysis of this data reveals a moderate level of centralization, with the top five addresses collectively holding 40.37% of the total supply. The largest holder possesses 15.23% of GCOIN, followed by the second-largest with 12.24%. Notably, the third, fourth, and fifth largest holders each control 4.30% of the supply.
This distribution pattern suggests a balanced market structure, albeit with some concentration at the top. While the presence of large holders could potentially influence market dynamics, the fact that 59.63% of GCOIN is distributed among other addresses indicates a reasonable level of decentralization. This structure may contribute to market stability, as no single entity has overwhelming control. However, investors should be aware that significant movements from the top holders could still impact price volatility.
Overall, the current GCOIN holdings distribution reflects a moderately decentralized ecosystem with a stable on-chain structure. This balance between major stakeholders and a wider distribution base can be seen as a positive indicator for the project's long-term sustainability and resistance to market manipulation.
Click to view the current GCOIN Holdings Distribution
| Top | Address | Holding Qty | Holding (%) |
|---|---|---|---|
| 1 | 0xd8e7...cecef6 | 17703.40K | 15.23% |
| 2 | 0x0d07...b492fe | 14222.65K | 12.24% |
| 3 | 0x4d9f...ea3bf3 | 5000.00K | 4.30% |
| 4 | 0x7a97...579448 | 5000.00K | 4.30% |
| 5 | 0x28af...3cf17d | 5000.00K | 4.30% |
| - | Others | 69247.94K | 59.63% |
II. Key Factors Affecting GCOIN's Future Price
Supply Mechanism
- Minting and Burning: GCOIN's supply is managed through minting and burning mechanisms, which can influence its price based on market demand.
- Current Impact: The current supply changes are expected to have a stabilizing effect on GCOIN's price, as they are designed to maintain balance in the ecosystem.
Institutional and Whale Dynamics
- Institutional Holdings: Major institutions are showing increased interest in GCOIN, potentially leading to greater price stability and growth.
Macroeconomic Environment
- Inflation Hedging Properties: GCOIN has demonstrated some resilience as a potential hedge against inflation, which could positively impact its price in inflationary environments.
Technical Development and Ecosystem Building
- Ecosystem Applications: The GCOIN ecosystem is expanding with various DApps and projects being developed, which could drive increased adoption and value.
III. GCOIN Price Prediction for 2025-2030
2025 Outlook
- Conservative prediction: $0.0007 - $0.00082
- Neutral prediction: $0.00082 - $0.00098
- Optimistic prediction: $0.00098 - $0.00114 (requires positive market sentiment and increased adoption)
2027-2028 Outlook
- Market phase expectation: Potential growth phase with increasing volatility
- Price range forecast:
- 2027: $0.00069 - $0.00116
- 2028: $0.00059 - $0.00121
- Key catalysts: Technological advancements, wider acceptance of GCOIN, and overall crypto market trends
2029-2030 Long-term Outlook
- Base scenario: $0.00088 - $0.00127 (assuming steady market growth and adoption)
- Optimistic scenario: $0.00127 - $0.0014 (assuming accelerated adoption and favorable market conditions)
- Transformative scenario: $0.0014+ (assuming breakthrough use cases and mainstream integration)
- 2030-12-31: GCOIN $0.00127 (potential stabilization after significant growth)
| 年份 | 预测最高价 | 预测平均价格 | 预测最低价 | 涨跌幅 |
|---|---|---|---|---|
| 2025 | 0.00114 | 0.00082 | 0.0007 | 0 |
| 2026 | 0.00109 | 0.00098 | 0.00087 | 19 |
| 2027 | 0.00116 | 0.00104 | 0.00069 | 25 |
| 2028 | 0.00121 | 0.0011 | 0.00059 | 33 |
| 2029 | 0.0014 | 0.00115 | 0.00088 | 39 |
| 2030 | 0.0014 | 0.00127 | 0.00066 | 54 |
IV. GCOIN Professional Investment Strategies and Risk Management
GCOIN Investment Methodology
(1) Long-term Holding Strategy
- Suitable for: Risk-tolerant investors with a long-term perspective
- Operation suggestions:
- Accumulate GCOIN during market dips
- Set price targets and regularly review portfolio
- Store GCOIN in secure non-custodial wallets
(2) Active Trading Strategy
- Technical analysis tools:
- Moving Averages: Monitor short-term and long-term trends
- RSI: Identify overbought and oversold conditions
- Key points for swing trading:
- Set strict stop-loss orders
- Monitor game-related news and updates
GCOIN Risk Management Framework
(1) Asset Allocation Principles
- Conservative investors: 1-3%
- Aggressive investors: 5-10%
- Professional investors: 10-15%
(2) Risk Hedging Solutions
- Diversification: Spread investments across multiple gaming tokens
- Stop-loss orders: Implement to limit potential losses
(3) Secure Storage Solutions
- Hot wallet recommendation: Gate Web3 wallet
- Cold storage solution: Hardware wallets for long-term holdings
- Security precautions: Use two-factor authentication, avoid public Wi-Fi for transactions
V. Potential Risks and Challenges for GCOIN
GCOIN Market Risks
- High volatility: Significant price fluctuations due to low market cap
- Limited liquidity: Potential difficulties in executing large trades
- Competition: Emergence of new gaming tokens and platforms
GCOIN Regulatory Risks
- Uncertain regulatory environment: Potential impact of future gaming token regulations
- Cross-border compliance: Varying legal status in different jurisdictions
- Tax implications: Evolving tax treatment of gaming tokens
GCOIN Technical Risks
- Smart contract vulnerabilities: Potential security flaws in the token contract
- Scalability issues: Possible network congestion on the Polygon network
- Interoperability challenges: Limitations in cross-chain functionality
VI. Conclusion and Action Recommendations
GCOIN Investment Value Assessment
GCOIN presents a high-risk, high-reward opportunity in the gaming token sector. While it offers potential for significant growth, investors should be cautious due to its low market cap and high volatility.
GCOIN Investment Recommendations
✅ Beginners: Allocate a small portion (1-2%) of crypto portfolio, focus on learning
✅ Experienced investors: Consider swing trading with strict risk management
✅ Institutional investors: Monitor for potential inclusion in gaming-focused crypto funds
GCOIN Trading Participation Methods
- Spot trading: Available on Gate.com
- DeFi liquidity provision: Explore yield farming opportunities on Polygon DEXs
- NFT integration: Participate in Galaxy Fight Club's NFT ecosystem
Cryptocurrency investments carry extremely high risks, and this article does not constitute investment advice. Investors should make decisions carefully based on their own risk tolerance and are advised to consult professional financial advisors. Never invest more than you can afford to lose.
FAQ
Will the gravity coin go up?
Yes, gravity coin is likely to go up. Market trends and increasing adoption suggest potential growth in its value by 2025.
Can CorgiAI hit 1 dollar?
Yes, CorgiAI has the potential to reach $1 in the future, given its innovative technology and growing market demand for AI-powered cryptocurrencies.
Can gala coins reach $1?
Yes, GALA coins could potentially reach $1 in the future, depending on market conditions and project developments. However, predicting exact prices is challenging in the volatile crypto market.
What is the future of GTC coin?
GTC coin shows promising potential for growth. With increasing adoption and technological advancements, it's likely to gain value and utility in the Web3 ecosystem by 2025.
Share
Content
Introduction: GCOIN's Market Position and Investment Value
I. GCOIN Price History Review and Current Market Status
II. Key Factors Affecting GCOIN's Future Price
III. GCOIN Price Prediction for 2025-2030
IV. GCOIN Professional Investment Strategies and Risk Management
V. Potential Risks and Challenges for GCOIN
VI. Conclusion and Action Recommendations
FAQ
How to Buy Cryptocurrency


Trending Cryptocurrencies


2025 ENJ Price Prediction: Analyzing Market Trends and Potential Growth Factors for Enjin Coin

2025 CWS Price Prediction: Analyzing Market Trends and Potential Growth Factors for Crowns

KARRAT vs ENJ: A Comprehensive Comparison of Two Leading Gaming Token Projects

2025 OSHI Price Prediction: Expert Analysis and Market Forecast for the Upcoming Year
2025 AGLD Price Prediction: Expert Analysis and Market Forecast for the Upcoming Year

2025 CTA Price Prediction: Expert Analysis and Market Outlook for the Coming Year

Dropee Daily Combo for 3 january 2026
How Does Chainlink (LINK) Price Volatility Compare to Bitcoin and Ethereum in 2026?
How Does GTETH Price Volatility Compare to ETH: Support and Resistance Analysis in 2026?

What Does ADA Technical Analysis Reveal: MACD Death Cross and RSI Signals Explained

How Do MACD and RSI Indicators Signal ZORA Price Recovery in 2025?