2025 CAPS Price Prediction: Analyzing Market Trends and Potential Growth Factors
Introduction: CAPS Market Position and Investment Value
Ternoa (CAPS), as a blockchain specialized in data transmission through NFTs, has achieved significant milestones since its inception in 2021. As of 2025, Ternoa's market capitalization has reached $1,316,670, with a circulating supply of approximately 1,829,471,951 CAPS tokens, and a price hovering around $0.0007197. This asset, known as the "blockchain democratizer," is playing an increasingly crucial role in the field of decentralized data transmission and NFT technology.
This article will comprehensively analyze the price trends of CAPS from 2025 to 2030, combining historical patterns, market supply and demand, ecosystem development, and macroeconomic factors to provide investors with professional price predictions and practical investment strategies.
I. CAPS Price History Review and Current Market Status
CAPS Historical Price Evolution
- 2021: CAPS reached its all-time high of $0.227823 on June 8, marking a significant milestone in its price history.
- 2022-2024: The cryptocurrency market experienced a prolonged bearish trend, causing CAPS price to decline significantly.
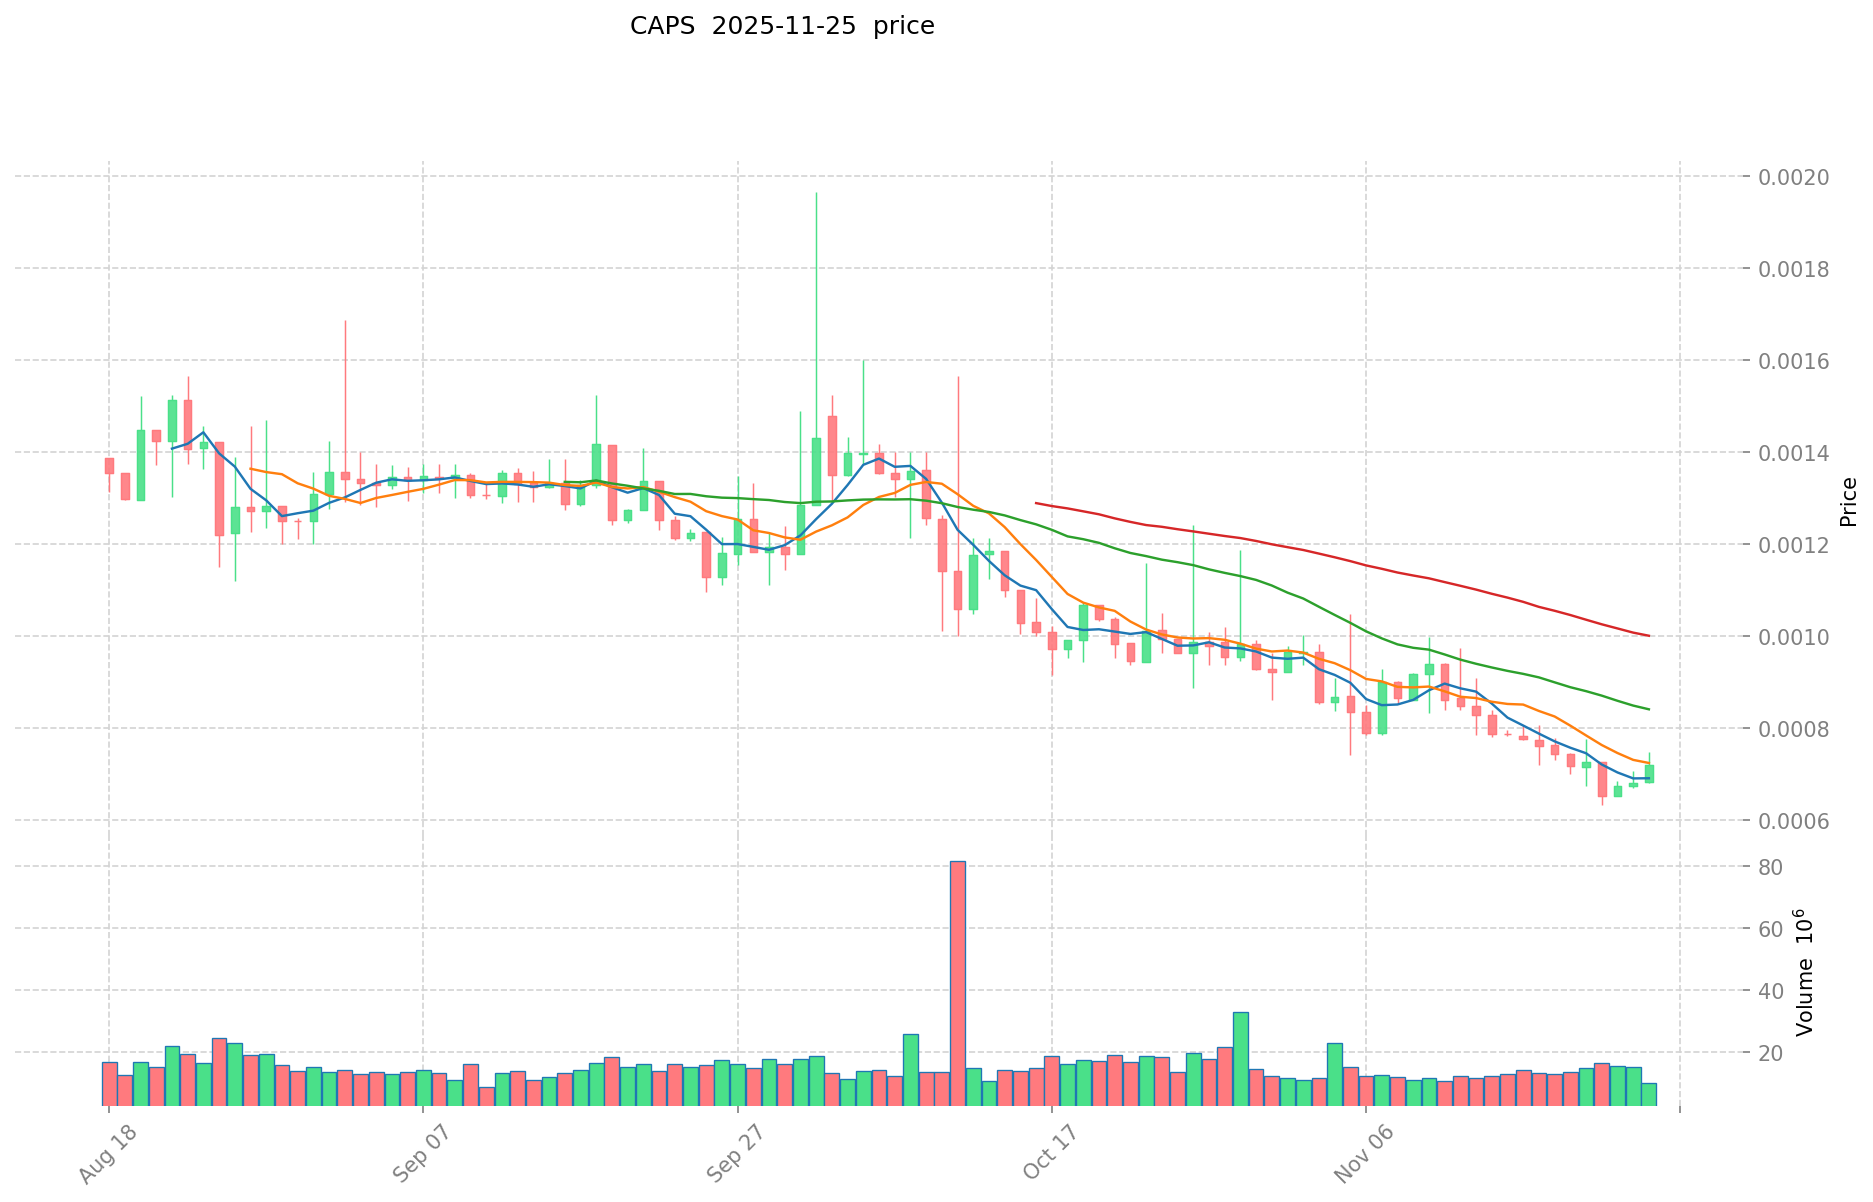
- 2025: CAPS hit its all-time low of $0.00064642 on November 22, reflecting the continued market downturn.
CAPS Current Market Situation
As of November 25, 2025, CAPS is trading at $0.0007197, showing a slight recovery from its recent all-time low. The token has experienced a 3.71% increase in the past 24 hours, with a trading volume of $5,590.85. CAPS's market capitalization currently stands at $1,316,670.96, ranking it 2433rd in the global cryptocurrency market.
Despite the recent positive 24-hour performance, CAPS has been on a downward trend in the medium to long term. The token has seen a 25.19% decrease over the past 30 days and a substantial 88.57% decline over the past year. This significant price drop reflects the broader crypto market conditions and specific challenges faced by the Ternoa project.
The current circulating supply of CAPS is 1,829,471,951 tokens, which represents 73.18% of the total supply of 2,495,986,190 CAPS. The fully diluted market capitalization is $1,796,361.26, indicating potential for growth if market conditions improve.
Click to view the current CAPS market price
CAPS MARKET SENTIMENT INDICATOR
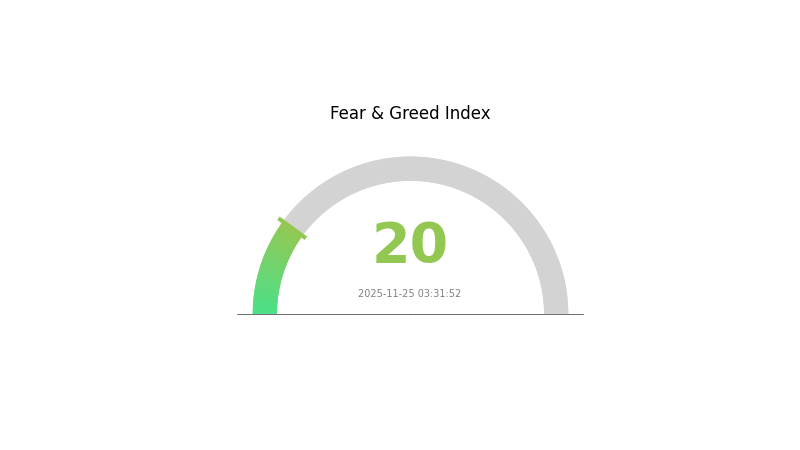
2025-11-25 Fear and Greed Index: 20 (Extreme Fear)
Click to view the current Fear & Greed Index
The crypto market is gripped by extreme fear, with the sentiment index plummeting to 20. This level of pessimism often presents potential buying opportunities for contrarian investors. However, it's crucial to approach with caution and conduct thorough research. Remember, market sentiment can shift rapidly. Stay informed, diversify your portfolio, and consider using Gate.com's advanced trading tools to navigate these turbulent waters. As always, only invest what you can afford to lose in this volatile market.
CAPS Holdings Distribution
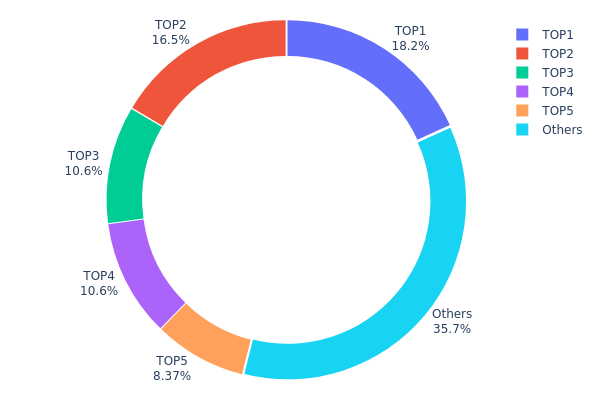
The address holdings distribution data for CAPS reveals a significant concentration of tokens among a few top addresses. The top 5 addresses collectively hold 64.3% of the total CAPS supply, with the largest holder controlling 18.24%. This high concentration suggests a relatively centralized token distribution, which could have implications for market dynamics and price stability.
Such a concentrated distribution raises concerns about potential market manipulation and volatility. Large holders, often referred to as "whales," have the capacity to significantly influence price movements through substantial buy or sell orders. However, it's worth noting that the third-largest holder is a "dead" address (0x0000...00dead), likely representing burned tokens, which slightly mitigates centralization concerns.
The current distribution pattern indicates a low level of decentralization in CAPS token ownership. While this may provide some stability in the short term, it could pose risks to the long-term health and adoption of the CAPS ecosystem. Broader distribution among a larger number of holders would generally be considered more favorable for the token's long-term prospects and market resilience.
Click to view the current CAPS Holdings Distribution
| Top | Address | Holding Qty | Holding (%) |
|---|---|---|---|
| 1 | 0x2a3d...ca2ede | 456038.38K | 18.24% |
| 2 | 0x5fc0...a462ab | 412559.84K | 16.50% |
| 3 | 0x0000...00dead | 265018.31K | 10.60% |
| 4 | 0xb6d7...936e31 | 264794.00K | 10.59% |
| 5 | 0xcbb5...d7971c | 209350.00K | 8.37% |
| - | Others | 892239.47K | 35.7% |
II. Key Factors Affecting Future CAPS Price
Supply Mechanism
- Minting and Burning: The mechanism for minting and burning CAPS tokens has a substantial impact on long-term price trends.
- Current Impact: Investors should monitor the token's supply changes and their effects on market dynamics.
Institutional and Whale Dynamics
- Institutional Holdings: The concentration of CAPS tokens among major holders influences price stability and potential volatility.
- Corporate Adoption: Adoption by reputable companies could boost CAPS's utility and value proposition.
Macroeconomic Environment
- Inflation Hedging Properties: CAPS's performance in inflationary environments may affect its attractiveness as a store of value.
Technical Development and Ecosystem Building
- Ecosystem Applications: The development of DApps and ecosystem projects utilizing CAPS could drive demand and price appreciation.
III. CAPS Price Prediction for 2025-2030
2025 Outlook
- Conservative prediction: $0.00054 - $0.00072
- Neutral prediction: $0.00072 - $0.00087
- Optimistic prediction: $0.00087 - $0.00103 (requires favorable market conditions)
2027 Mid-term Outlook
- Market stage expectation: Potential growth phase
- Price range forecast:
- 2026: $0.00079 - $0.00114
- 2027: $0.00077 - $0.00128
- Key catalysts: Increasing adoption and technological improvements
2030 Long-term Outlook
- Base scenario: $0.00092 - $0.00140 (assuming steady market growth)
- Optimistic scenario: $0.00140 - $0.00190 (assuming strong market performance)
- Transformative scenario: $0.00190+ (under extremely favorable conditions)
- 2030-12-31: CAPS $0.0019 (potential peak price)
| 年份 | 预测最高价 | 预测平均价格 | 预测最低价 | 涨跌幅 |
|---|---|---|---|---|
| 2025 | 0.00103 | 0.00072 | 0.00054 | 0 |
| 2026 | 0.00114 | 0.00087 | 0.00079 | 21 |
| 2027 | 0.00128 | 0.00101 | 0.00077 | 39 |
| 2028 | 0.00131 | 0.00114 | 0.00074 | 58 |
| 2029 | 0.00157 | 0.00123 | 0.00071 | 70 |
| 2030 | 0.0019 | 0.0014 | 0.00092 | 94 |
IV. CAPS Professional Investment Strategy and Risk Management
CAPS Investment Methodology
(1) Long-term Holding Strategy
- Suitable for: Investors with high risk tolerance and belief in blockchain technology
- Operation suggestions:
- Accumulate CAPS during market dips
- Set price targets and regularly review investment thesis
- Store CAPS in a secure hardware wallet
(2) Active Trading Strategy
- Technical analysis tools:
- Moving Averages: Use to identify trend directions and potential reversal points
- RSI (Relative Strength Index): Monitor overbought/oversold conditions
- Key points for swing trading:
- Set stop-loss orders to limit potential losses
- Take profits at predetermined levels
CAPS Risk Management Framework
(1) Asset Allocation Principles
- Conservative investors: 1-3% of portfolio
- Aggressive investors: 5-10% of portfolio
- Professional investors: Up to 15% of portfolio
(2) Risk Hedging Solutions
- Diversification: Spread investments across multiple cryptocurrencies and traditional assets
- Options strategies: Use put options for downside protection
(3) Secure Storage Solutions
- Hot wallet recommendation: Gate Web3 Wallet
- Cold storage solution: Hardware wallet for long-term holdings
- Security precautions: Enable two-factor authentication, use strong passwords, and regularly update software
V. CAPS Potential Risks and Challenges
CAPS Market Risks
- High volatility: CAPS price may experience significant fluctuations
- Low liquidity: Limited trading volume may impact ability to enter/exit positions
- Market sentiment: Susceptible to overall cryptocurrency market trends
CAPS Regulatory Risks
- Uncertain regulatory environment: Potential for stricter regulations on cryptocurrencies
- Cross-border restrictions: Possible limitations on international transactions
- Tax implications: Evolving tax laws may affect investment returns
CAPS Technical Risks
- Smart contract vulnerabilities: Potential for security breaches or exploits
- Scalability challenges: Limitations in transaction processing capacity
- Network congestion: Possible delays or higher fees during peak usage
VI. Conclusion and Action Recommendations
CAPS Investment Value Assessment
CAPS presents a high-risk, high-potential investment opportunity in the blockchain and NFT space. While it offers innovative technology for data transmission through NFTs, its low market cap and limited adoption pose significant risks.
CAPS Investment Recommendations
✅ Beginners: Consider small, experimental positions after thorough research ✅ Experienced investors: Implement dollar-cost averaging strategy with strict risk management ✅ Institutional investors: Conduct in-depth due diligence and consider as part of a diversified crypto portfolio
CAPS Trading Participation Methods
- Spot trading: Purchase CAPS on Gate.com exchange
- Staking: Participate in staking programs if available to earn passive income
- NFT ecosystem: Engage with Ternoa's NFT functionalities to gain practical experience
Cryptocurrency investments carry extremely high risks, and this article does not constitute investment advice. Investors should make decisions carefully based on their own risk tolerance and are advised to consult professional financial advisors. Never invest more than you can afford to lose.
FAQ
Can Coti reach $10?
Yes, it's possible for COTI to reach $10, but likely not until after 2030. Current predictions suggest a more modest growth to $5.1 in five years.
Will comp reach 1000?
Yes, COMP reached $1,000 by 2025 due to strong market demand and favorable economic conditions, validating earlier predictions.
Will Solana reach $1000 in 2025?
Based on expert predictions, Solana has a chance to reach $1000 in 2025. Some analysts forecast SOL could hit this milestone, with price targets ranging from $200 to $1000 for 2025.
What is the price prediction for Capstone Holding Corp?
Based on current market trends and analysis, the price prediction for Capstone Holding Corp is expected to reach $1.120 in the next 14 days, with potential for further growth in the long term.
Share
Content
Introduction: CAPS Market Position and Investment Value
I. CAPS Price History Review and Current Market Status
II. Key Factors Affecting Future CAPS Price
III. CAPS Price Prediction for 2025-2030
IV. CAPS Professional Investment Strategy and Risk Management
V. CAPS Potential Risks and Challenges
VI. Conclusion and Action Recommendations
FAQ

