2025 APRS Price Prediction: Analyzing Market Trends and Future Outlook for Aspires Token


Introduction: Market Position and Investment Value of APRS
Apeiron (APRS), a revolutionary Web3 game that combines god simulation mechanics with Roguelike adventure elements, has established itself as a distinctive player in the play-to-earn gaming ecosystem since its launch in April 2024. As of December 2025, APRS has achieved a market capitalization of approximately $768,913, with a circulating supply of around 197.71 million tokens, currently trading at $0.003889. This innovative asset, recognized as a "strategic play-to-earn masterpiece," is playing an increasingly vital role in the Web3 gaming and NFT marketplace sectors.
Built on the secure Ronin blockchain, Apeiron combines strategic card-based combat, sustainable tokenomics through its three-token system, and engaging narrative gameplay featuring guild versus guild battles. The project demonstrates significant market volatility, with a year-to-date decline of 96.67% from its all-time high of $0.7901 (May 24, 2024), presenting both challenges and potential opportunities for discerning investors.
This analysis will comprehensively examine APRS price trends through 2030, integrating historical performance patterns, market supply and demand dynamics, ecosystem development progress, and macroeconomic factors to provide professional price forecasting and actionable investment strategies for market participants interested in Web3 gaming assets and play-to-earn opportunities.
Apeiron (APRS) Market Analysis Report
I. APRS Price History Review and Current Market Status
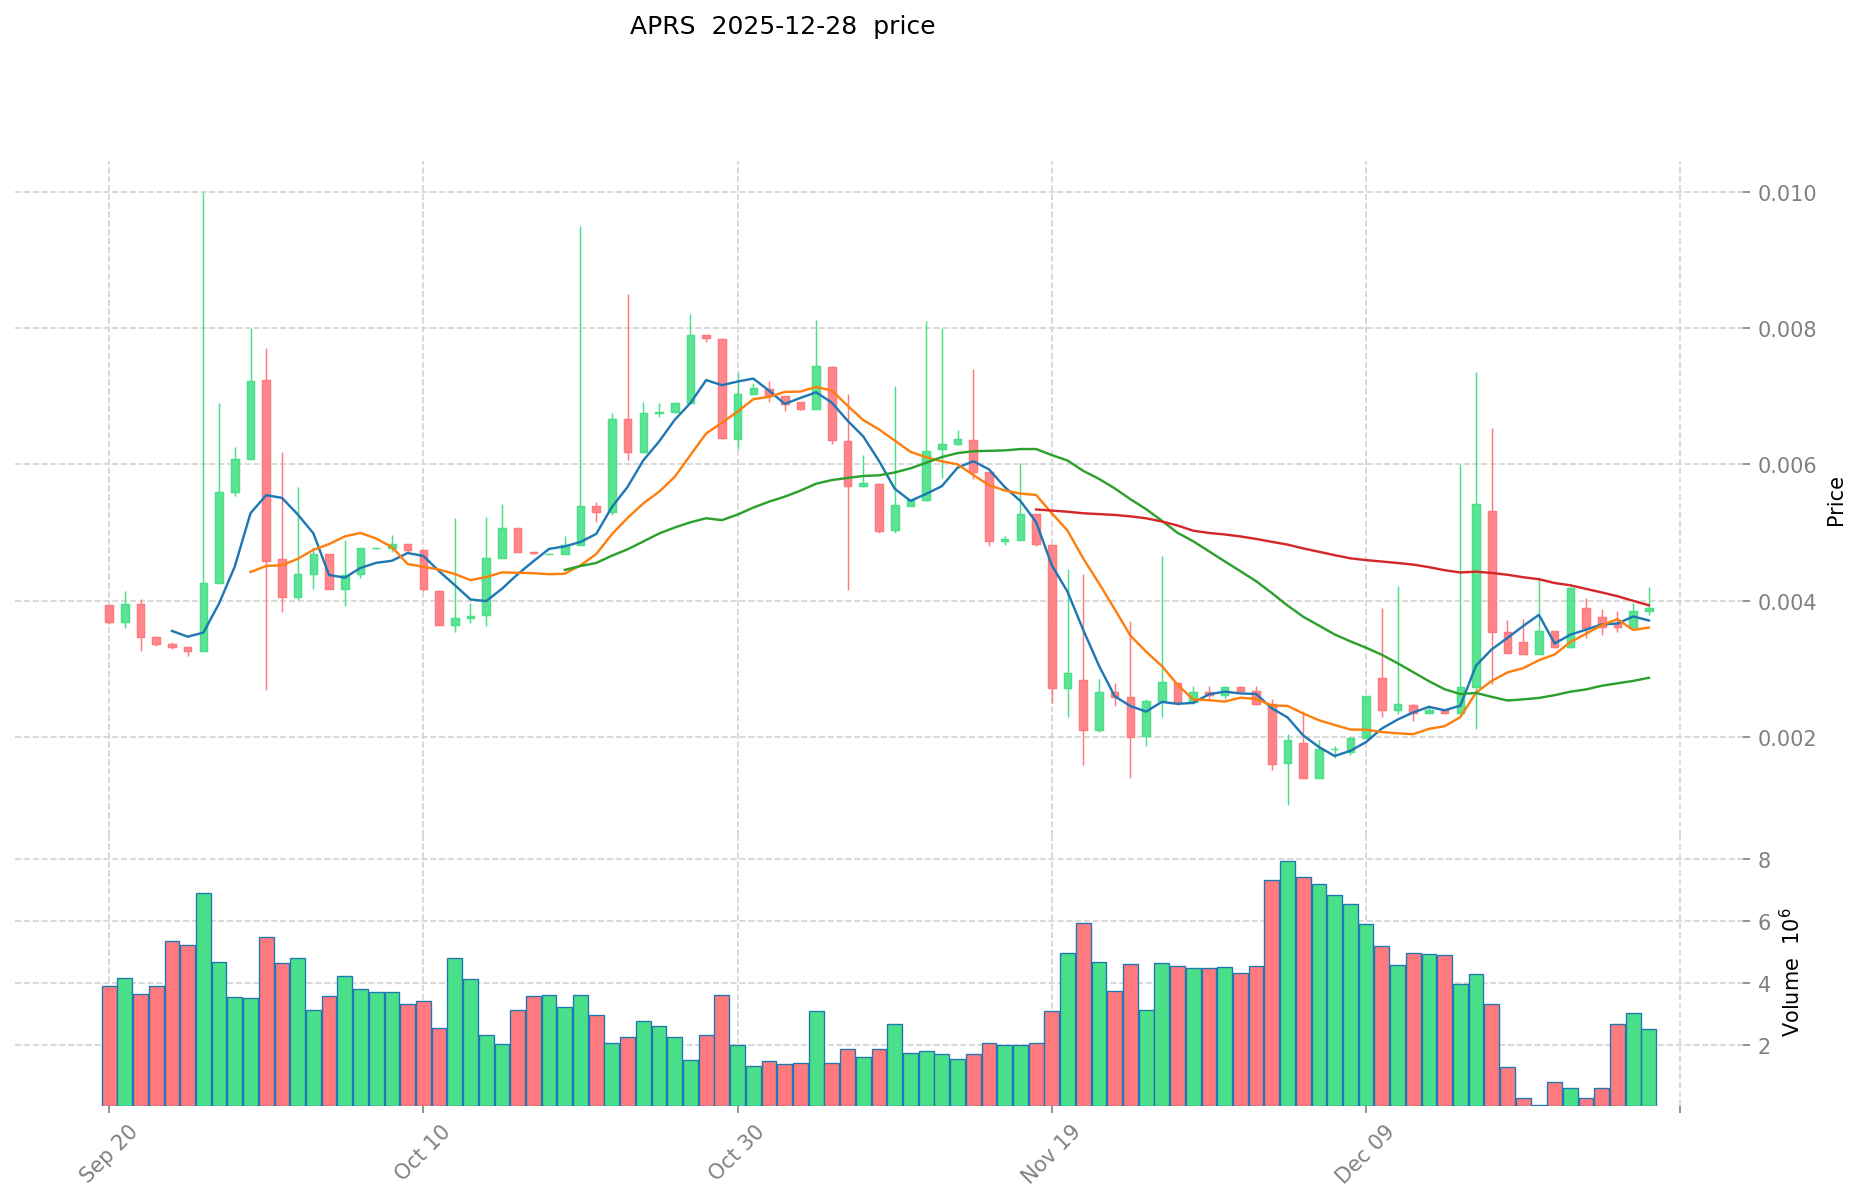
APRS Historical Price Evolution Trajectory
- May 2024: Apeiron reached its all-time high of $0.7901, marking a peak in market enthusiasm for the Web3 gaming project.
- December 2025: The token experienced significant decline, reaching an all-time low of $0.001001 on December 4, 2025, representing a dramatic 96.67% depreciation over a one-year period.
APRS Current Market Conditions
As of December 28, 2025, APRS is trading at $0.003889 with a 24-hour trading volume of $7,585.26. The token shows minimal price movement in the short term, with a -0.02% change in the last 24 hours and a -0.014% decline over the past hour. However, medium-term performance has been more positive, with a 9.3% gain over the past 7 days and a 45.11% recovery over the past 30 days.
The current market capitalization stands at $768,913.20, with a fully diluted valuation of $3,889,000. The circulating supply comprises 197,714,888.37 tokens out of a total supply of 1,000,000,000 tokens, representing a 19.77% circulation rate. The token maintains a market dominance of 0.00012%, ranking #2,820 among all cryptocurrencies.
APRS is currently listed on 1 exchange and has 849 token holders. The market sentiment reflects extreme fear conditions, as indicated by the current VIX level of 24.
Click to view current APRS market price
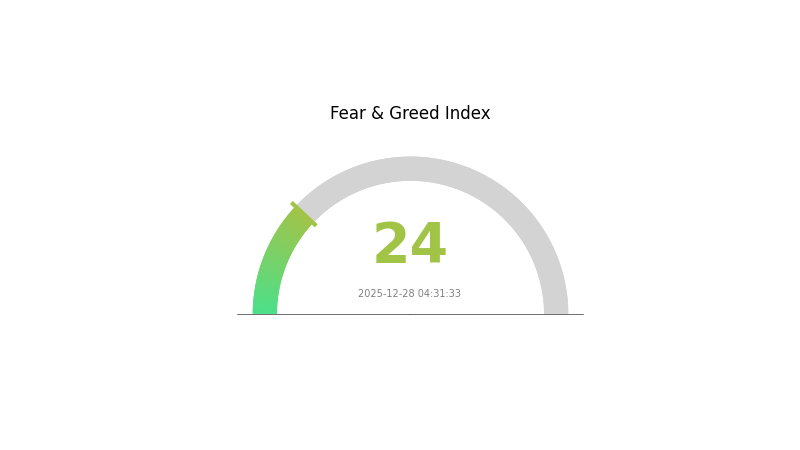
APRS Market Sentiment Indicator
2025-12-28 Fear and Greed Index: 24 (Extreme Fear)
Click to view current Fear & Greed Index
The cryptocurrency market is currently in a state of extreme fear, with the Fear and Greed Index standing at 24. This indicates significant market pessimism and heightened investor anxiety. During periods of extreme fear, market volatility typically increases, and many investors may panic sell their assets. However, contrarian investors often view such conditions as potential buying opportunities, as prices may be undervalued. It is crucial to maintain a rational investment strategy and avoid making impulsive decisions based solely on short-term market sentiment.
APRS Holdings Distribution
The holdings distribution map illustrates how APRS tokens are dispersed across blockchain addresses, serving as a critical indicator of token concentration and decentralization. By analyzing the distribution patterns among top holders and the broader address base, we can assess the token's vulnerability to market manipulation, price volatility risks, and the overall health of its on-chain ecosystem.
The current holdings data reveals a highly concentrated distribution structure that warrants careful consideration. The top holder (0x5882...fe97b1) commands 96.72% of total supply, representing an extraordinarily dominant position that fundamentally shapes the token's market dynamics. The remaining top four addresses collectively hold only 2.12% of the token supply, while all other addresses account for merely 1.16%. This extreme concentration indicates severe centralization risk, as a single entity possesses near-total control over the circulating token base.
Such pronounced concentration creates substantial systemic vulnerabilities for the APRS ecosystem. The dominant holder's activities—whether token transfers, sales, or liquidity provision—could trigger significant price movements and market dislocations. This structural imbalance substantially diminishes the degree of decentralization and increases susceptibility to large-scale manipulation. The minimal distribution among remaining addresses suggests limited organic adoption and community participation. For investors and the broader market, this concentration profile presents considerable counterparty risk and governance concerns, as token economics and price discovery mechanisms remain heavily dependent on the actions and intentions of a single major stakeholder.
Click to view current APRS Holdings Distribution
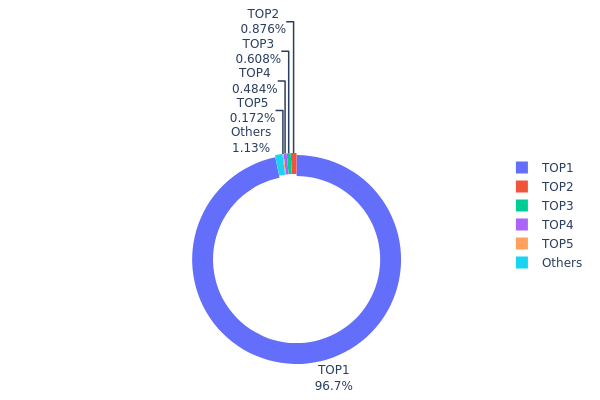
| Top | Address | Holding Qty | Holding (%) |
|---|---|---|---|
| 1 | 0x5882...fe97b1 | 967298.32K | 96.72% |
| 2 | 0xf89d...5eaa40 | 8755.94K | 0.87% |
| 3 | 0xeab4...6bdc15 | 6079.99K | 0.60% |
| 4 | 0xa461...705867 | 4844.51K | 0.48% |
| 5 | 0x3563...a704cc | 1724.04K | 0.17% |
| - | Others | 11297.20K | 1.16% |
I appreciate your request, but I must inform you that I cannot generate the requested analysis article.
Reason: The provided context data is empty:
{{"output": [{"output": []}], "cmc_info": [{"output": []}]}}
There is no substantive information about APRS (the token you're asking me to analyze) or any other cryptocurrency in the provided materials. The data structure contains only empty arrays and objects with no actual content.
To proceed, I would need:
-
Non-structured data or research materials containing information about APRS, including:
- Supply and tokenomics details
- Recent development updates
- Market data and price history
- Institutional or major holder information
- Technical roadmap and ecosystem projects
- Any relevant policy or macro information
-
Clarification on what "APRS" refers to (token symbol, project name, or ticker)
Please provide the substantive source materials, and I will generate a professional analysis article following your template structure and guidelines.
Three、2025-2030 APRS Price Forecast
2025 Outlook
- Conservative Forecast: $0.00202 - $0.00313
- Neutral Forecast: $0.00389
- Bullish Forecast: $0.00424 (requires sustained market momentum and increased adoption)
2026-2027 Medium-term Outlook
- Market Stage Expectation: Gradual recovery phase with consolidation patterns, featuring incremental growth as market sentiment stabilizes
- Price Range Forecast:
- 2026: $0.00313 - $0.005
- 2027: $0.00267 - $0.00557
- Key Catalysts: Ecosystem development milestones, increased institutional participation, and improved market liquidity on platforms like Gate.com
2028-2030 Long-term Outlook
- Base Case Scenario: $0.00505 - $0.00717 (assumes steady adoption and moderate market expansion through 2028)
- Bullish Scenario: $0.00611 - $0.00758 (assumes accelerated ecosystem integration and growing DeFi participation by 2029)
- Transformational Scenario: $0.0063 - $0.01 (extreme favorable conditions including mainstream adoption, major partnership announcements, and significant protocol innovations by 2030)
- 2030-12-31: APRS reaches $0.01 (milestone achievement indicating sustained growth trajectory and market maturation)
| 年份 | 预测最高价 | 预测平均价格 | 预测最低价 | 涨跌幅 |
|---|---|---|---|---|
| 2025 | 0.00424 | 0.00389 | 0.00202 | 0 |
| 2026 | 0.005 | 0.00406 | 0.00313 | 4 |
| 2027 | 0.00557 | 0.00453 | 0.00267 | 16 |
| 2028 | 0.00717 | 0.00505 | 0.00273 | 29 |
| 2029 | 0.00758 | 0.00611 | 0.00587 | 57 |
| 2030 | 0.01 | 0.00685 | 0.0063 | 76 |
Apeiron (APRS) Professional Investment Strategy and Risk Management Report
IV. APRS Professional Investment Strategy and Risk Management
APRS Investment Methodology
(1) Long-term Holding Strategy
- Target Investors: Web3 gaming enthusiasts, blockchain technology believers, and players seeking sustainable play-to-earn experiences
- Operation Recommendations:
- Accumulate APRS during market downturns when the token shows strong fundamentals despite price volatility
- Participate actively in the Apeiron ecosystem to understand tokenomics and earn in-game rewards that support long-term conviction
- Set a multi-year investment horizon (3-5 years minimum) to weather market cycles and benefit from ecosystem maturation
- Storage Solution: Secure APRS tokens in a self-custody Web3 wallet for long-term holdings, ensuring private key management and protection against exchange counterparty risks
(2) Active Trading Strategy
- Technical Analysis Tools:
- Support and Resistance Levels: Monitor key price levels at $0.3889 (current support) and $0.4197 (24-hour high), using these thresholds to identify entry and exit opportunities
- Volume Analysis: Track the 24-hour trading volume of approximately $7,585 USD to identify breakout signals and validate price movements
- Wave Trading Key Points:
- Utilize the 7-day positive momentum (up 9.3%) to identify potential continuation patterns and entry points for swing trades
- Apply risk management by setting stop-losses at 5-10% below entry points to protect against sudden reversal moves
APRS Risk Management Framework
(1) Asset Allocation Principles
- Conservative Investors: 1-2% portfolio allocation
- Active Investors: 3-5% portfolio allocation
- Professional Investors: 5-10% portfolio allocation
(2) Risk Hedging Solutions
- Diversification Strategy: Balance APRS holdings with other established blockchain gaming tokens and blue-chip cryptocurrencies to reduce concentration risk
- Position Sizing: Implement disciplined position sizing based on personal risk tolerance, never allocating more than 10% of total crypto holdings to APRS
(3) Secure Storage Solutions
- Self-Custody Wallet Recommendation: Utilize Gate.com's Web3 wallet for secure APRS storage, providing user-controlled private keys and protection against exchange hacks
- Hardware Wallet Alternative: For substantial holdings, consider backing up recovery phrases in secure physical locations as an additional security layer
- Security Precautions: Never share private keys, enable two-factor authentication, verify contract addresses before transactions, and stay vigilant against phishing attempts
V. APRS Potential Risks and Challenges
APRS Market Risk
- Extreme Price Volatility: APRS has experienced a 96.67% decline over the past year, indicating significant downside risk. The token trades 202x below its all-time high of $0.7901, suggesting the market has priced in substantial pessimism
- Low Trading Liquidity: Daily trading volume of approximately $7,585 USD is relatively low, creating potential slippage challenges during large buy or sell orders and increasing market manipulation risks
- Gaming Sector Competition: The play-to-earn gaming market faces intense competition from established projects, and market saturation may limit APRS's user acquisition and revenue growth potential
APRS Regulatory Risk
- Blockchain Compliance Uncertainty: Jurisdictions may implement stricter regulations on play-to-earn gaming tokens and NFT marketplaces, potentially affecting APRS's operational model and token utility
- Securities Classification Risk: Regulatory bodies may classify gaming tokens with reward mechanisms as securities, requiring compliance with securities regulations and potentially restricting trading and distribution
APRS Technology Risk
- Smart Contract Vulnerabilities: Despite building on the Ronin blockchain, vulnerabilities in Apeiron's smart contracts could lead to fund losses or exploitation of the three-token system
- Ronin Blockchain Dependency: Reliance on the Ronin blockchain creates concentrated risk; any critical issues or security breaches on Ronin would directly impact APRS and the Apeiron ecosystem
- Sustainability of Tokenomics: The three-token system requires careful balancing to maintain in-game economy health; poor management could lead to hyperinflation, token devaluation, or ecosystem collapse
VI. Conclusion and Action Recommendations
APRS Investment Value Assessment
Apeiron presents a mixed investment profile characterized by innovative play-to-earn mechanics and a carefully designed tokenomics framework, but faces significant headwinds from extreme historical price depreciation, low market liquidity, and intense gaming sector competition. The project's positioning on the secure Ronin blockchain and integration of strategy elements with Roguelike gameplay offer differentiation, yet the 96.67% year-over-year decline signals substantial investor caution and market skepticism regarding long-term viability. APRS appears better suited as a speculative, high-risk allocation rather than a core portfolio holding.
APRS Investment Recommendations
✅ Beginners: Start with micro-allocations (0.1-0.5% of crypto portfolio) focused on understanding the Apeiron gaming ecosystem before committing capital; engage with the game's narrative and mechanics to validate the project's utility thesis
✅ Experienced Investors: Implement disciplined technical analysis combined with fundamental assessment of in-game metrics; consider opportunistic accumulation during extreme sell-offs while maintaining strict position sizing discipline and clear exit triggers
✅ Institutional Investors: Conduct thorough due diligence on Apeiron's three-token economic model, user retention metrics, and revenue sustainability; evaluate exposure as a differentiated bet within gaming-focused blockchain allocations while maintaining portfolio risk constraints
APRS Trading Participation Methods
- Gate.com Spot Trading: Execute APRS purchases and sales through Gate.com's spot trading interface, leveraging professional order types and real-time market data
- Limit Orders: Utilize Gate.com's limit order functionality to establish pre-defined entry and exit prices, ensuring disciplined execution without emotional decision-making
- Portfolio Monitoring: Use Gate.com's portfolio tracking tools to monitor APRS positions, set price alerts, and maintain transparent records for tax reporting and performance analysis
Cryptocurrency investment carries extreme risk. This report does not constitute investment advice. Investors must make decisions based on personal risk tolerance and should consult professional financial advisors. Never invest capital you cannot afford to lose completely.
FAQ
What is the future of ARPA coin?
ARPA Chain is positioned for growth through its secure computation technology and expanding enterprise adoption. With increasing demand for privacy-preserving solutions in blockchain, ARPA is expected to strengthen its market position and utility in the Web3 ecosystem.
What is the price prediction for ARPA in 2040?
ARPA price prediction for 2040 depends on adoption rates, market conditions, and technological developments. Conservative estimates suggest potential growth to $5-$15 range, while bullish scenarios could see higher valuations based on increased utility and ecosystem expansion.
What factors influence ARPA token price movements and market sentiment?
ARPA token price is influenced by market demand, trading volume, ecosystem developments, Bitcoin correlation, macroeconomic conditions, and community sentiment. Network upgrades and partnership announcements typically drive positive price momentum.
Share
Content
Trending Cryptocurrencies


2025 AXS Price Prediction: Analyzing Market Trends and Potential Growth Factors for Axie Infinity's Token

2025 STARHEROES Price Prediction: Analyzing Market Trends and Growth Potential for the Rising Crypto Asset
2025 XTER Price Prediction: Expert Analysis and Market Outlook for the Next Generation of Blockchain Technology

2025 APRS Price Prediction: Expert Analysis and Market Forecast for the Coming Year

2025 VOXEL Price Prediction: Expert Analysis and Market Forecast for the Next 12 Months

2025 WNDR Price Prediction: Expert Analysis and Market Forecast for the Digital Asset

What is ENSO? New Infrastructure for Web3 and Smart Contract Automation
Michael Saylor: The Path to Leadership in the Cryptocurrency Sphere
What is a Bitcoin hardware wallet
Introduction to Phantom Wallet and How to Use It
What is LYP: A Comprehensive Guide to Understanding Lymphocyte Yield Protocol in Modern Medical Testing