GateUser-c5528316
用戶暫無簡介
GateUser-c5528316
Beware of Risks of Major Bitcoin Pullback
The daily chart closed with a small bearish candlestick with an upper shadow, failing to successfully hold above 74,800. Instead, it surged and pulled back, which could be viewed as a false breakout trap for bulls.
Looking at the 4-hour timeframe, examining the bullish volume momentum curve: price rebounded from 60,000 to 76,000, with bullish volume showing a gradual declining trend. This indicates that bullish momentum is exhausting and confidence is waning.
BTC-0.04%
- 讚賞
- 2
- 留言
- 轉發
- 分享
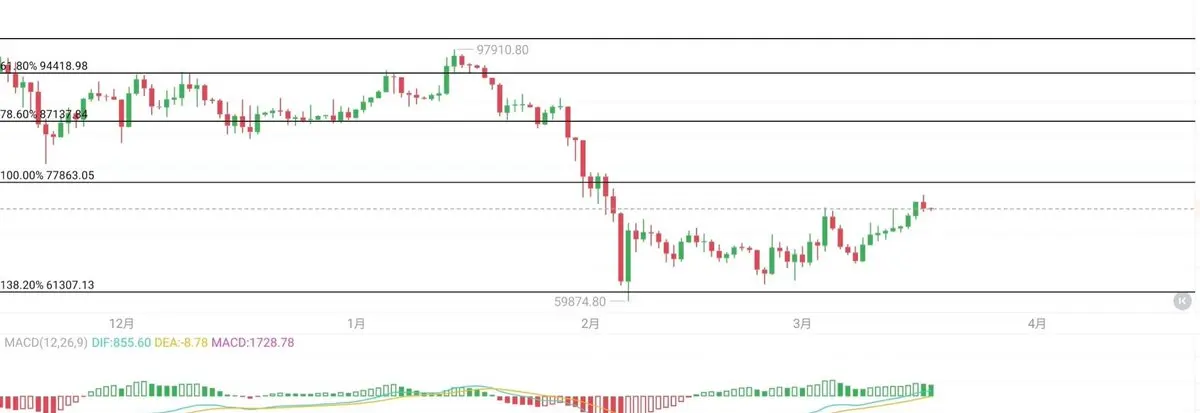
警惕大饼後續大跌的風險
日線收出一根上影線的小陰K線,並未成功站穩7.48萬上方,而是沖高回落,這裡可能視為假突破誘多
4小時來看多頭量能波動曲線:價格從6萬反彈到 7.6萬,多頭量能呈現逐漸遞減狀態,可見,多頭力量已在衰竭和信心不足
另外明天是19號的美聯儲FOMC會議,預估未來三個月的降息概率均為0,因為石油價格上漲和通貨膨脹上升。
BTC價格已反彈至 7.6萬,結合上面羅列的因素,B很可能這波反彈止步於7.6萬,將可能成為一個開啟中線下跌趨勢的變盤時間節點。
日線收出一根上影線的小陰K線,並未成功站穩7.48萬上方,而是沖高回落,這裡可能視為假突破誘多
4小時來看多頭量能波動曲線:價格從6萬反彈到 7.6萬,多頭量能呈現逐漸遞減狀態,可見,多頭力量已在衰竭和信心不足
另外明天是19號的美聯儲FOMC會議,預估未來三個月的降息概率均為0,因為石油價格上漲和通貨膨脹上升。
BTC價格已反彈至 7.6萬,結合上面羅列的因素,B很可能這波反彈止步於7.6萬,將可能成為一個開啟中線下跌趨勢的變盤時間節點。
BTC-0.04%
- 讚賞
- 按讚
- 留言
- 轉發
- 分享
I notice this text is already in Traditional Chinese (or Simplified Chinese). Let me check - the text uses simplified characters like "咋", "吃紧", "脑洞", which are Simplified Chinese markers.
Converting to Traditional Chinese:
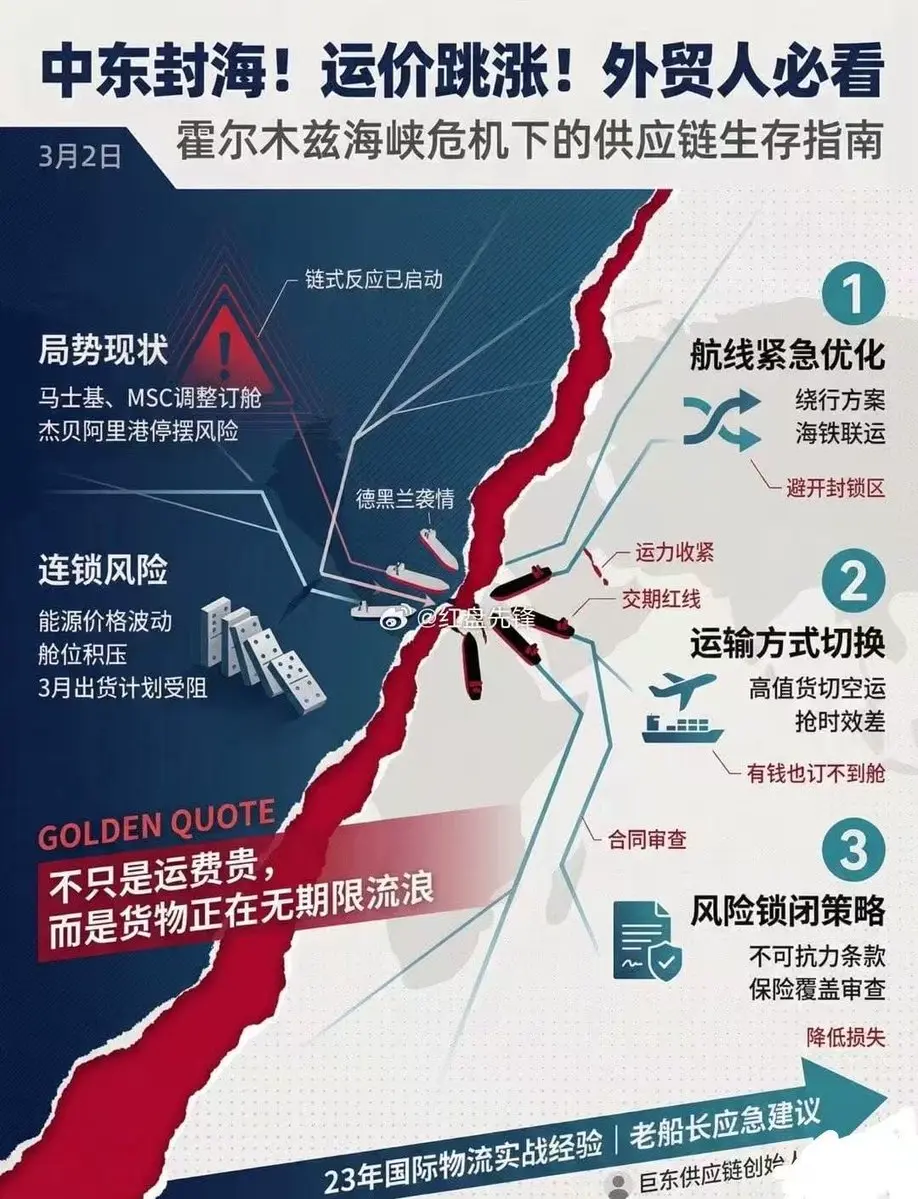
日本人要求中方開放長江,從陸地運石油回東京灣,這一招是咋想出來的? 最近,波斯灣那邊戰事吃緊,伊朗威脅把霍爾木茲海峽給封了,日本有些網友就開始腦洞大開,呼籲向聯合國申請,讓中國開放長江航道,搞一條「陸上石油高速」,把中東的油通過管道鋪到中國,再從長江口裝船運回東京灣。
查看原文Converting to Traditional Chinese:
日本人要求中方開放長江,從陸地運石油回東京灣,這一招是咋想出來的? 最近,波斯灣那邊戰事吃緊,伊朗威脅把霍爾木茲海峽給封了,日本有些網友就開始腦洞大開,呼籲向聯合國申請,讓中國開放長江航道,搞一條「陸上石油高速」,把中東的油通過管道鋪到中國,再從長江口裝船運回東京灣。
- 讚賞
- 2
- 留言
- 轉發
- 分享
日本人要求中方開放長江,從陸地運石油回東京灣,這一招是怎麼想出來的? 最近,波斯灣那邊戰事吃緊,伊朗威脅把霍爾木茲海峽封了,日本有些網友就開始腦洞大開,呼籲向聯合國申請,讓中國開放長江航道,搞一條“陸上石油高速”,把中東的油通過管道鋪到中國,再從長江口裝船運回東京灣。 數據顯示,日本超過90%的原油依賴中東,而這條生命線必須經過霍爾木茲海峽。現在的情況是,波斯灣局勢火藥味越來越濃。一旦伊朗真的動手封鎖海峽,或者那裡爆發大規模衝突導致航道中斷,日本的油輪就得在海上“趴窩”。對於日本來說,這不僅僅是油價上漲的問題,而是整個國家機器可能停擺的生存危機。 所以,當“霍爾木茲海峽可能被關閉”這個噩夢懸在頭頂時,日本民間那種“只要能活命,什麼招都敢想”的焦慮感就爆發了。他們想到的邏輯鏈條很簡單:既然海路不通,那就走陸路;既然中國離中東更近(相對海運繞道),那就借中國的道。 但這個“長江運油計劃”,只要稍微攤開地圖看一眼,就會發現它在地理和工程上幾乎是個“死局”。提議中說“在陸地上先打通中國和波斯灣的石油管道”。咱們看看地圖:波斯灣在中東地區,中國在東亞。中間隔著伊朗高原、阿富汗、巴基斯坦,或者繞道中亞各國。 目前中國確實有從中亞和俄羅斯進口石油的管道,也有中緬管道。但是,直接從波斯灣沿岸修一條幾千公里的管道穿過戰亂頻發的阿富汗或巴基斯坦進入中國西部,再橫跨整個中國腹地連接到長江水系? 刀哥覺得
查看原文- 讚賞
- 1
- 留言
- 轉發
- 分享
這幾天,所有人都在盯著中美互呛,但真正的驚雷,其實在華爾街炸開了。 先看第一炸:全球最大資產管理公司貝萊德,直接限制客戶贖回——想取9.3%,只給5%,剩下硬扣。這叫“流動性管理”,說白了就是賴帳。緊隨其後,黑石、燃燒資本也接連凍結贖回,三大巨頭齊爆雷,3萬億美元私人信貸市場,開始全面違約。
查看原文- 讚賞
- 按讚
- 留言
- 轉發
- 分享
這幾天,所有人都在盯著中美互呛,但真正的驚雷,其實在華爾街炸開了。
先看第一炸:全球最大資管貝萊德,直接限制客戶贖回——想取9.3%,只給5%,剩下硬扣。這叫“流動性管理”,說白了就是賴帳。緊隨其後,黑石、燃燒資本也接連凍結贖回,三大巨頭齊爆雷,3萬億美元私人信貸市場,開始全面違約。
第二炸:油價一天飆12%,衝破90美元。霍爾木茲海峽一封,通脹馬上反彈,美聯儲降息無望,滯脹風險拉滿。
第三炸:非農就業不僅沒漲,反而跌,失業率沖到10.4%。高盛直言:美國經濟,已經踩進滯脹泥潭。
三個炸點,看似孤立,實則因果閉環:地緣衝突推高油價→通脹反彈→就業惡化→私募信貸崩盤→系統風險引爆。
更要命的是,伊朗用幾萬美元的無人機,消耗美國幾百萬一枚的攔截彈。一個月伊朗造100枚導彈,美國只能造六七枚攔截彈。這仗,怎麼打?
美軍專家哀嘆:連伊朗都耗不起,还想跟工業大國拼產能?
老特現在兩頭難:撤,等於地緣破產;打,沒錢沒人沒彈。國內信貸崩盤、通脹失控、就業萎縮,一步錯,步步錯。
歷史從不新鮮:越南戰爭拖垮美國經濟,滯脹魔咒纏了十年。今天,劇本重寫。
美聯儲只剩一條路:放水救市。通脹總比滯脹強。但雷已經炸了,會不會變成連環雷?會不會超過2008年?
查看原文先看第一炸:全球最大資管貝萊德,直接限制客戶贖回——想取9.3%,只給5%,剩下硬扣。這叫“流動性管理”,說白了就是賴帳。緊隨其後,黑石、燃燒資本也接連凍結贖回,三大巨頭齊爆雷,3萬億美元私人信貸市場,開始全面違約。
第二炸:油價一天飆12%,衝破90美元。霍爾木茲海峽一封,通脹馬上反彈,美聯儲降息無望,滯脹風險拉滿。
第三炸:非農就業不僅沒漲,反而跌,失業率沖到10.4%。高盛直言:美國經濟,已經踩進滯脹泥潭。
三個炸點,看似孤立,實則因果閉環:地緣衝突推高油價→通脹反彈→就業惡化→私募信貸崩盤→系統風險引爆。
更要命的是,伊朗用幾萬美元的無人機,消耗美國幾百萬一枚的攔截彈。一個月伊朗造100枚導彈,美國只能造六七枚攔截彈。這仗,怎麼打?
美軍專家哀嘆:連伊朗都耗不起,还想跟工業大國拼產能?
老特現在兩頭難:撤,等於地緣破產;打,沒錢沒人沒彈。國內信貸崩盤、通脹失控、就業萎縮,一步錯,步步錯。
歷史從不新鮮:越南戰爭拖垮美國經濟,滯脹魔咒纏了十年。今天,劇本重寫。
美聯儲只剩一條路:放水救市。通脹總比滯脹強。但雷已經炸了,會不會變成連環雷?會不會超過2008年?
- 讚賞
- 按讚
- 留言
- 轉發
- 分享
經常有人問我:行情上蹿下跳,你怎麼好像從來不慌? 說實話,不是我心態多好,而是我早就過了靠感覺炒幣的階段。 這些年見過太多人,技術分析頭頭是道,指標背得比誰都熟,最後虧得最慘的往往也是他們。為什麼?太想抓住每一波行情,太想精準預判每一次波動。
查看原文- 讚賞
- 按讚
- 留言
- 轉發
- 分享
經常有人問我:行情上蹿下跳,你怎麼好像從來不慌?
說實話,不是我心態多好,而是我早就過了靠感覺炒幣的階段。
這些年見過太多人,技術分析頭頭是道,指標背得比誰都熟,最後虧得最慘的往往也是他們。為什麼?太想抓住每一波行情,太想精準預判每一次波動。
真正在市場裡賺到錢的,反而是那些敢於承認自己看不懂的人。
看不懂就空倉觀望,看得懂才果斷出手。一年交易沒幾次,收益卻跑贏絕大多數人。
我8000u起步的時候,該踩的坑一個沒落:追漲、梭哈、死扛、不服輸,全都幹過。
後來才真正想明白:在這個市場,活得久,遠比賺得快重要一萬倍。
所以現在,我給自己定了三條死規矩:
第一,永遠不滿倉。手裡留有餘地,跌了才有底氣加倉。
第二,堅決不扛單。止損嚴格執行,到點就走,不糾結、不戀戰。
第三,不貪最後一個銅板。利潤該落袋就落袋,留在市場裡的,永遠是風險。
道理說起來簡單,真正執行卻很難。
但只要堅持下來,你會發現一個奇妙的變化:
不再被行情牽著鼻子走,慢慢有了自己的節奏,心態穩了,利潤自然就來了。
查看原文說實話,不是我心態多好,而是我早就過了靠感覺炒幣的階段。
這些年見過太多人,技術分析頭頭是道,指標背得比誰都熟,最後虧得最慘的往往也是他們。為什麼?太想抓住每一波行情,太想精準預判每一次波動。
真正在市場裡賺到錢的,反而是那些敢於承認自己看不懂的人。
看不懂就空倉觀望,看得懂才果斷出手。一年交易沒幾次,收益卻跑贏絕大多數人。
我8000u起步的時候,該踩的坑一個沒落:追漲、梭哈、死扛、不服輸,全都幹過。
後來才真正想明白:在這個市場,活得久,遠比賺得快重要一萬倍。
所以現在,我給自己定了三條死規矩:
第一,永遠不滿倉。手裡留有餘地,跌了才有底氣加倉。
第二,堅決不扛單。止損嚴格執行,到點就走,不糾結、不戀戰。
第三,不貪最後一個銅板。利潤該落袋就落袋,留在市場裡的,永遠是風險。
道理說起來簡單,真正執行卻很難。
但只要堅持下來,你會發現一個奇妙的變化:
不再被行情牽著鼻子走,慢慢有了自己的節奏,心態穩了,利潤自然就來了。
- 讚賞
- 1
- 留言
- 轉發
- 分享
我認識一位從熊市血海中爬出來的老前輩。當年他也是從20萬本金起家,幾輪周期滾下來,現在身家6000萬。 他說這個市場裡,90%的人虧錢,不是因為不夠聰明,是因為管不住自己。情緒一上頭,什麼技術分析都白搭。
查看原文- 讚賞
- 1
- 留言
- 轉發
- 分享
接到警察叔叔電話問虛擬幣?別慌,三招教你輕鬆應對! 接到“公安局”的電話,問起虛擬幣交易,就算你是老手,心裡也得咯噔一下。 別慌!一慌就容易說錯話。記住這三點,關鍵時刻能幫你大忙。 第一招:守住底線——個人交易不違法 警察問交易合不合法?你可以這樣回答:
查看原文- 讚賞
- 2
- 留言
- 轉發
- 分享
接到警察叔叔電話問虛擬幣?別慌,三招教你輕鬆應對!
接到“公安局”的電話,問起虛擬幣交易,就算你是老手,心裡也得咯噔一下。
別慌!一慌就容易說錯話。記住這三點,關鍵時刻能幫你大忙。
第一招:守住底線——個人交易不違法
警察問交易合不合法?你可以這樣回答:
“個人之間買賣虛擬幣本身不違法,但前提是資金來源必須合法。”
核心思想: 明確告訴對方,你只是個普通投資者,不是在洗錢或搞非法活動。
第二招:冷靜應對——配合調查,但不亂擔責
如果警察說你收的钱有問題,讓你退錢,千萬別衝動。保持冷靜,主動配合:
“我一定全力配合調查,把事情搞清楚。”
然後,主動提供你的交易記錄、轉帳截圖等證據。你越配合,解決得越快,越不容易牽連到你其他的帳戶。硬扛,只會讓小事變大事。
第三招:分清情況——配合≠有案底
這裡有個關鍵區別:
如果你是同案犯: 那所有帳戶都可能被凍結。如果你只是正常交易,不小心收到了“黑钱”: 通常只會凍結你收錢的那一張卡。
記住: 積極配合調查,不會給你留下案底。但拒不配合,性質就變了,處理措施也會升級。
查看原文接到“公安局”的電話,問起虛擬幣交易,就算你是老手,心裡也得咯噔一下。
別慌!一慌就容易說錯話。記住這三點,關鍵時刻能幫你大忙。
第一招:守住底線——個人交易不違法
警察問交易合不合法?你可以這樣回答:
“個人之間買賣虛擬幣本身不違法,但前提是資金來源必須合法。”
核心思想: 明確告訴對方,你只是個普通投資者,不是在洗錢或搞非法活動。
第二招:冷靜應對——配合調查,但不亂擔責
如果警察說你收的钱有問題,讓你退錢,千萬別衝動。保持冷靜,主動配合:
“我一定全力配合調查,把事情搞清楚。”
然後,主動提供你的交易記錄、轉帳截圖等證據。你越配合,解決得越快,越不容易牽連到你其他的帳戶。硬扛,只會讓小事變大事。
第三招:分清情況——配合≠有案底
這裡有個關鍵區別:
如果你是同案犯: 那所有帳戶都可能被凍結。如果你只是正常交易,不小心收到了“黑钱”: 通常只會凍結你收錢的那一張卡。
記住: 積極配合調查,不會給你留下案底。但拒不配合,性質就變了,處理措施也會升級。
- 讚賞
- 按讚
- 留言
- 轉發
- 分享
為什麼你一買就跌、一割就飛?真不是你運氣差,是你從頭到尾都在跟著莊家的劇本走,被人牽著鼻子割。 今天我把壓箱底的主力收割套路直接攤開講,看懂這一套,你至少少虧 80%。 很多人進場全憑感覺,漲了就 FOMO
查看原文- 讚賞
- 1
- 留言
- 轉發
- 分享
为什么你一買就跌、一割就飛?真不是你運氣差,是你從頭到尾都在跟著莊家的劇本走,被人牽著鼻子割。
今天我把壓箱底的主力收割套路直接攤開講,看懂這一套,你至少少虧 80%。
很多人進場全憑感覺,漲了就 FOMO 追高,跌了就恐慌割肉,明明每天盯盤十幾個小時,結果越做越虧,越虧越急,最後本金沒了,心態也崩了。
其實行情從來不是亂走的,每一根 K 線,都是莊家在給你下套。
我總結的爆莊三板斧,在圈子裡實戰驗證過無數次,專門對付主力洗盤、砸盤、誘多:
第一斧,誘多拉盤—— 突然爆拉製造熱度,讓你以為主升浪來了,等你衝進去,主力直接出貨。第二斧,恐慌砸盤—— 跌破關鍵位,逼你止損割肉,把不堅定的籌碼全部洗出去。第三斧,反手拉升—— 把散戶洗乾淨後,直接暴力拉升,你剛割完它就飛,氣到拍斷大腿。
不是運氣,是懂節奏、懂結構、懂主力心思。
你一個人瞎琢磨,再研究三年也趕不上一個成熟團隊的判斷。你缺的不是勇氣,是真正能帶你看清方向、避開陷阱、踩準拐點的人。
我能把一個虧麻的粉絲,用策略、方法、執行力帶翻盤,就有能力帶你走出虧損循環。
別再自己硬扛了,一個人走夜路很危險。我把最核心的進場點位、止損邏輯、主力判斷法都留著,真正想翻身、想穩定盈利的,跟上我的步伐。
查看原文今天我把壓箱底的主力收割套路直接攤開講,看懂這一套,你至少少虧 80%。
很多人進場全憑感覺,漲了就 FOMO 追高,跌了就恐慌割肉,明明每天盯盤十幾個小時,結果越做越虧,越虧越急,最後本金沒了,心態也崩了。
其實行情從來不是亂走的,每一根 K 線,都是莊家在給你下套。
我總結的爆莊三板斧,在圈子裡實戰驗證過無數次,專門對付主力洗盤、砸盤、誘多:
第一斧,誘多拉盤—— 突然爆拉製造熱度,讓你以為主升浪來了,等你衝進去,主力直接出貨。第二斧,恐慌砸盤—— 跌破關鍵位,逼你止損割肉,把不堅定的籌碼全部洗出去。第三斧,反手拉升—— 把散戶洗乾淨後,直接暴力拉升,你剛割完它就飛,氣到拍斷大腿。
不是運氣,是懂節奏、懂結構、懂主力心思。
你一個人瞎琢磨,再研究三年也趕不上一個成熟團隊的判斷。你缺的不是勇氣,是真正能帶你看清方向、避開陷阱、踩準拐點的人。
我能把一個虧麻的粉絲,用策略、方法、執行力帶翻盤,就有能力帶你走出虧損循環。
別再自己硬扛了,一個人走夜路很危險。我把最核心的進場點位、止損邏輯、主力判斷法都留著,真正想翻身、想穩定盈利的,跟上我的步伐。
- 讚賞
- 2
- 留言
- 轉發
- 分享
不得不佩服,中国的战略眼光,还是很敏锐的。 中东一打仗,石油就緊張,價格跟著往上飆。 別的國家都在慌,咱們早就提前做好了準備。 我們國家石油大多靠進口,一半多都來自中東。 那邊一亂,我們的用油安全就受影響。 別人一卡脖子,工業、出行、生活成本都會漲。 所以國家早早就布局。
查看原文- 讚賞
- 按讚
- 留言
- 轉發
- 分享
不得不佩服,中国的战略眼光,还是很敏锐的。
中东一打仗,石油就緊張,價格跟著往上飆。
別的國家都在慌,咱們早就提前做好了準備。
我們國家石油大多靠進口,一半多都來自中東。
那邊一亂,我們的用油安全就受影響。
別人一卡脖子,工業、出行、生活成本都會漲。
所以國家早早就布局。
大力發展風電、太陽能、核電。
還全力推廣新能源汽車。
有網友說,目的很簡單,就是少用石油,不被別人牽著走。
現在油價再亂,我們也能扛得住,影響小很多。
筆者認為,大家買車優先選電車,也是幫國家減輕壓力。
能源安全,就是國家最大的底氣。
眼光放長遠,提前布局,才能穩穩當當不受欺負。
查看原文中东一打仗,石油就緊張,價格跟著往上飆。
別的國家都在慌,咱們早就提前做好了準備。
我們國家石油大多靠進口,一半多都來自中東。
那邊一亂,我們的用油安全就受影響。
別人一卡脖子,工業、出行、生活成本都會漲。
所以國家早早就布局。
大力發展風電、太陽能、核電。
還全力推廣新能源汽車。
有網友說,目的很簡單,就是少用石油,不被別人牽著走。
現在油價再亂,我們也能扛得住,影響小很多。
筆者認為,大家買車優先選電車,也是幫國家減輕壓力。
能源安全,就是國家最大的底氣。
眼光放長遠,提前布局,才能穩穩當當不受欺負。
- 讚賞
- 按讚
- 留言
- 轉發
- 分享
黃金真變態啊,都漲到5400了?美股盤前大跌2%!比特幣能否幸免?華爾街晚上即將開盤,咱們來看下。 1. 大炮一響,黃金萬兩,金價漲得非常急,不過有一點大家要注意,戰爭有開始就必有結束,而且可能會隨時結束,屆時金價會大跌。所以有做多黃金的可以考慮逢高離場,畢竟它距離前高阻力也很近了。 2.
BTC-0.04%
- 讚賞
- 按讚
- 留言
- 轉發
- 分享
最近行情跟坐過山車似的,來回洗盤、瘋狂插針!不少人慌了神,跑來問我:“這破行情,还能玩吗?” 前兒個一新手兄弟,揣著1200U找我聊到半夜,翻來覆去就一句:“不重倉,咋在幣圈撈錢? 我直接甩他一句大實話:多數人栽跟頭,不是行情太狠,是自己太猴急!
查看原文- 讚賞
- 2
- 留言
- 轉發
- 分享
最近行情跟坐過山車似的,來回洗盤、瘋狂插針!不少人慌了神,跑來問我:“這破行情,还能玩吗?”
前幾天一新手兄弟,揣著1200U找我聊到半夜,翻來覆去就一句:“不重倉,咋在幣圈撈錢?
我直接甩他一句大實話:多數人栽跟頭,不是行情太狠,是自己太猴急!
接下來20多天,我們穩得一批!看不懂的行情,直接空倉;看明白的,才輕倉出手。賺點小錢就跑,絕不貪杯!
前半段帳戶跟蝸牛爬似的,無聊透頂,但正是這“無聊”,讓我們躲過了無數大坑!
最近節奏順了,利潤跟叠羅漢似的,一段接一段往上漲!沒爆拉,沒神單,全是能複製的穩穩行情!
昨天他給我發帳戶截圖,好家伙,都快飆到9千U了!
我直接跟他說:這哪是運氣好,是你這20多天沒瞎搞!
穩健盈利的祕訣,不是死腦筋硬扛,而是能忍住手,不做那些必虧的單子!
市場機會多的是,缺的是能把小錢慢慢滾成大錢的耐心!
你現在走得慢?別慌!慢,才是通向暴富的最快路!
查看原文前幾天一新手兄弟,揣著1200U找我聊到半夜,翻來覆去就一句:“不重倉,咋在幣圈撈錢?
我直接甩他一句大實話:多數人栽跟頭,不是行情太狠,是自己太猴急!
接下來20多天,我們穩得一批!看不懂的行情,直接空倉;看明白的,才輕倉出手。賺點小錢就跑,絕不貪杯!
前半段帳戶跟蝸牛爬似的,無聊透頂,但正是這“無聊”,讓我們躲過了無數大坑!
最近節奏順了,利潤跟叠羅漢似的,一段接一段往上漲!沒爆拉,沒神單,全是能複製的穩穩行情!
昨天他給我發帳戶截圖,好家伙,都快飆到9千U了!
我直接跟他說:這哪是運氣好,是你這20多天沒瞎搞!
穩健盈利的祕訣,不是死腦筋硬扛,而是能忍住手,不做那些必虧的單子!
市場機會多的是,缺的是能把小錢慢慢滾成大錢的耐心!
你現在走得慢?別慌!慢,才是通向暴富的最快路!
- 讚賞
- 按讚
- 留言
- 轉發
- 分享
熱門話題
查看更多1663.82萬 熱度
39.4萬 熱度
2.68萬 熱度
341.79萬 熱度
43.29萬 熱度
置頂
Gate Booster 第 4 期:發帖瓜分 1,500 $USDT
🔹 發布 TradFi 黃金福袋原創內容,可得 15 $USDT,名額有限先到先得
🔹 本期支持 X、YouTube 發布原創內容
🔹 無需複雜操作,流程清晰透明
🔹 流程:申請成為 Booster → 領取任務 → 發布原創內容 → 回鏈登記 → 等待審核及發獎
📅 任務截止時間:03月20日16:00(UTC+8)
立即領取任務:https://www.gate.com/booster/10028?pid=allPort&ch=KTag1BmC
更多詳情:https://www.gate.com/announcements/article/50203🤖 尋找 Gate 廣場 AI 評測官!$50,000 懸賞令發布!
發帖聊 AI,獎金拿到手軟!新人首帖獎勵翻倍,單帖最高 200U!
📝 立即報名:https://www.gate.com/questionnaire/7477
1️⃣ 發帖得紅包,單帖最高 100U!
2️⃣ Top 體驗分享官:帶 #Gate广场AI测评官 聊技巧,贏國米球衣!
3️⃣ 收益率 PK 王:曬 AI 收益截圖,贏 Gate 定制運動套裝!
4️⃣ 深度好文額外加碼 30U 每篇張榜公布!
💬 來 Gate 廣場,把握行業新趨勢:https://www.gate.com/post
時間:3/12 18:00 – 3/27 24:00 (UTC+8)
詳情:https://www.gate.com/announcements/article/50206Gate 廣場內容挖礦獎勵繼續升級!無論您是創作者還是用戶,挖礦新人還是頭部作者都能贏取好禮獲得大獎。現在就進入廣場探索吧!
創作者享受最高60%創作返佣
創作者獎勵加碼1500USDT:更多新人作者能瓜分獎池!
觀眾點擊交易組件交易贏大禮!最高50GT等新春壕禮等你拿!
詳情:https://www.gate.com/announcements/article/49802