Bears have remained dominant, as seen from the global market cap, which has dropped by 0.04% from its previous 24-hour one, as the total cap stood at $1.68T as of press time. The fear and greed index is 59, indicating that the overall cryptocurrency market, including Kibho cryptocurrency, remains in a state of neutrality.
Bitcoin Price Analysis
Bitcoin (BTC), the crypto king, has shown some small bull resilience today as the Bitcoin price stood at $42.7K as of press time, representing a 0.16% pump in the last 24 hours to bring the weekly drop to 8.6%. Bitcoin’s trading volume has jumped by 3% over the same period to stand at $20.6B.
The future price trajectory for Bitcoin now looks bullish, as an in-depth analysis of 24-hour BTC/USD charts reveals. The Relative Strength Index indicator moves north as it approaches 50, showing bull action on BTC. The MACD indicator, on the other hand, has flattened its downward trajectory, showing a failing bearish momentum as it now looks to revert toward the green zone.
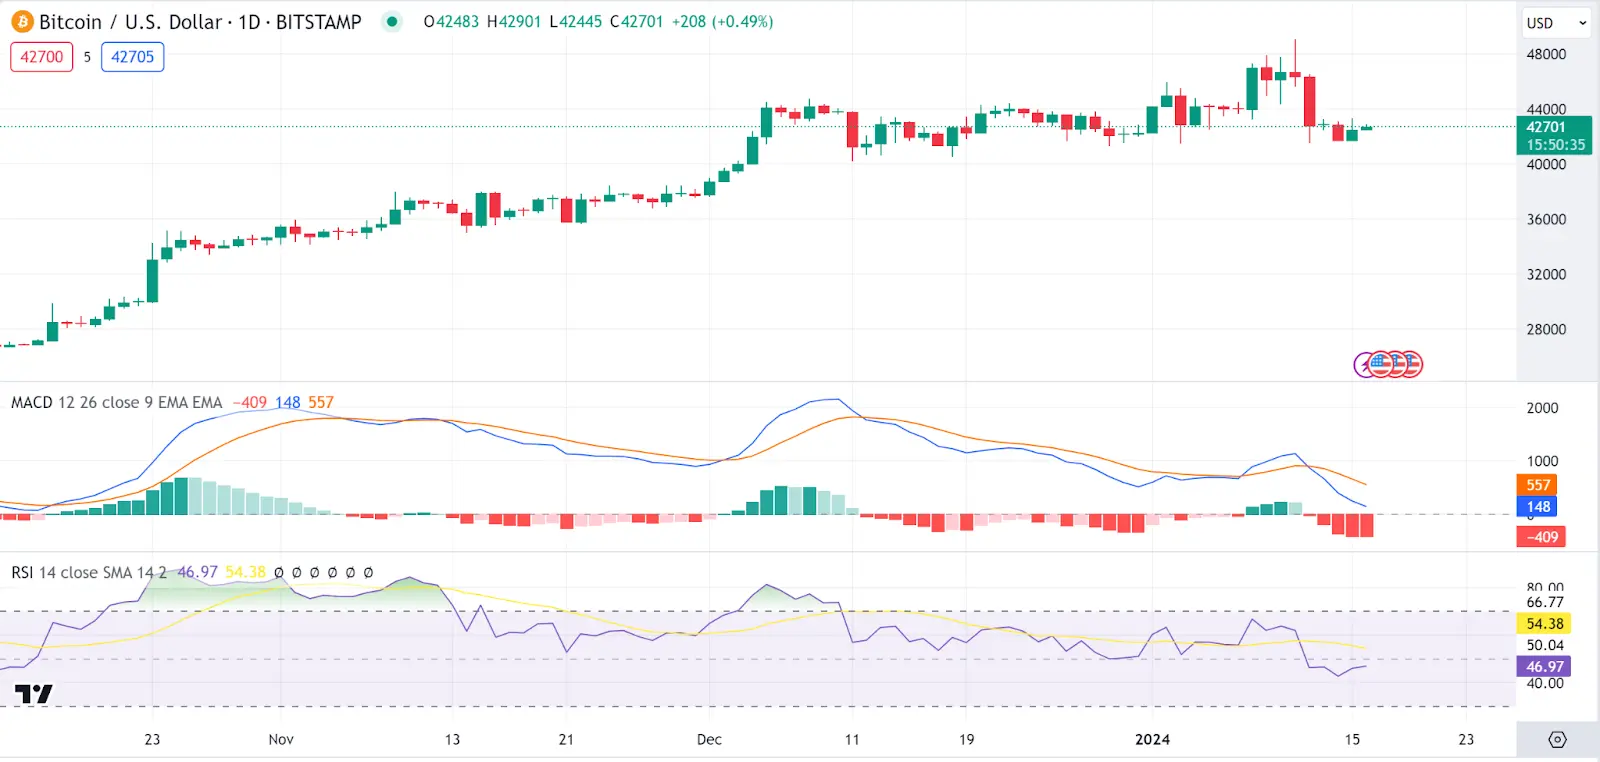 BTC 1-day chart | Source: TradingView## Ethereum Price Analysis
Ethereum (ETH) has also posted minor gains today as the Ethereum price stood at $2524 as of press time, representing a 0.6% increase in the last 24 hours as the weekly rise stood at 9.5%. The trading volume has dropped by 13% to $8.6B.
An in-depth analysis of the ETH/USD charts also shows uncertainty on ETH, as bulls and bears still struggle for dominance. This is shown by the Relative Strength Index indicator, which is currently on a northern trajectory as it approaches the overbought region, showing bull pressure on the Ethereum price. On the other hand, the MACD indicator is reverting toward the red zone, showing bearish prospects for ETH as well.
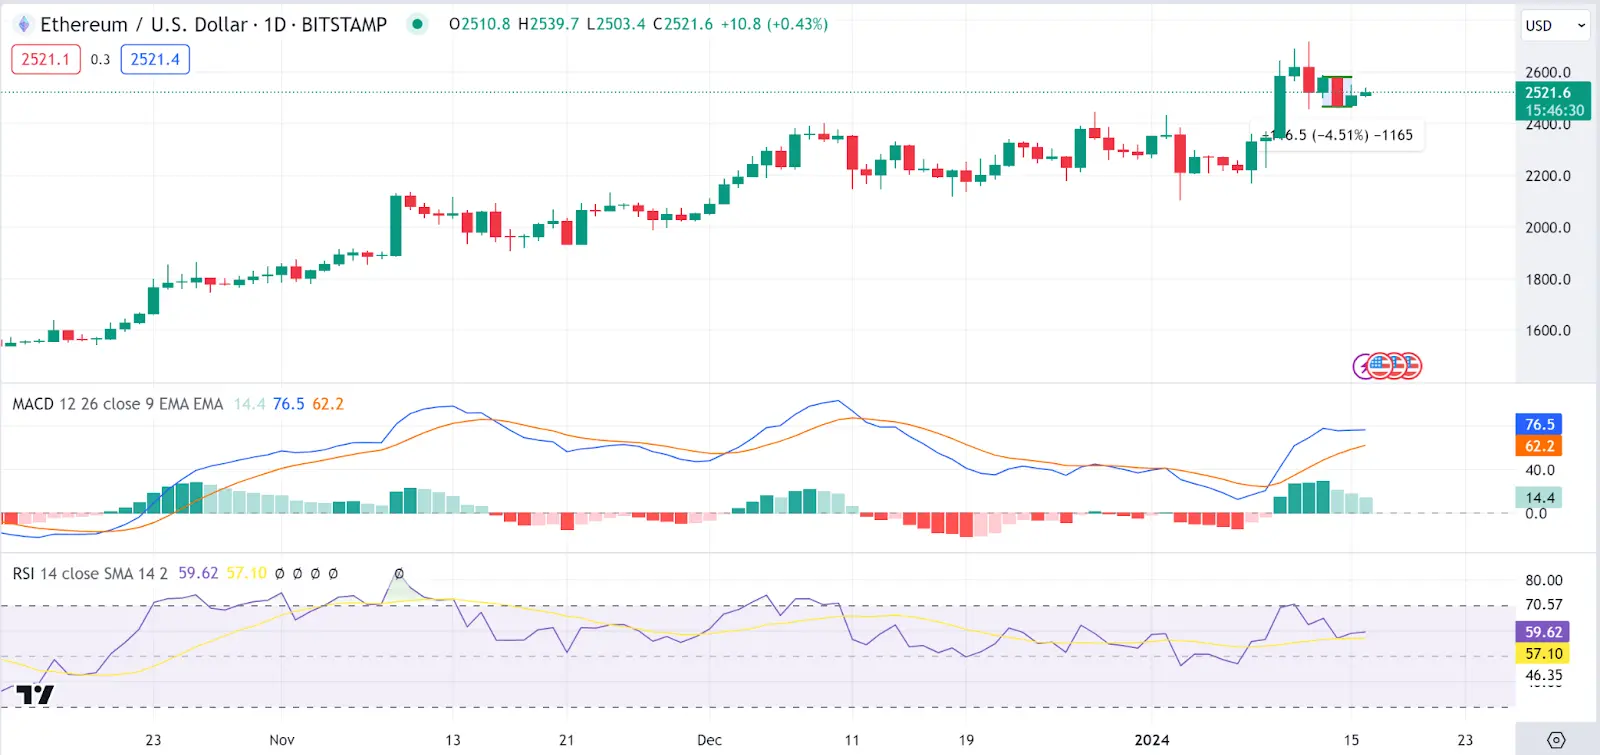 ETH 1-day chart | Source: TradingView## Enjin Price Analysis
Enjin (ENJ) has not made it to the gainer’s list today as the Enjin price stood at $0.306 as of press time, representing a 0.25% decrease in the last 24 hours as the weekly drop stood at 1.1%. The trading volume has increased by a mild 1% to $15.5M.
An in-depth analysis of the ENJ/USDT charts shows bullish prospects for ENJ, as shown by the Relative Strength Index indicator, which is currently on a northern trajectory as it approaches 50, showing bull pressure on the Enjin price. On the other hand, the MACD indicator is reverting toward the green zone, backing the bullish prospects for ENJ.
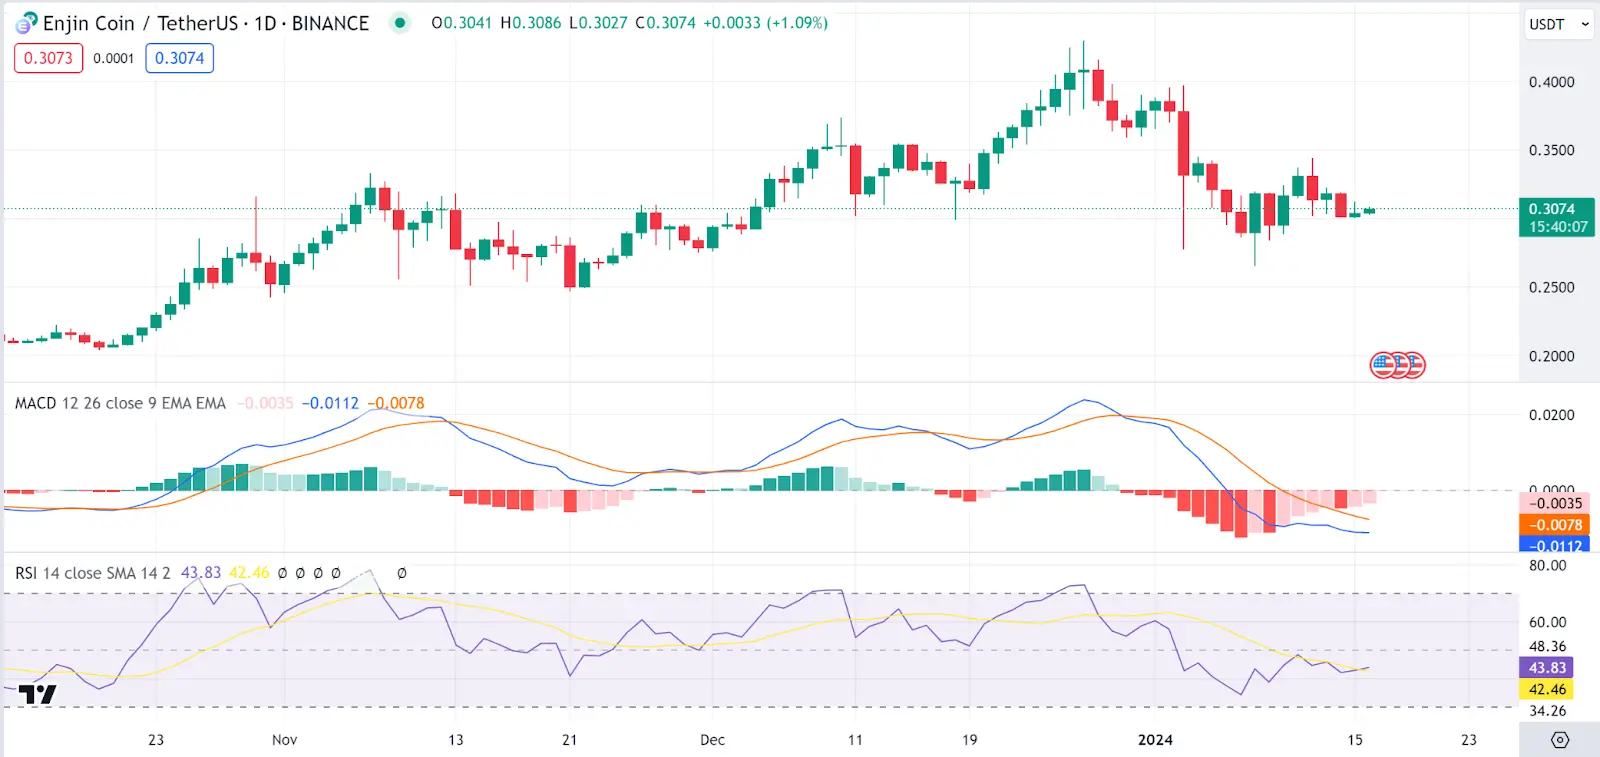 ENJ 1-day chart | Source: TradingView## HEX Price Analysis
HEX (HEX) is our first gainer today, as the HEX price stood at $0.0103 as of press time, representing a 5.9% increase in the last 24 hours as the weekly rise stood at 79.5%. The trading volume has increased by a mild 79.5% to $2.5M.
An in-depth analysis of the HEX/USDT charts shows the possibility of a correction in the short term on the HEX price, as shown by the Relative Strength Index indicator, which is currently overbought. With this in mind, holders might seek to sell to capitalize on profits made, which might cause selling pressure. On the other hand, the MACD indicator is reverting toward the red zone, backing the bearish prospects for HEX.
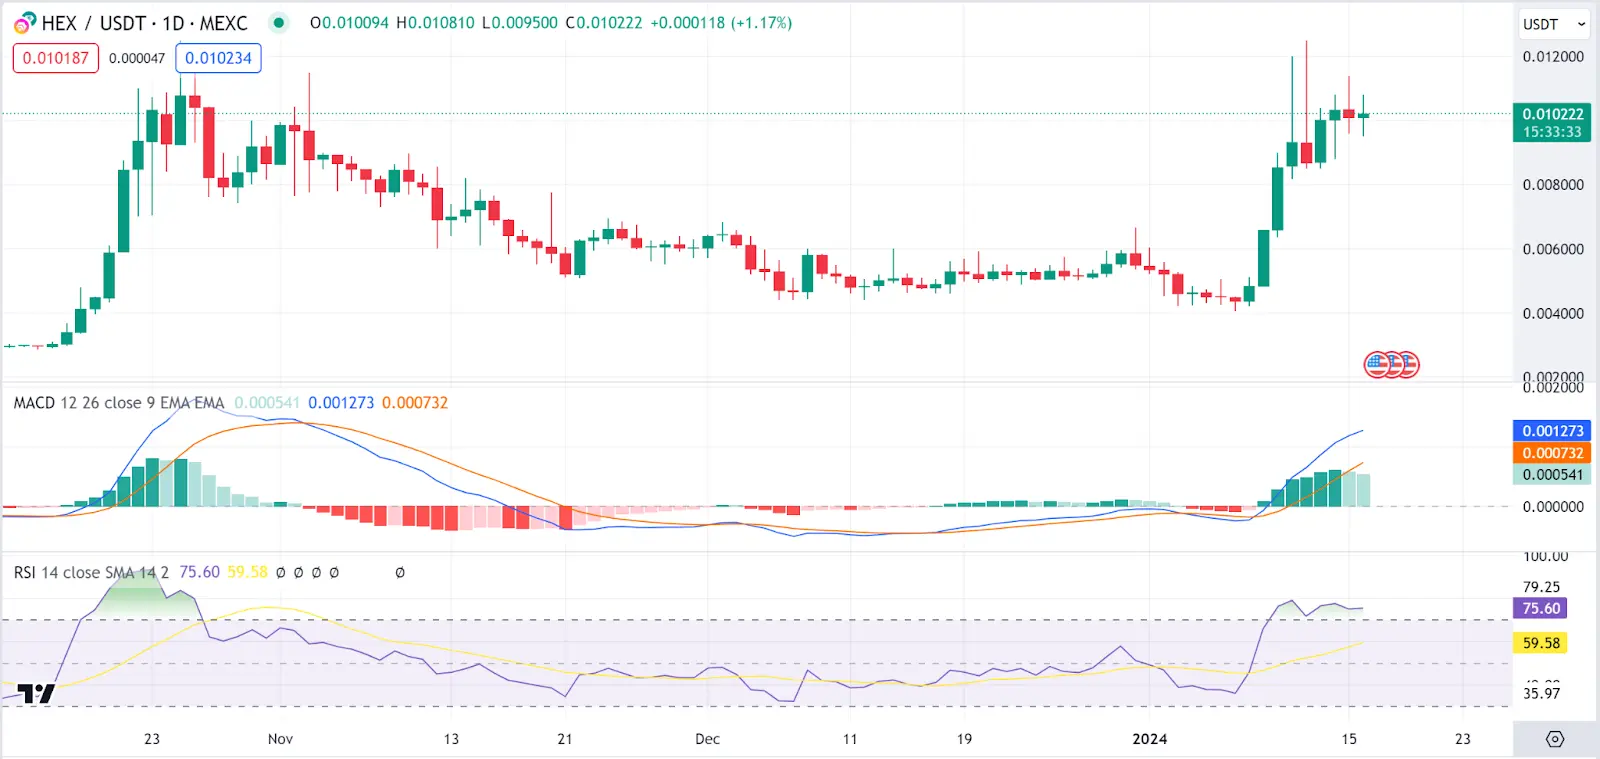 HEX 1-day chart | Source: TradingView## Zcash Price Analysis
Zcash (ZEC) is another gainer today as the Zcash price stood at $23.4 as of press time, representing a 1.8% increase in the last 24 hours as the weekly drop stood at 11%. The trading volume has increased by 13% to $67.5M.
An in-depth analysis of the ZEC/USDT charts shows uncertainty as well on ZEC, as bulls and bears still struggle for dominance. This is shown by the Relative Strength Index indicator, which is currently on a southern trajectory as it approaches the overbought region, showing bear action on the Zcash price. On the other hand, the MACD indicator is reverting toward the green zone, showing bullish prospects for ETH as well.
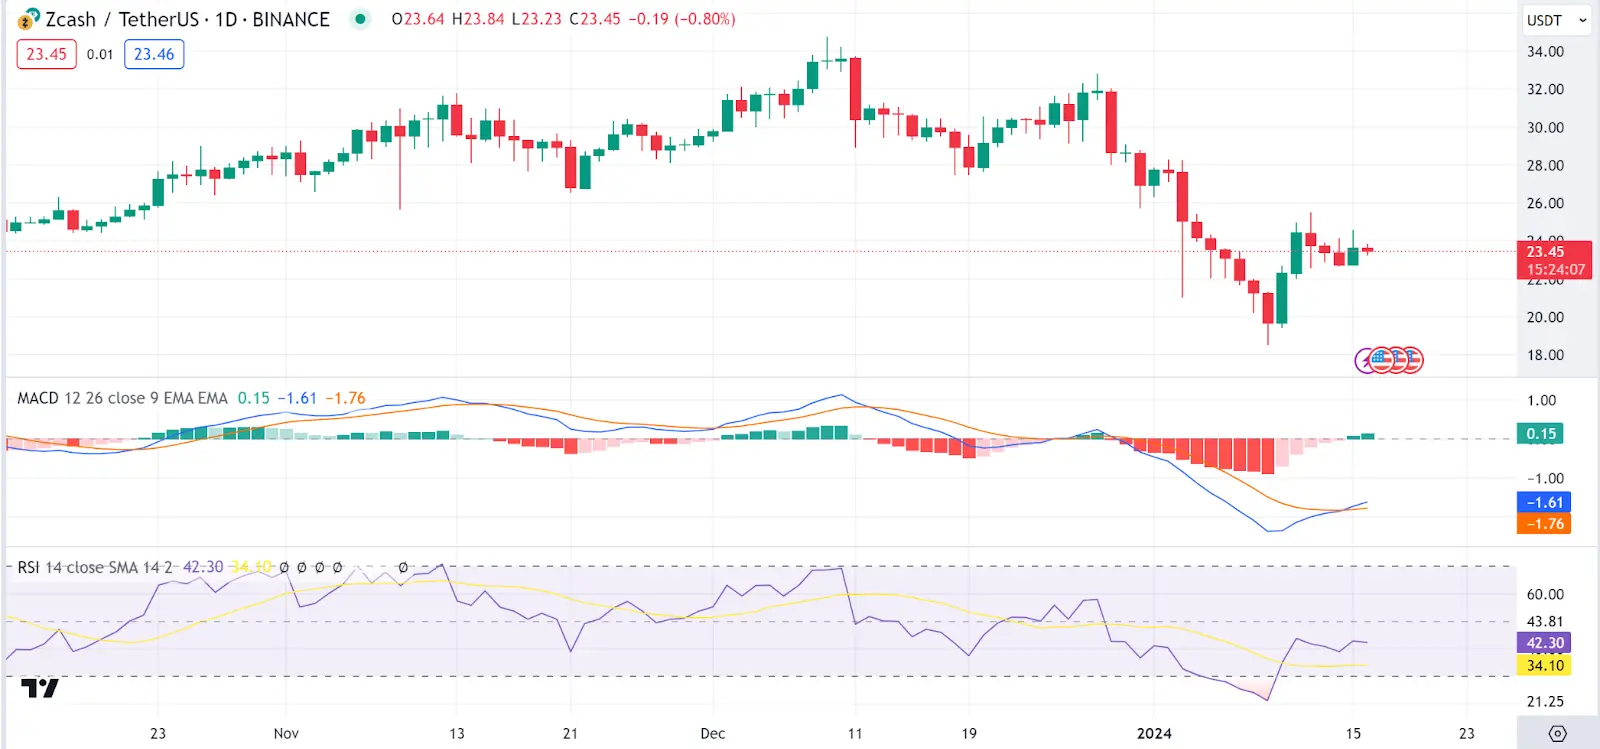 ZEC 1-day chart | Source: TradingViewThis report delves into the current trends and future prospects of these digital assets, including a look at Hex Coin Price, Enjin Coin Price Prediction, and Zcash Price Prediction.
Isenção de responsabilidade: As informações contidas nesta página podem ser provenientes de terceiros e não representam os pontos de vista ou opiniões da Gate. O conteúdo apresentado nesta página é apenas para referência e não constitui qualquer aconselhamento financeiro, de investimento ou jurídico. A Gate não garante a exatidão ou o carácter exaustivo das informações e não poderá ser responsabilizada por quaisquer perdas resultantes da utilização destas informações. Os investimentos em ativos virtuais implicam riscos elevados e estão sujeitos a uma volatilidade de preços significativa. Pode perder todo o seu capital investido. Compreenda plenamente os riscos relevantes e tome decisões prudentes com base na sua própria situação financeira e tolerância ao risco. Para mais informações, consulte a
Isenção de responsabilidade.
