Bulls still have mild control of markets with the global market cap recording a jump of 0.3% from its previous 24-hour one, as the total cap stood at $1.76T as of press time. The fear and greed index is 73, as fear now creeps back into the markets
Bitcoin Price Analysis
Bitcoin (BTC) is facing corrections amid yesterday’s pump, as the Bitcoin price stood at $45.9K as of press time, representing 0.3% in the last 24 hours as the weekly rise stood at 4.7%. Bitcoin’s trading volume has dropped by 17% over the same period to $43M.
The future price trajectory for Bitcoin, however, looks bearish, as an in-depth analysis of 24-hour BTC/USD charts reveals. The Relative Strength Index indicator is moving south, showing mounting bear pressure on BTC. The MACD indicator, on the other hand, is moving in the red zone, showing bearish prospects for the Bitcoin price.
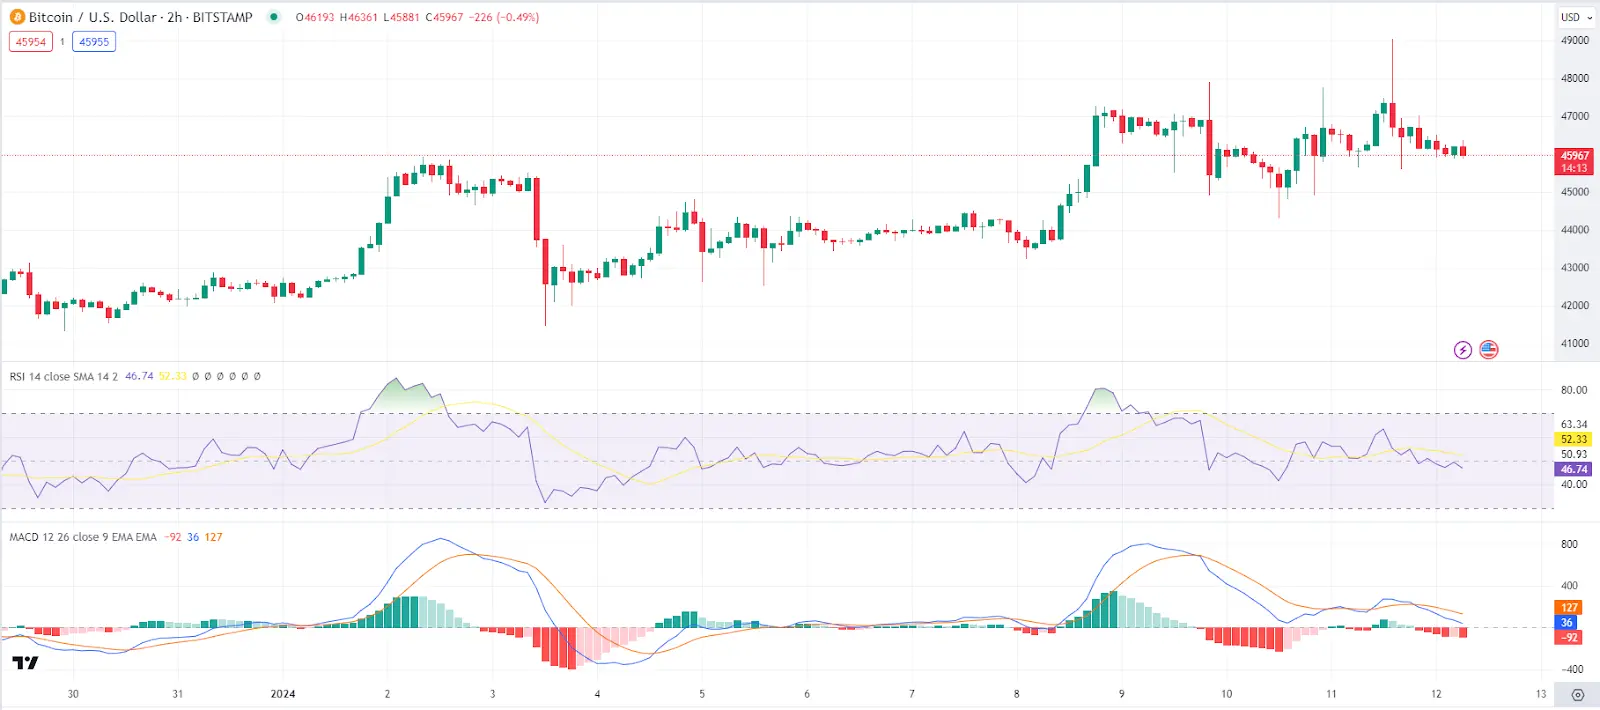 BTC 2-hour chart | Source: TradingView## Ethereum Price Analysis
Ethereum (ETH) has managed to holdon to yesterday’s bull run as the Ethereum price stood at $2599 as of press time, representing a 0.5% increase in the last 24 hours as the weekly rise stood at 15%. ETH’s trading volume has dropped by 37% to $19B.
An in-depth analysis of the ETH/USD charts shows that ETH bulls are in control, as shown by the Relative Strength Index indicator, which is currently on a southern trajectory as it approaches a shift below 50, showing selling pressure on the Ethereum price. At the same time, the MACD moves in the red zone, supporting the buearish prospects on the Ethereum price.
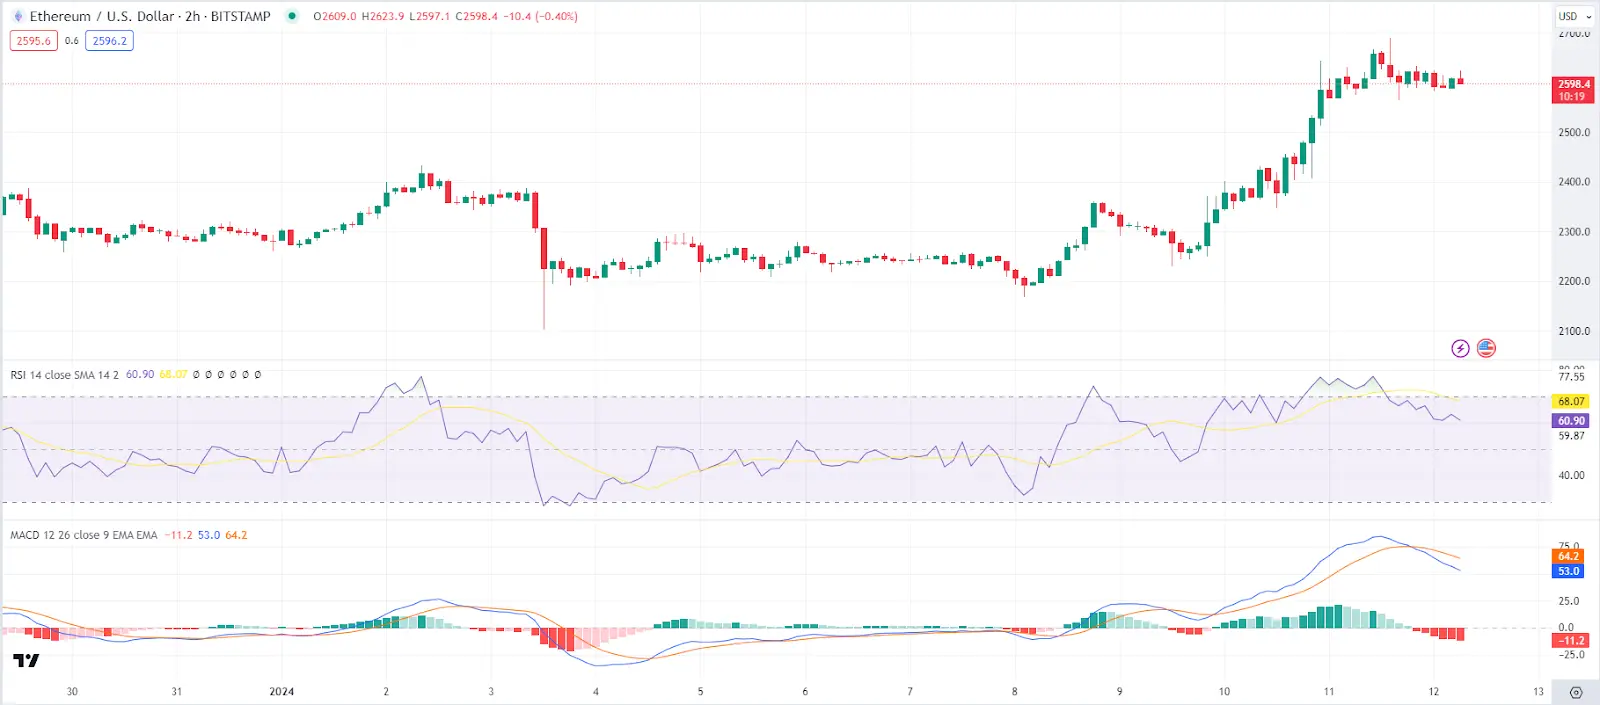 ETH 2-hour chart | Source: TradingView## Bitcoin Cash Price Analysis
Bitcoin Cash (BCH) is among the top gainers today as the Bitcoin Cash price stood at $289 as of press time, representing a 14.4% increase in the last 24 hours as the weekly rise stood at 23%. The trading volume has dropped by 37% to $19B.
An in-depth analysis of the BCH/USD charts shows that the Bitcoin Cash price is headed toward corrections as shown by the Relative Strength Index indicator, which is currently on a southern trajectory as it exits the overbought region, showing selling pressure on the Bitcoin Cash price. At the same time, the MACD indicator is reverting toward the red zone showing fading bullish pressure.
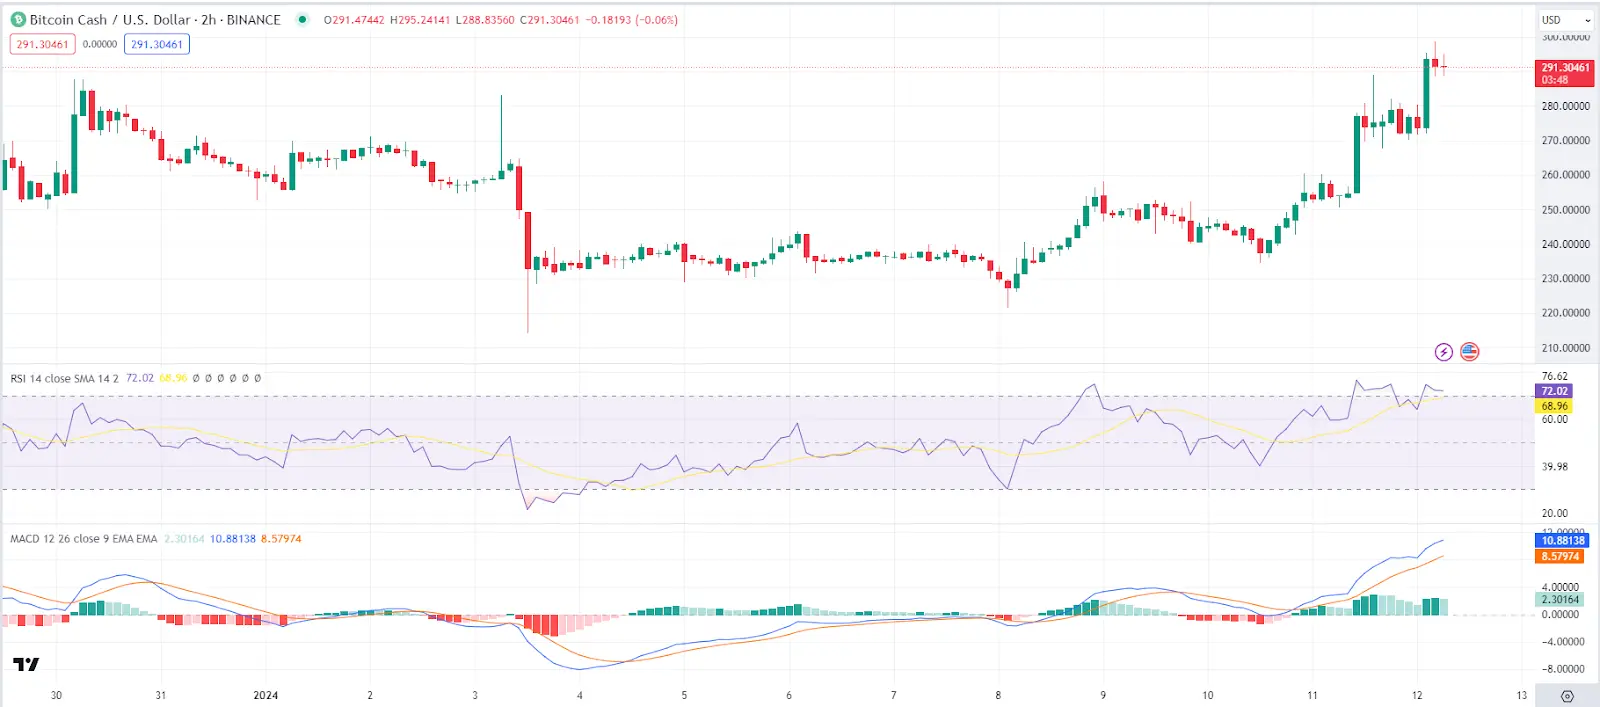 BCH2-hour chart | Source: TradingView## Ethereum Classic Price Analysis
Ethereum Classic (ETC) is another top gainer today as the Ethereum price stood at $29.53 as of press time, representing a 4.5% increase in the last 24 hours as the weekly rise stood at 47%. The trading volume has dropped by 21% to $2.2B.
An in-depth analysis of the 2-hour ETC/USD charts shows that the Ethereum price is headed towards corrections as shown by the Relative Strength Index indicator, which is currently on a southern trajectory as it exits the overbought region, showing selling pressure on the Ethereum Classic price. At the same time, the MACD indicator is moving in the red zone showing bear dominance on the Ethereum Classic price.
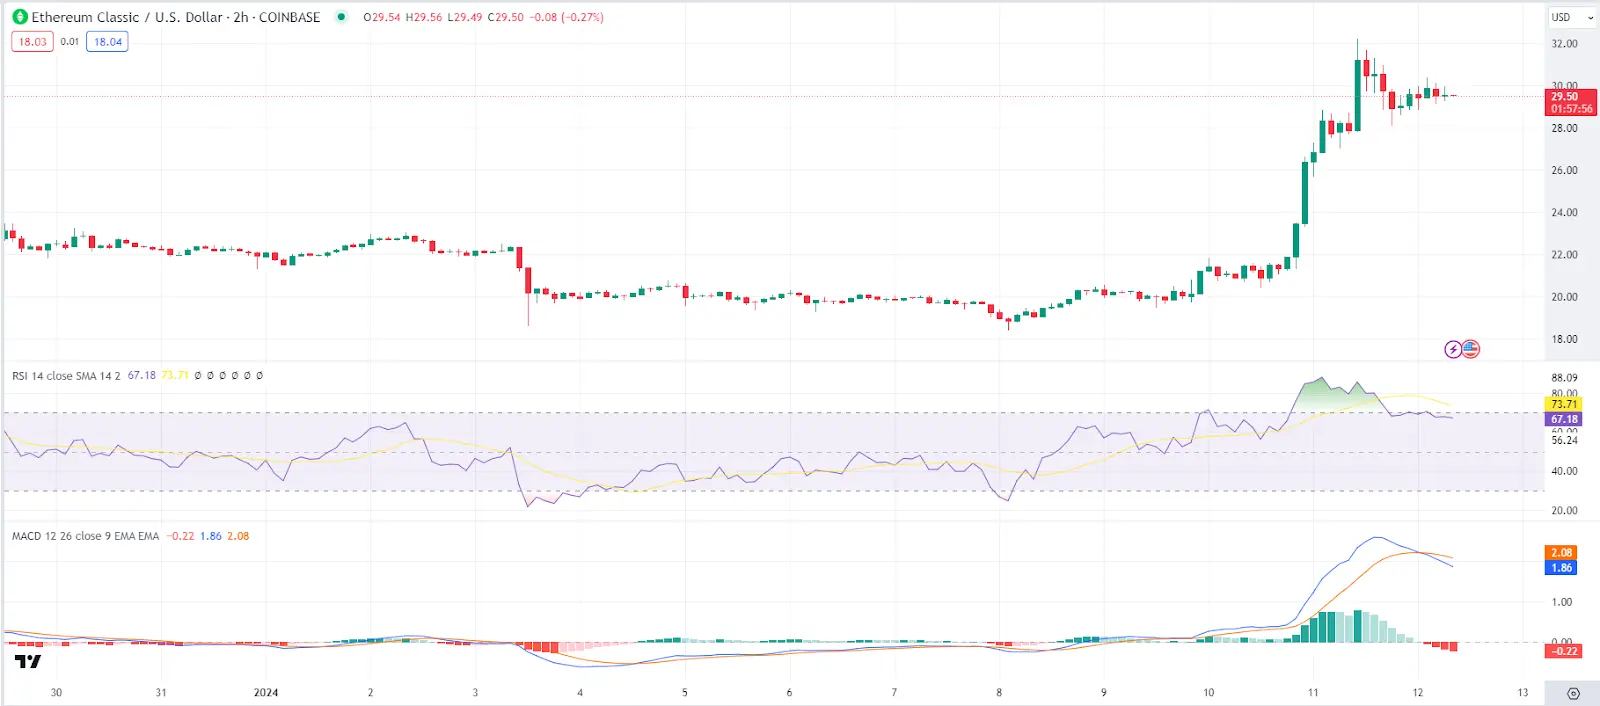 ECT 2-hour chart | Source: TradingView## FTX Token Price Analysis
FTX Token (FTT) is today’s top gainer today as the FTX Token price stood at $3.3 as of press time, representing a 21% increase in the last 24 hours to bring the weekly rise to 18%. The trading volume has jumped by 125% to $91M.
An in-depth analysis of the 2-hour FTX/USDT charts shows that the FTX Token price pump could be just the start the Relative Strength Index indicator, which is currently on a northern trajectory as it enters the overbought region, showing selling pressure on the FTX Token price. At the same time, the MACD indicator is moving in the green zone showing bull dominance on the FTX Token price.
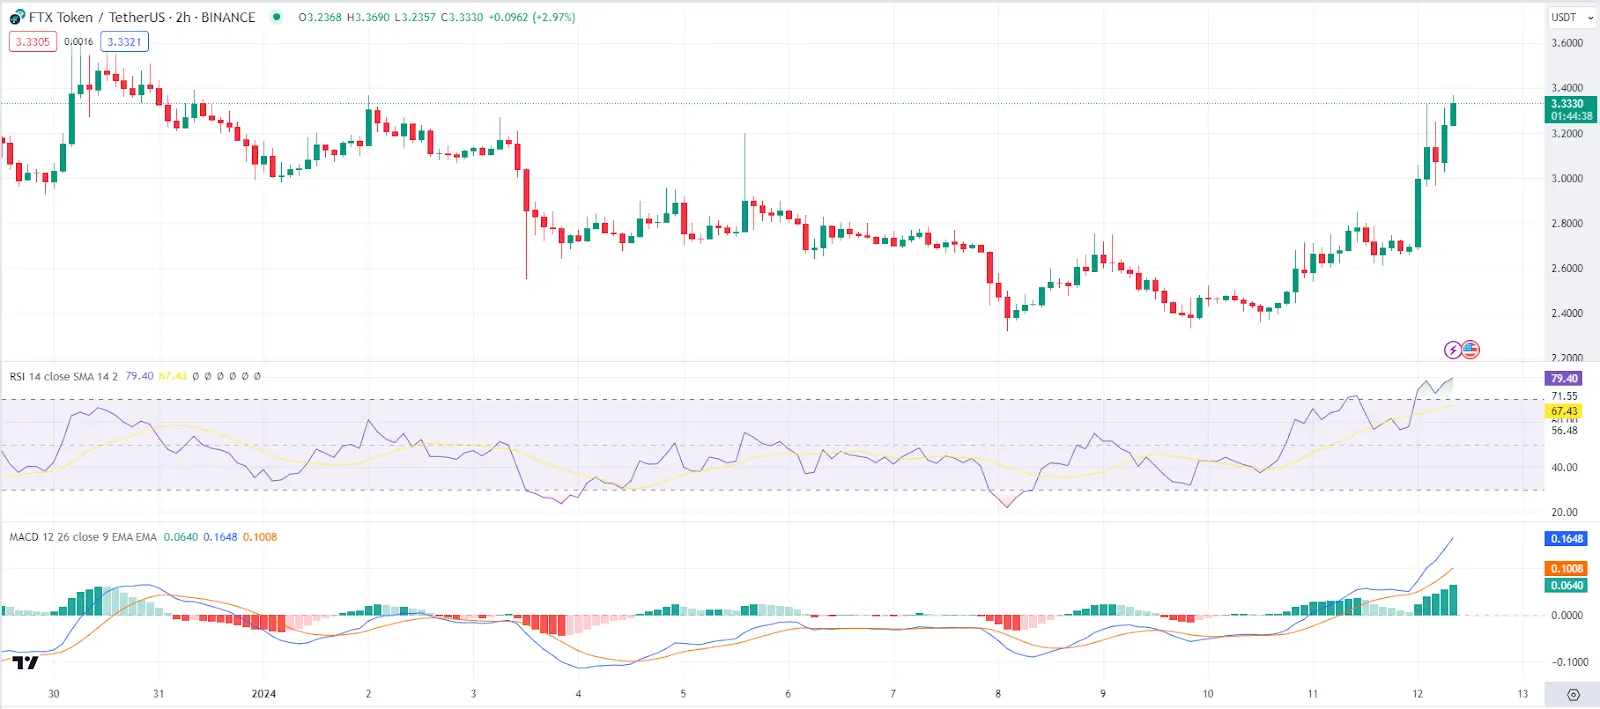 FTX 2-hour chart | Source: TradingView.
Isenção de responsabilidade: As informações contidas nesta página podem ser provenientes de terceiros e não representam os pontos de vista ou opiniões da Gate. O conteúdo apresentado nesta página é apenas para referência e não constitui qualquer aconselhamento financeiro, de investimento ou jurídico. A Gate não garante a exatidão ou o carácter exaustivo das informações e não poderá ser responsabilizada por quaisquer perdas resultantes da utilização destas informações. Os investimentos em ativos virtuais implicam riscos elevados e estão sujeitos a uma volatilidade de preços significativa. Pode perder todo o seu capital investido. Compreenda plenamente os riscos relevantes e tome decisões prudentes com base na sua própria situação financeira e tolerância ao risco. Para mais informações, consulte a
Isenção de responsabilidade.
