Bitcoin traded at $70,795 on March 14, 2026, with a market capitalization of $1.41 trillion and 24-hour trading volume of $49.48 billion. The cryptocurrency moved within an intraday range between $70,416 and $73,838 while technical indicators across major timeframes reflected a neutral market structure.
Bitcoin Chart Outlook
On the daily chart, bitcoin continues to trade inside a consolidation range following a rejection near the $74,000 resistance zone. Current price levels around $70,467 on Bitstamp place the asset in the middle of a broader visible trading band between approximately $63,000 and $77,500.
Market structure reflects sideways movement with declining volatility after the rejection near recent highs. Key resistance remains between $73,800 and $74,000, while mid-range resistance sits near $71,200. Support is identified around $69,500, with stronger structural support near $66,000. As long as the price remains above the $69,500 level, the broader bias remains neutral to slightly upward within the existing range.
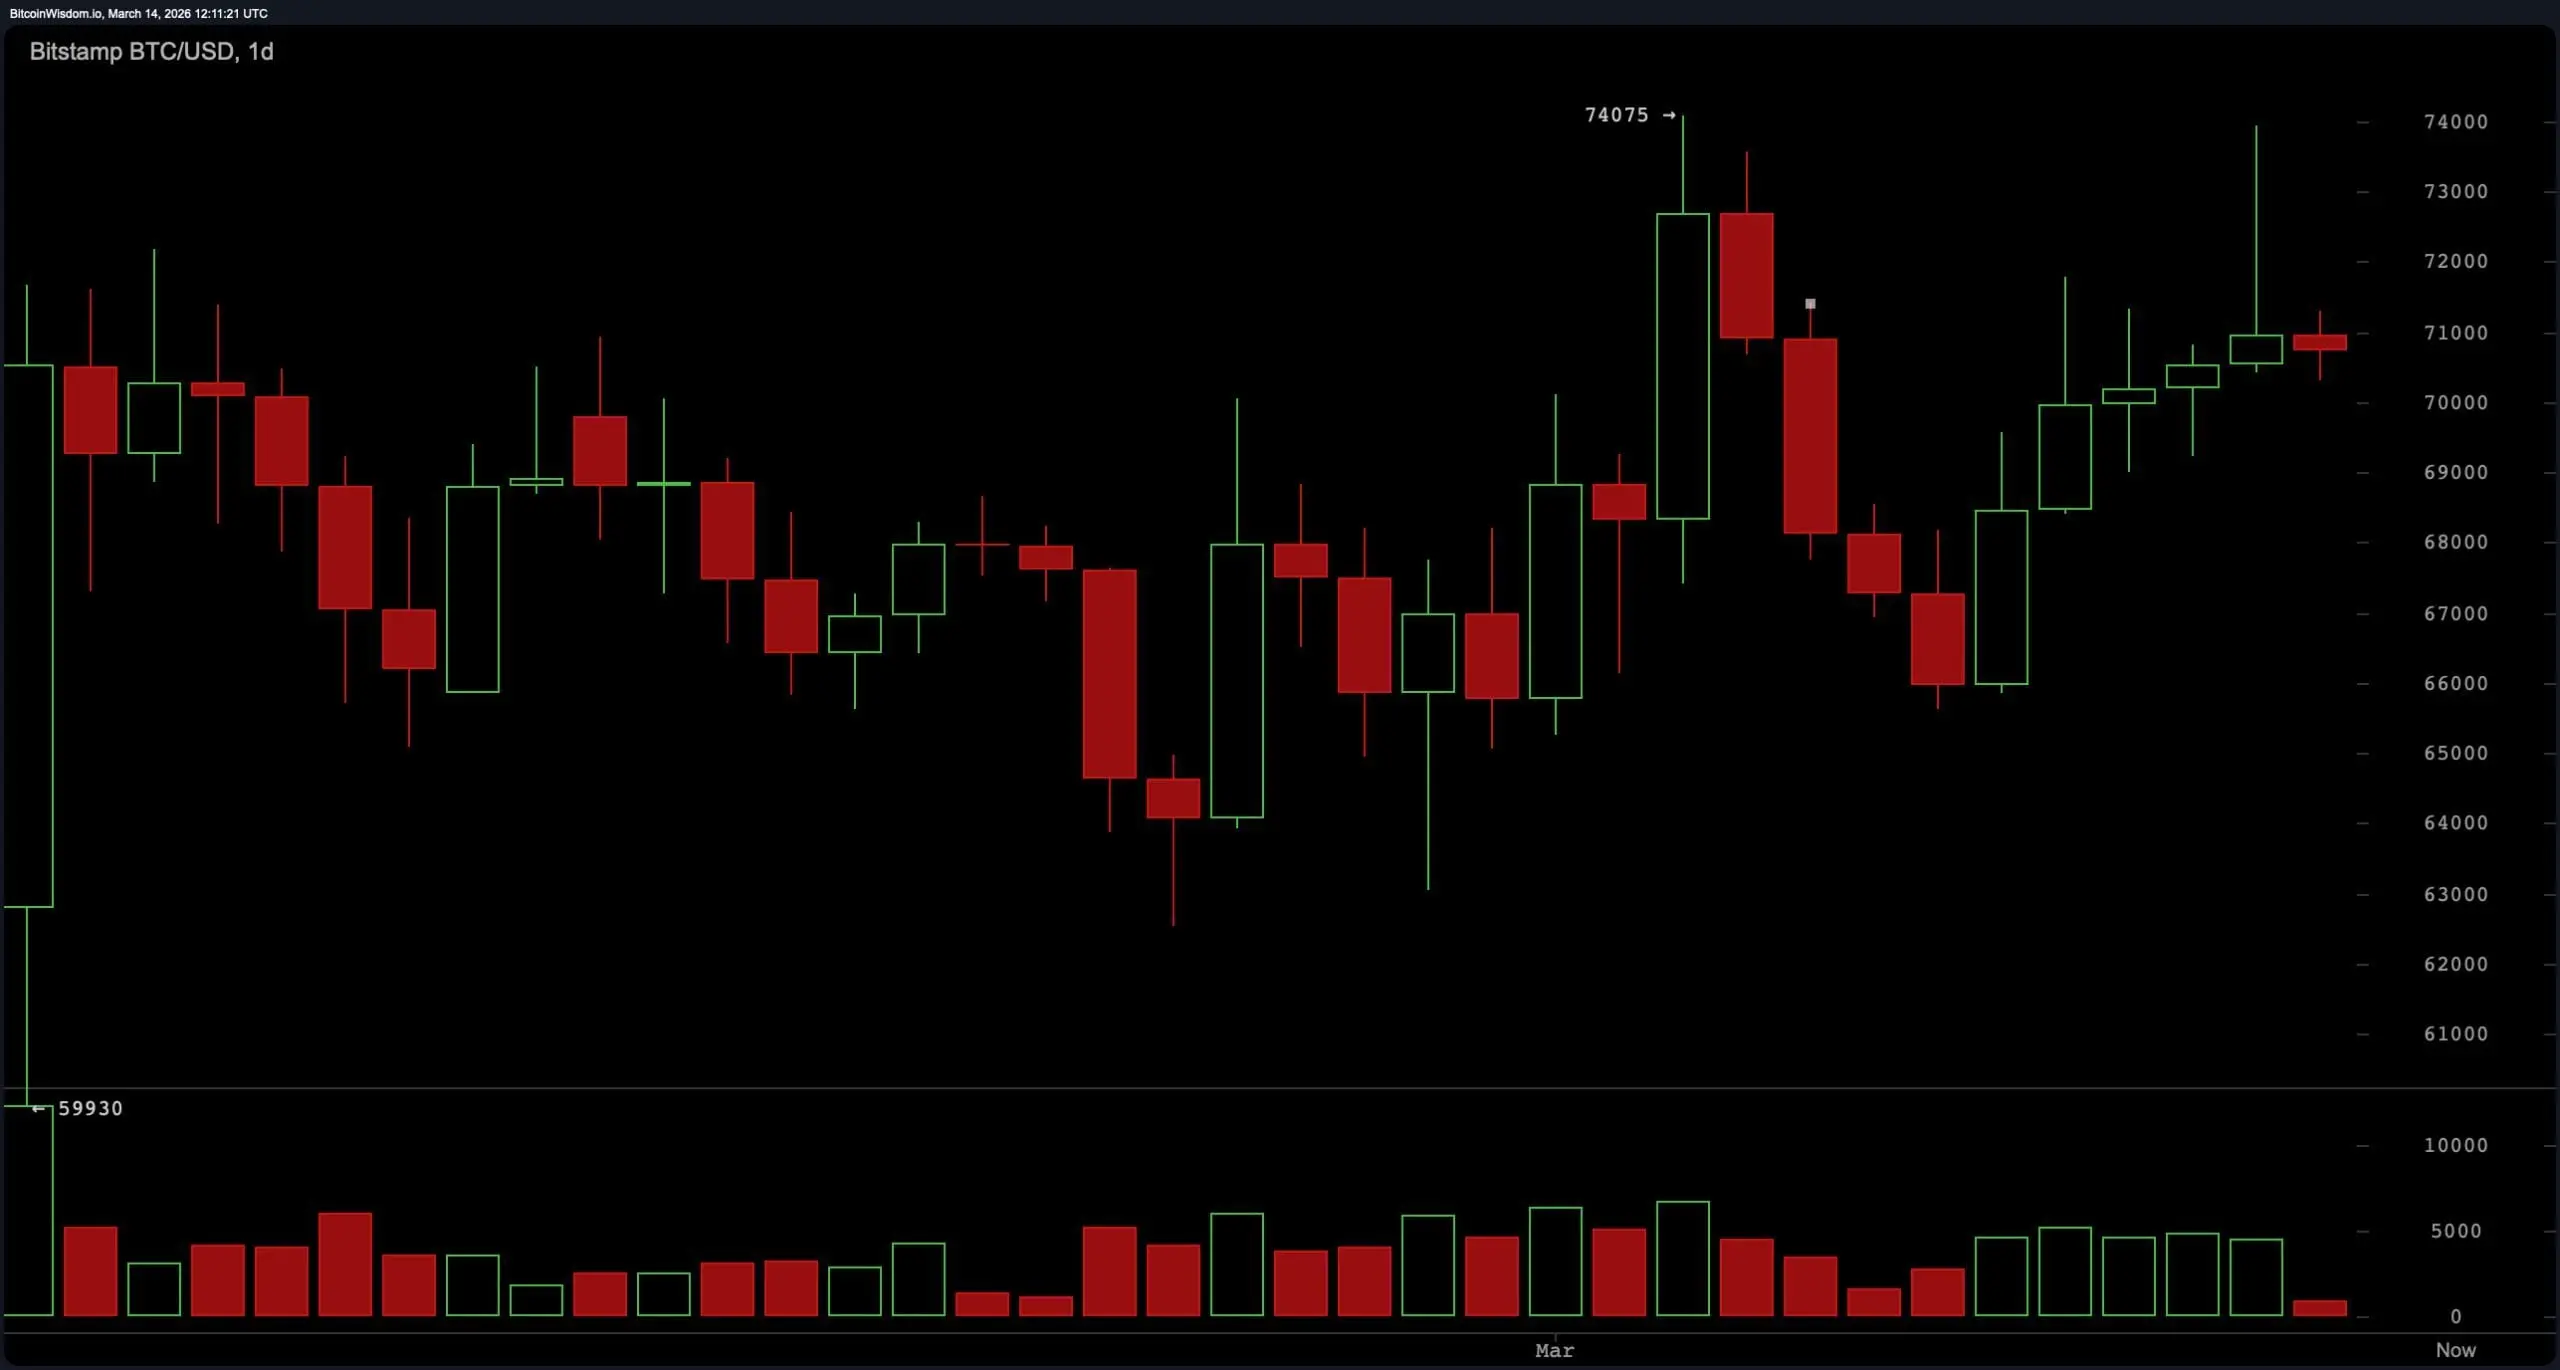 BTC/USD 1-day chart via Bitstamp on March 14, 2026.
The four-hour bitcoin chart shows continued sideways consolidation supported by a sequence of higher lows. Previous swing levels progressed from approximately $65,600 to $69,000 and then to near $70,000, suggesting gradual upward pressure beneath resistance. Price has repeatedly encountered resistance between $71,500 and $72,000, creating a compression pattern as volatility narrows. This type of price structure often precedes expansion once resistance or support is decisively breached. The current compression below resistance indicates that a move beyond this zone could determine the next directional move of roughly $3,000 to $5,000.
BTC/USD 1-day chart via Bitstamp on March 14, 2026.
The four-hour bitcoin chart shows continued sideways consolidation supported by a sequence of higher lows. Previous swing levels progressed from approximately $65,600 to $69,000 and then to near $70,000, suggesting gradual upward pressure beneath resistance. Price has repeatedly encountered resistance between $71,500 and $72,000, creating a compression pattern as volatility narrows. This type of price structure often precedes expansion once resistance or support is decisively breached. The current compression below resistance indicates that a move beyond this zone could determine the next directional move of roughly $3,000 to $5,000.
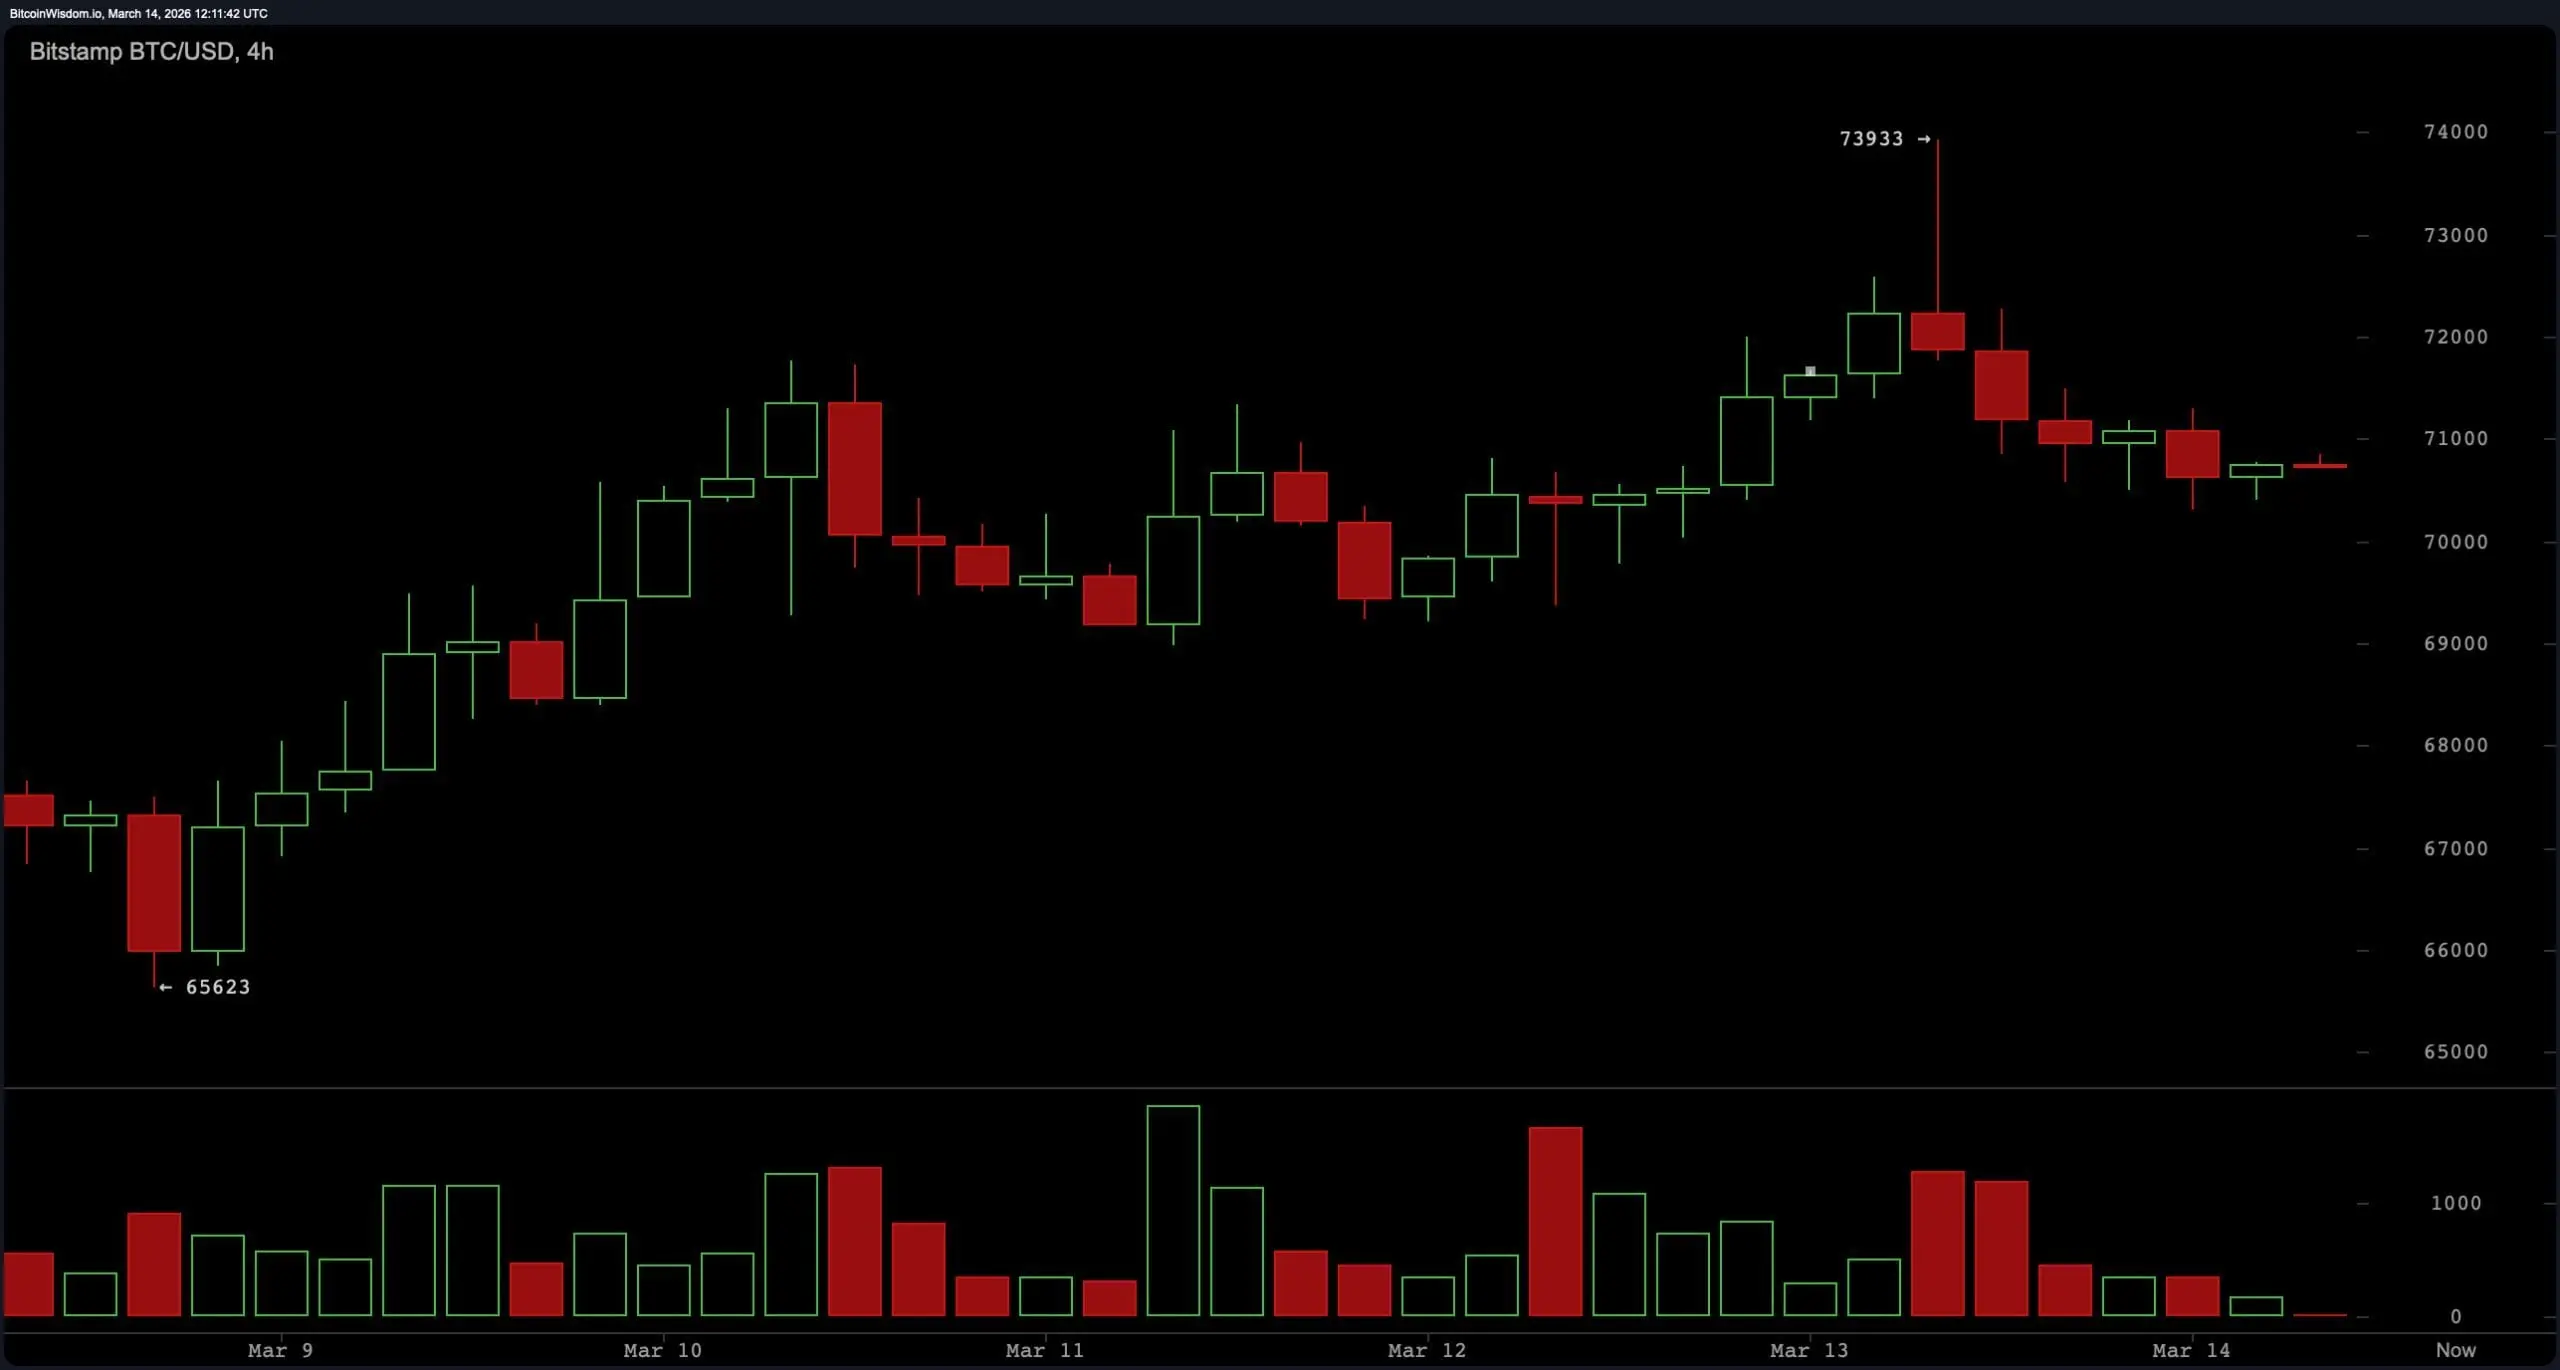 BTC/USD 4-hour chart via Bitstamp on March 14, 2026.
On the one-hour chart, bitcoin is trading within a tight intraday range between $70,300 support and approximately $71,100 resistance. Price movement has remained contained inside this narrow band while trading volume gradually declines, reflecting short-term equilibrium between buyers and sellers. Intraday consolidation within this range suggests the market is awaiting a catalyst for a breakout. Sustained movement above the $71,200 level would place the price near the upper resistance band around $72,800 and $74,000, while a breakdown below $69,500 would expose lower support areas near $67,800 and $66,000.
BTC/USD 4-hour chart via Bitstamp on March 14, 2026.
On the one-hour chart, bitcoin is trading within a tight intraday range between $70,300 support and approximately $71,100 resistance. Price movement has remained contained inside this narrow band while trading volume gradually declines, reflecting short-term equilibrium between buyers and sellers. Intraday consolidation within this range suggests the market is awaiting a catalyst for a breakout. Sustained movement above the $71,200 level would place the price near the upper resistance band around $72,800 and $74,000, while a breakdown below $69,500 would expose lower support areas near $67,800 and $66,000.
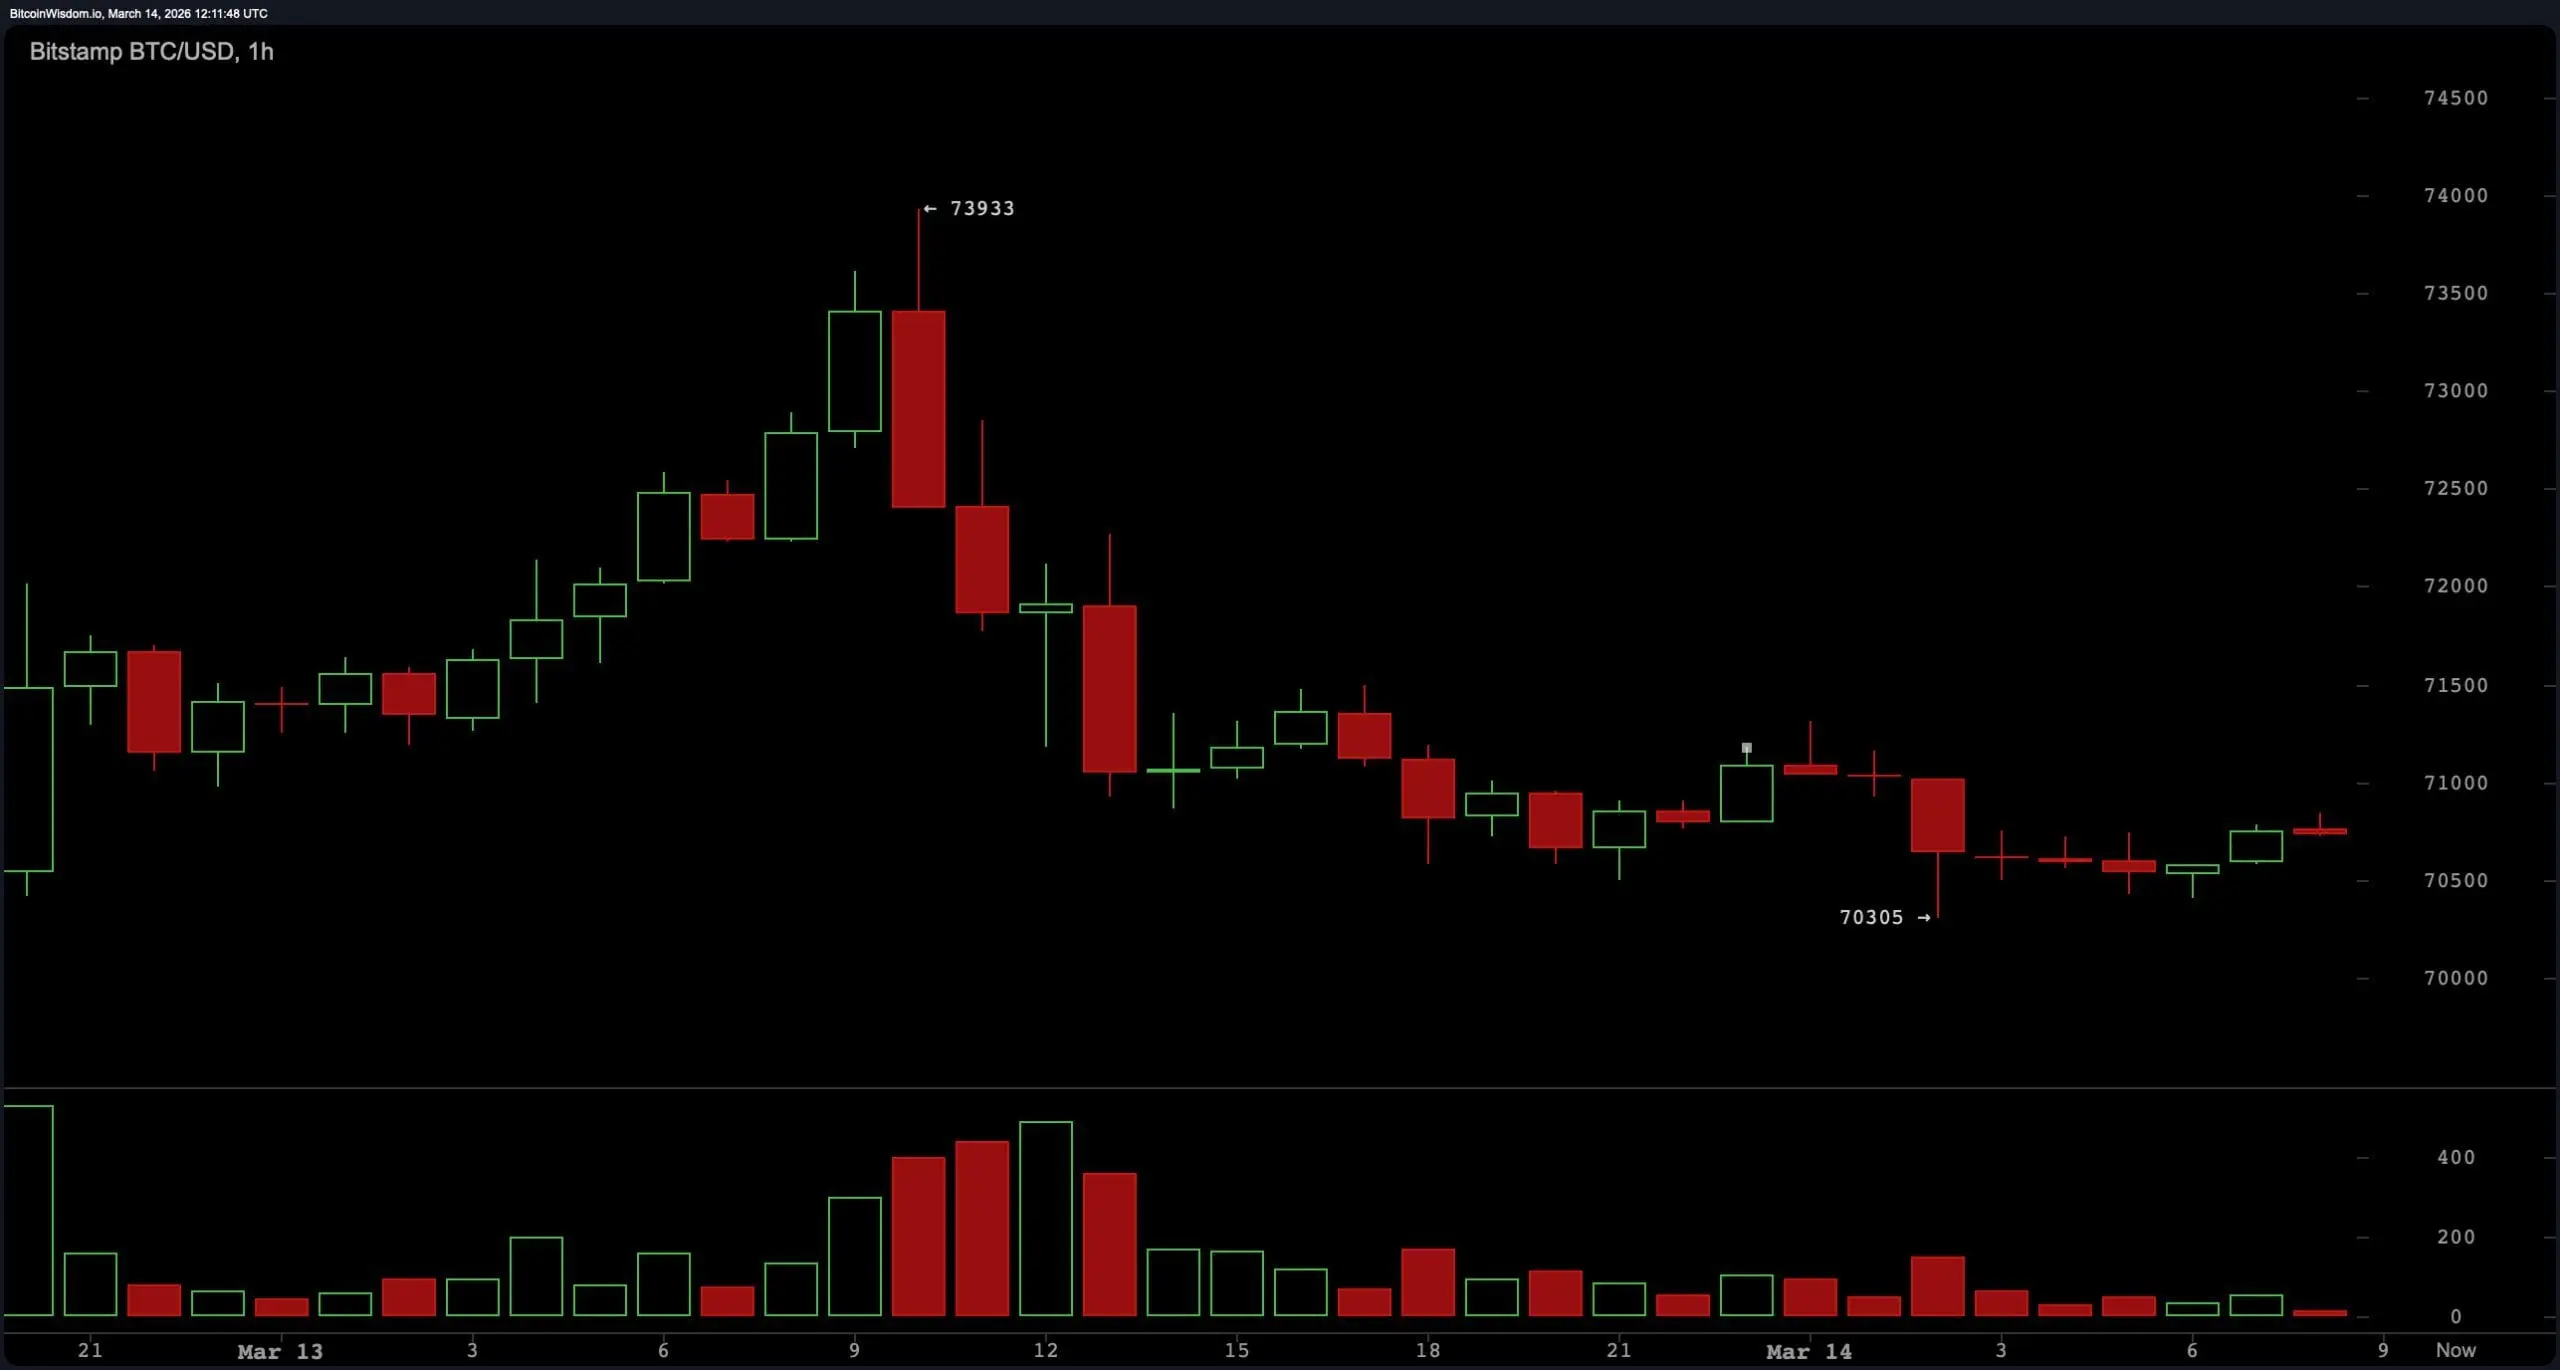 BTC/USD 1-hour chart via Bitstamp on March 14, 2026.
Oscillator readings reflect a neutral technical environment. The relative strength index ( RSI) is positioned at 53, indicating balanced momentum conditions. Stochastic reads 68, while the commodity channel index (CCI) is measured at 89, both also categorized as neutral signals.
BTC/USD 1-hour chart via Bitstamp on March 14, 2026.
Oscillator readings reflect a neutral technical environment. The relative strength index ( RSI) is positioned at 53, indicating balanced momentum conditions. Stochastic reads 68, while the commodity channel index (CCI) is measured at 89, both also categorized as neutral signals.
The average directional index (ADX) stands at 25, showing limited trend strength across the market. The Awesome oscillator records 2,432 and remains neutral. Momentum shows −1,891, signaling short-term downward pressure, while the moving average convergence divergence ( MACD) level registers −186 and signals upward momentum in the indicator summary.
Moving averages (MAs) present a split structure between short-term support and longer-term resistance levels. The exponential moving average (EMA) 10 sits at $69,648 and the simple moving average (SMA) 10 at $69,310, both signaling upward momentum relative to the current price. The EMA 20 at $69,305 and SMA 20 at $68,287 also remain supportive of the current range, along with the EMA 30 at $70,053 and SMA 30 at $68,215.
Longer-term averages reflect downward pressure, with the EMA 50 at $72,764 and the SMA 50 at $71,703 positioned above the price. Higher-period averages remain significantly elevated, including the EMA 100 at $79,665, SMA 100 at $80,935, EMA 200 at $87,978, and SMA 200 at $94,125. This distribution results in an overall neutral technical summary as short-term averages support current levels while longer-term averages remain above the market.
Bull Verdict:
If bitcoin maintains support above $69,500 and breaks decisively above the $71,200 resistance level, the current compression pattern could resolve to the upside. A sustained move through this level would clear short-term resistance and open the path toward $72,800 and a potential retest of the $73,800–$74,000 resistance zone seen on the daily chart. The sequence of higher lows on the four-hour timeframe and supportive short-term moving averages suggests underlying strength remains intact as long as price holds above the mid-range support area.
Bear Verdict:
A breakdown below the $69,500 support level would weaken the current consolidation structure and shift short-term momentum downward. Losing this level would place bitcoin below key range support and expose lower targets around $67,800, with a deeper support zone near $66,000 visible on the daily timeframe. Longer-term moving averages remaining above current price levels continue to signal overhead resistance, meaning sustained weakness below support could accelerate downside pressure if bearish momentum increases.
FAQ 🧭
- What is the bitcoin price on March 14, 2026?
Bitcoin is trading around $70,795, consolidating near the $70,000 level after rejecting resistance near $74,000.
- What are the key bitcoin resistance levels right now?
The main resistance levels for bitcoin are $71,200 in the short term and the major resistance zone between $73,800 and $74,000.
- What are the key bitcoin support levels to watch?
Key bitcoin support sits near $70,300 intraday, with stronger structural support at $69,500 and major support near $66,000.
- Is bitcoin trending up or down right now?
Bitcoin’s current technical trend is neutral as indicators and moving averages show consolidation between roughly $69,500 and $72,000.
Related Articles
O autor de "Pai Rico, Pai Pobre" avisa que a bolha de ativos vai rebentar, prevendo que o BTC suba para 750 mil dólares
O investidor Robert Kiyosaki prevê que o Bitcoin atingirá 750.000 dólares e o Ethereum 95.000 dólares após uma crise financeira global, alertando também para o colapso iminente da "maior bolha de ativos de todos os tempos". Ele enfatiza a importância de deter ouro, prata e criptomoedas para se proteger da desvalorização da moeda fiduciária. Embora as suas previsões gerem divergências, com críticos argumentando a falta de suporte empírico, os apoiantes veem valor a longo prazo nos ativos escassos.
MarketWhisper18m atrás
Cango divulga resultados financeiros de 2025: receita total anual de 688 milhões de dólares, venda de 4451 bitcoins em fevereiro
Cango (灿谷) divulgou relatório financeiro de 2025, com receita total de $688 milhões, gerando 6.594,6 bitcoins, receita do quarto trimestre de $179 milhões e perda líquida de $622 milhões. A empresa alienou 4.451 bitcoins para aliviar passivos e completou aumento de capital de $10,5 milhões e novo acordo de capital adicional de $65 milhões.
GateNews20m atrás
Mahjong Big Brother entra novamente, vai long em BTC, ETH e HYPE
O mercado de criptografia reactivou-se, e o conhecido trader Machi Oji Huang Li-cheng voltou a entrar no mercado com posições longas, aumentando as posições compradas de Ethereum e Bitcoin. Apesar de ter lucros flutuantes superiores a 1,4 milhões de dólares, ainda faltam 27,7 milhões de dólares para atingir o ponto de equilíbrio. Face às perdas passadas, o seu investimento contínuo tornou-se o ponto focal do mercado.
ChainNewsAbmedia39m atrás
Um grande tubarão de hedge estabeleceu uma posição de 45 milhões de dólares apostando no enfraquecimento da taxa de câmbio ETH/BTC, com ganhos flutuantes atuais de 200 mil dólares.
17 de março, Hyperinsight monitorou um par de operações de cobertura de uma baleia gigante que abriu posições com alavancagem de 20x em compra de BTC e venda de ETH, aproximadamente 22 milhões de dólares cada, totalizando 45 milhões de dólares. Atualmente, a posição comprada em BTC tem uma perda flutuante de 230 mil dólares, a posição vendida em ETH tem um ganho flutuante de 420 mil dólares, com um ganho flutuante geral de 200 mil dólares. Esta baleia gigante frequentemente utiliza posições em criptomoedas para cobertura de commodities, com tendência para estratégias de venda.
GateNews40m atrás
MICA Daily|BTC estável acima da média móvel de 30 dias, continuando com perspectiva altista
De acordo com dados da Binance, o indicador de convergência/divergência de média móvel do Bitcoin mostra uma melhoria significativa na estrutura da tendência de preços, com preço de negociação atualmente em torno de 73,000 dólares, e as médias móveis apresentam um estado de divergência, refletindo uma fase de transição do mercado. A análise técnica indica que a média móvel de 30 dias é importante; se o preço se mantiver acima dessa média móvel, isso indica suporte compradores, caso contrário, pode entrar numa fase de correção. Os investidores usam as mudanças nas médias móveis para avaliar a tendência.
区块客48m atrás
Metaplanet levanta 255 milhões de dólares adicionais para comprar bitcoin, com objetivo de aumentar o investimento total para 531 milhões de dólares
A empresa japonesa Metaplanet angariou recentemente aproximadamente 255 milhões de dólares em novos fundos para aumentar as suas participações em Bitcoin, com o objetivo de deter 210 mil BTC antes de 2027. A empresa tornou-se o maior detentor de Bitcoin no Japão e está a expandir ainda mais a sua exposição no mercado. Esta estratégia de angariação de fundos inclui colocações de novas ações com prémio e warrants, visando acelerar a acumulação de Bitcoin e o desenvolvimento do ecossistema.
区块客52m atrás

