Dream379

vip
Age 3.7 Year
Peak Tier 1
No content yet
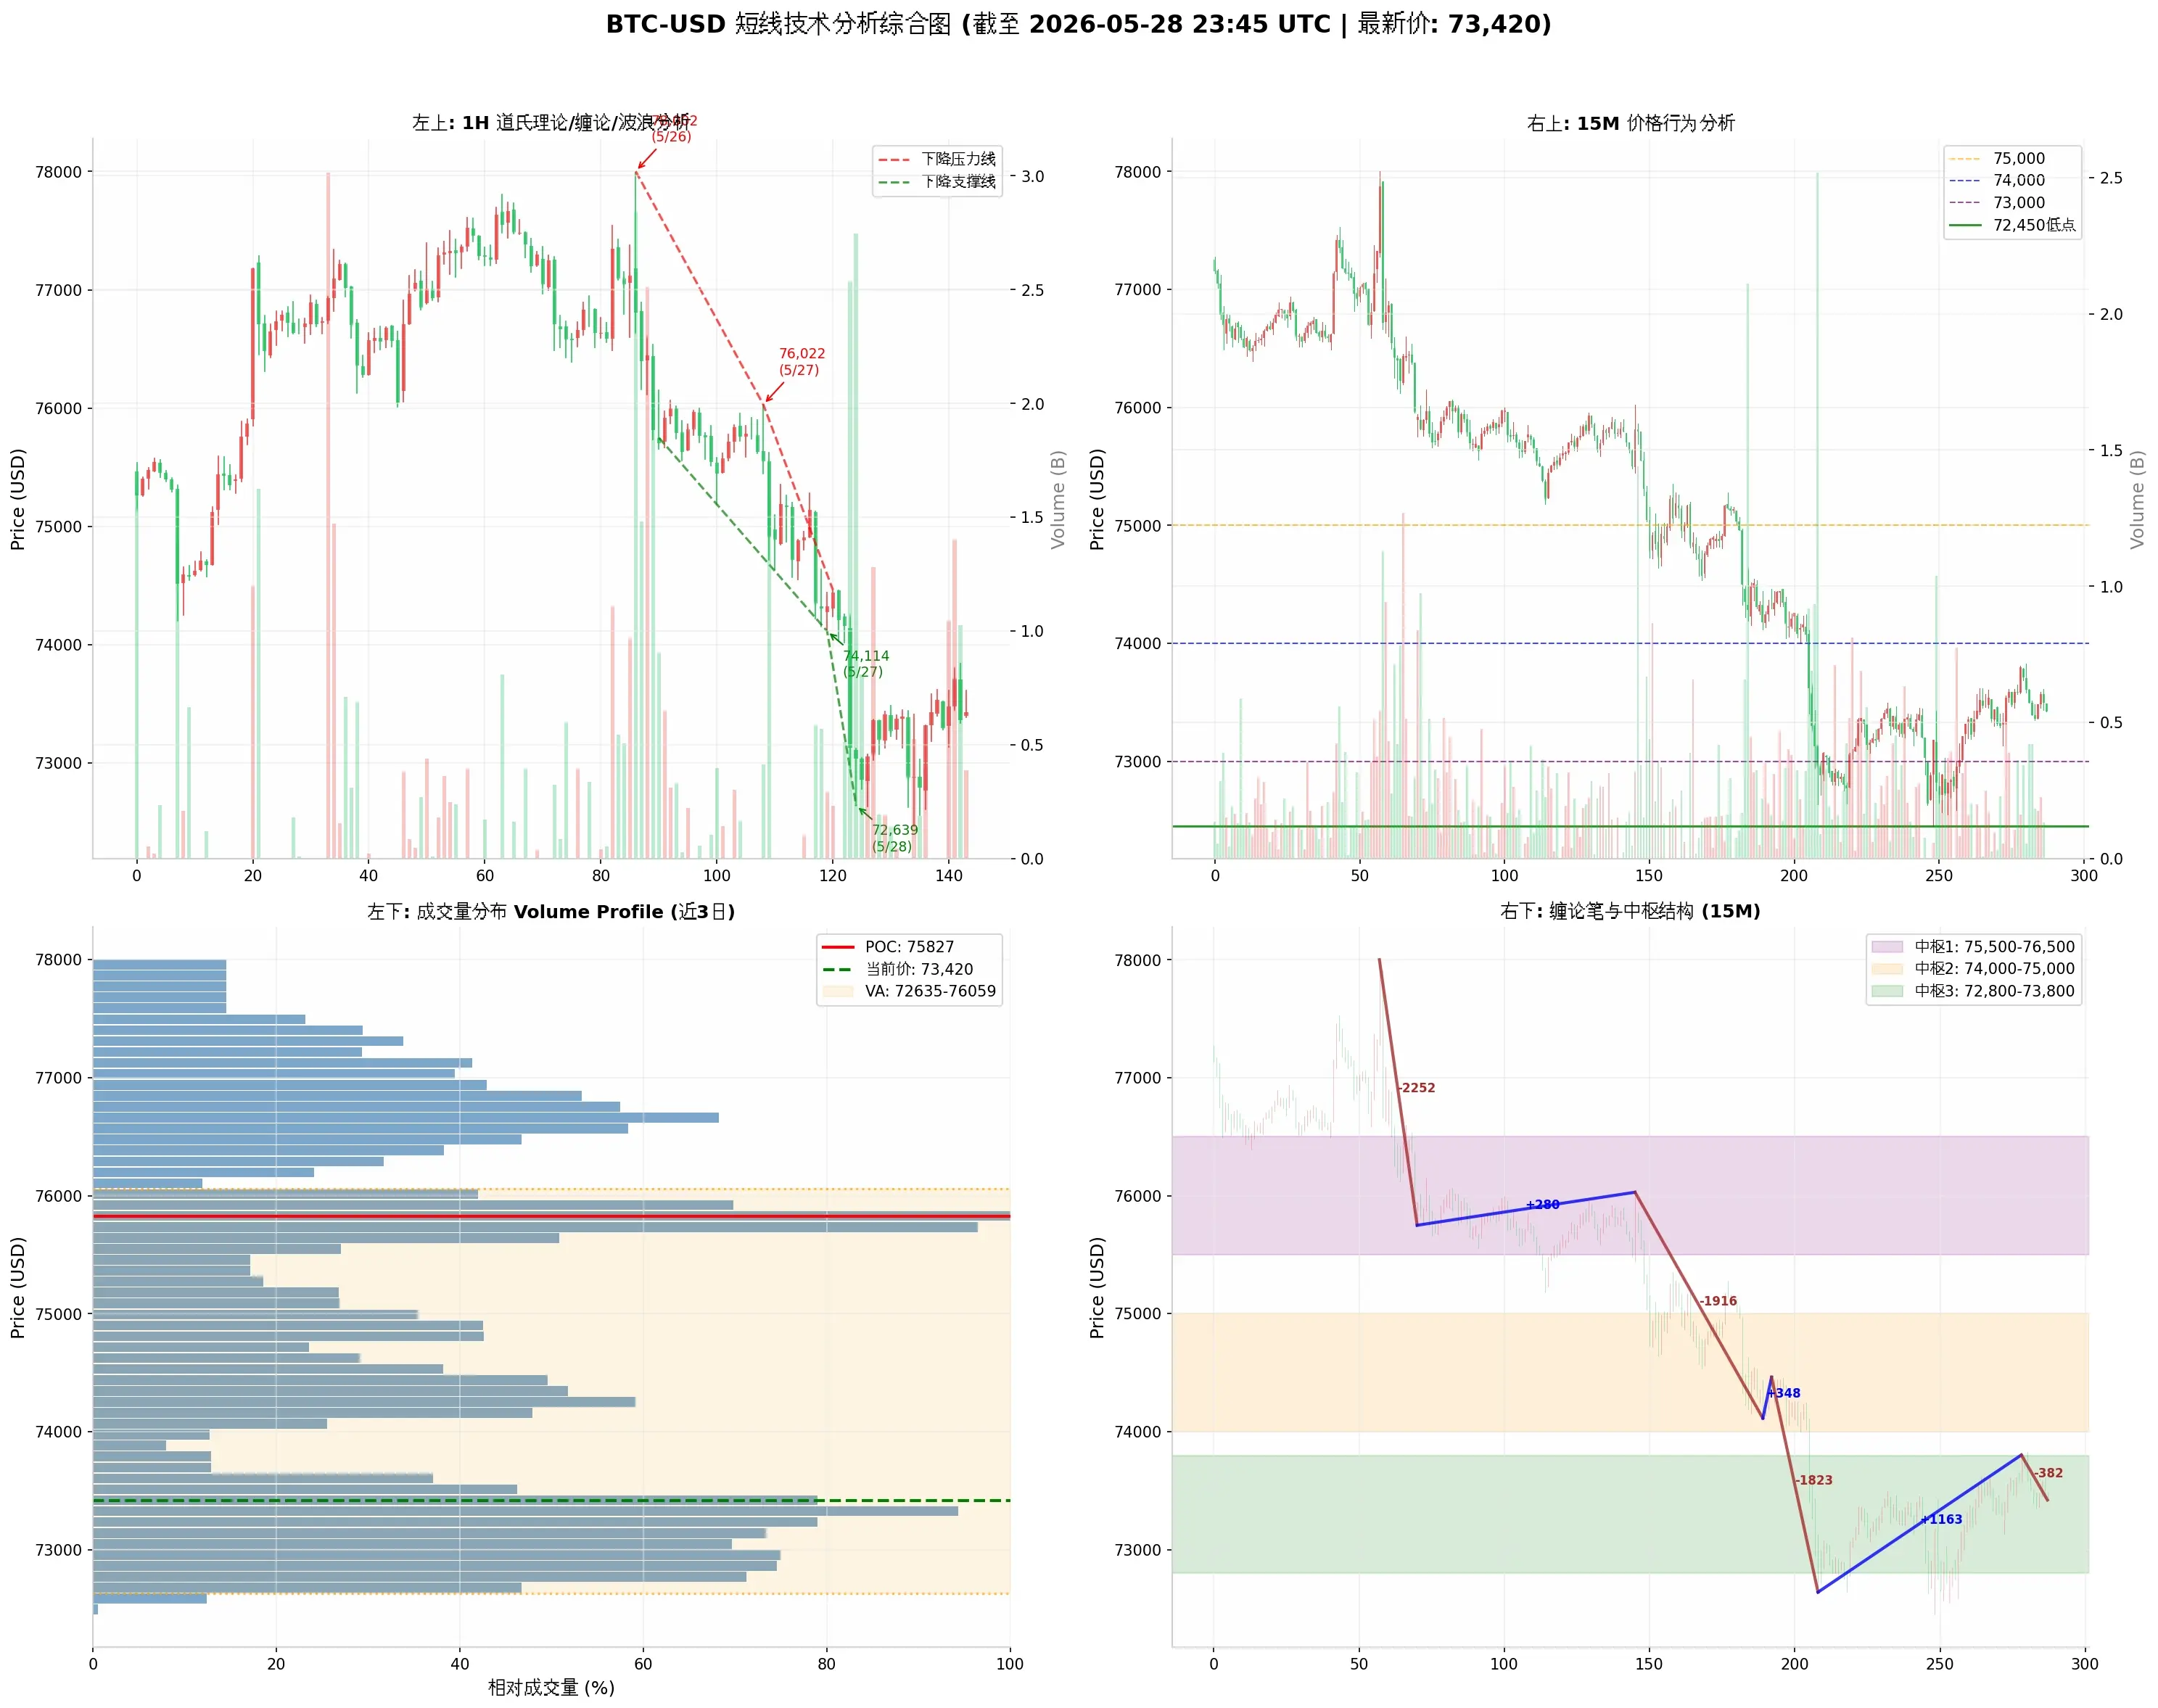
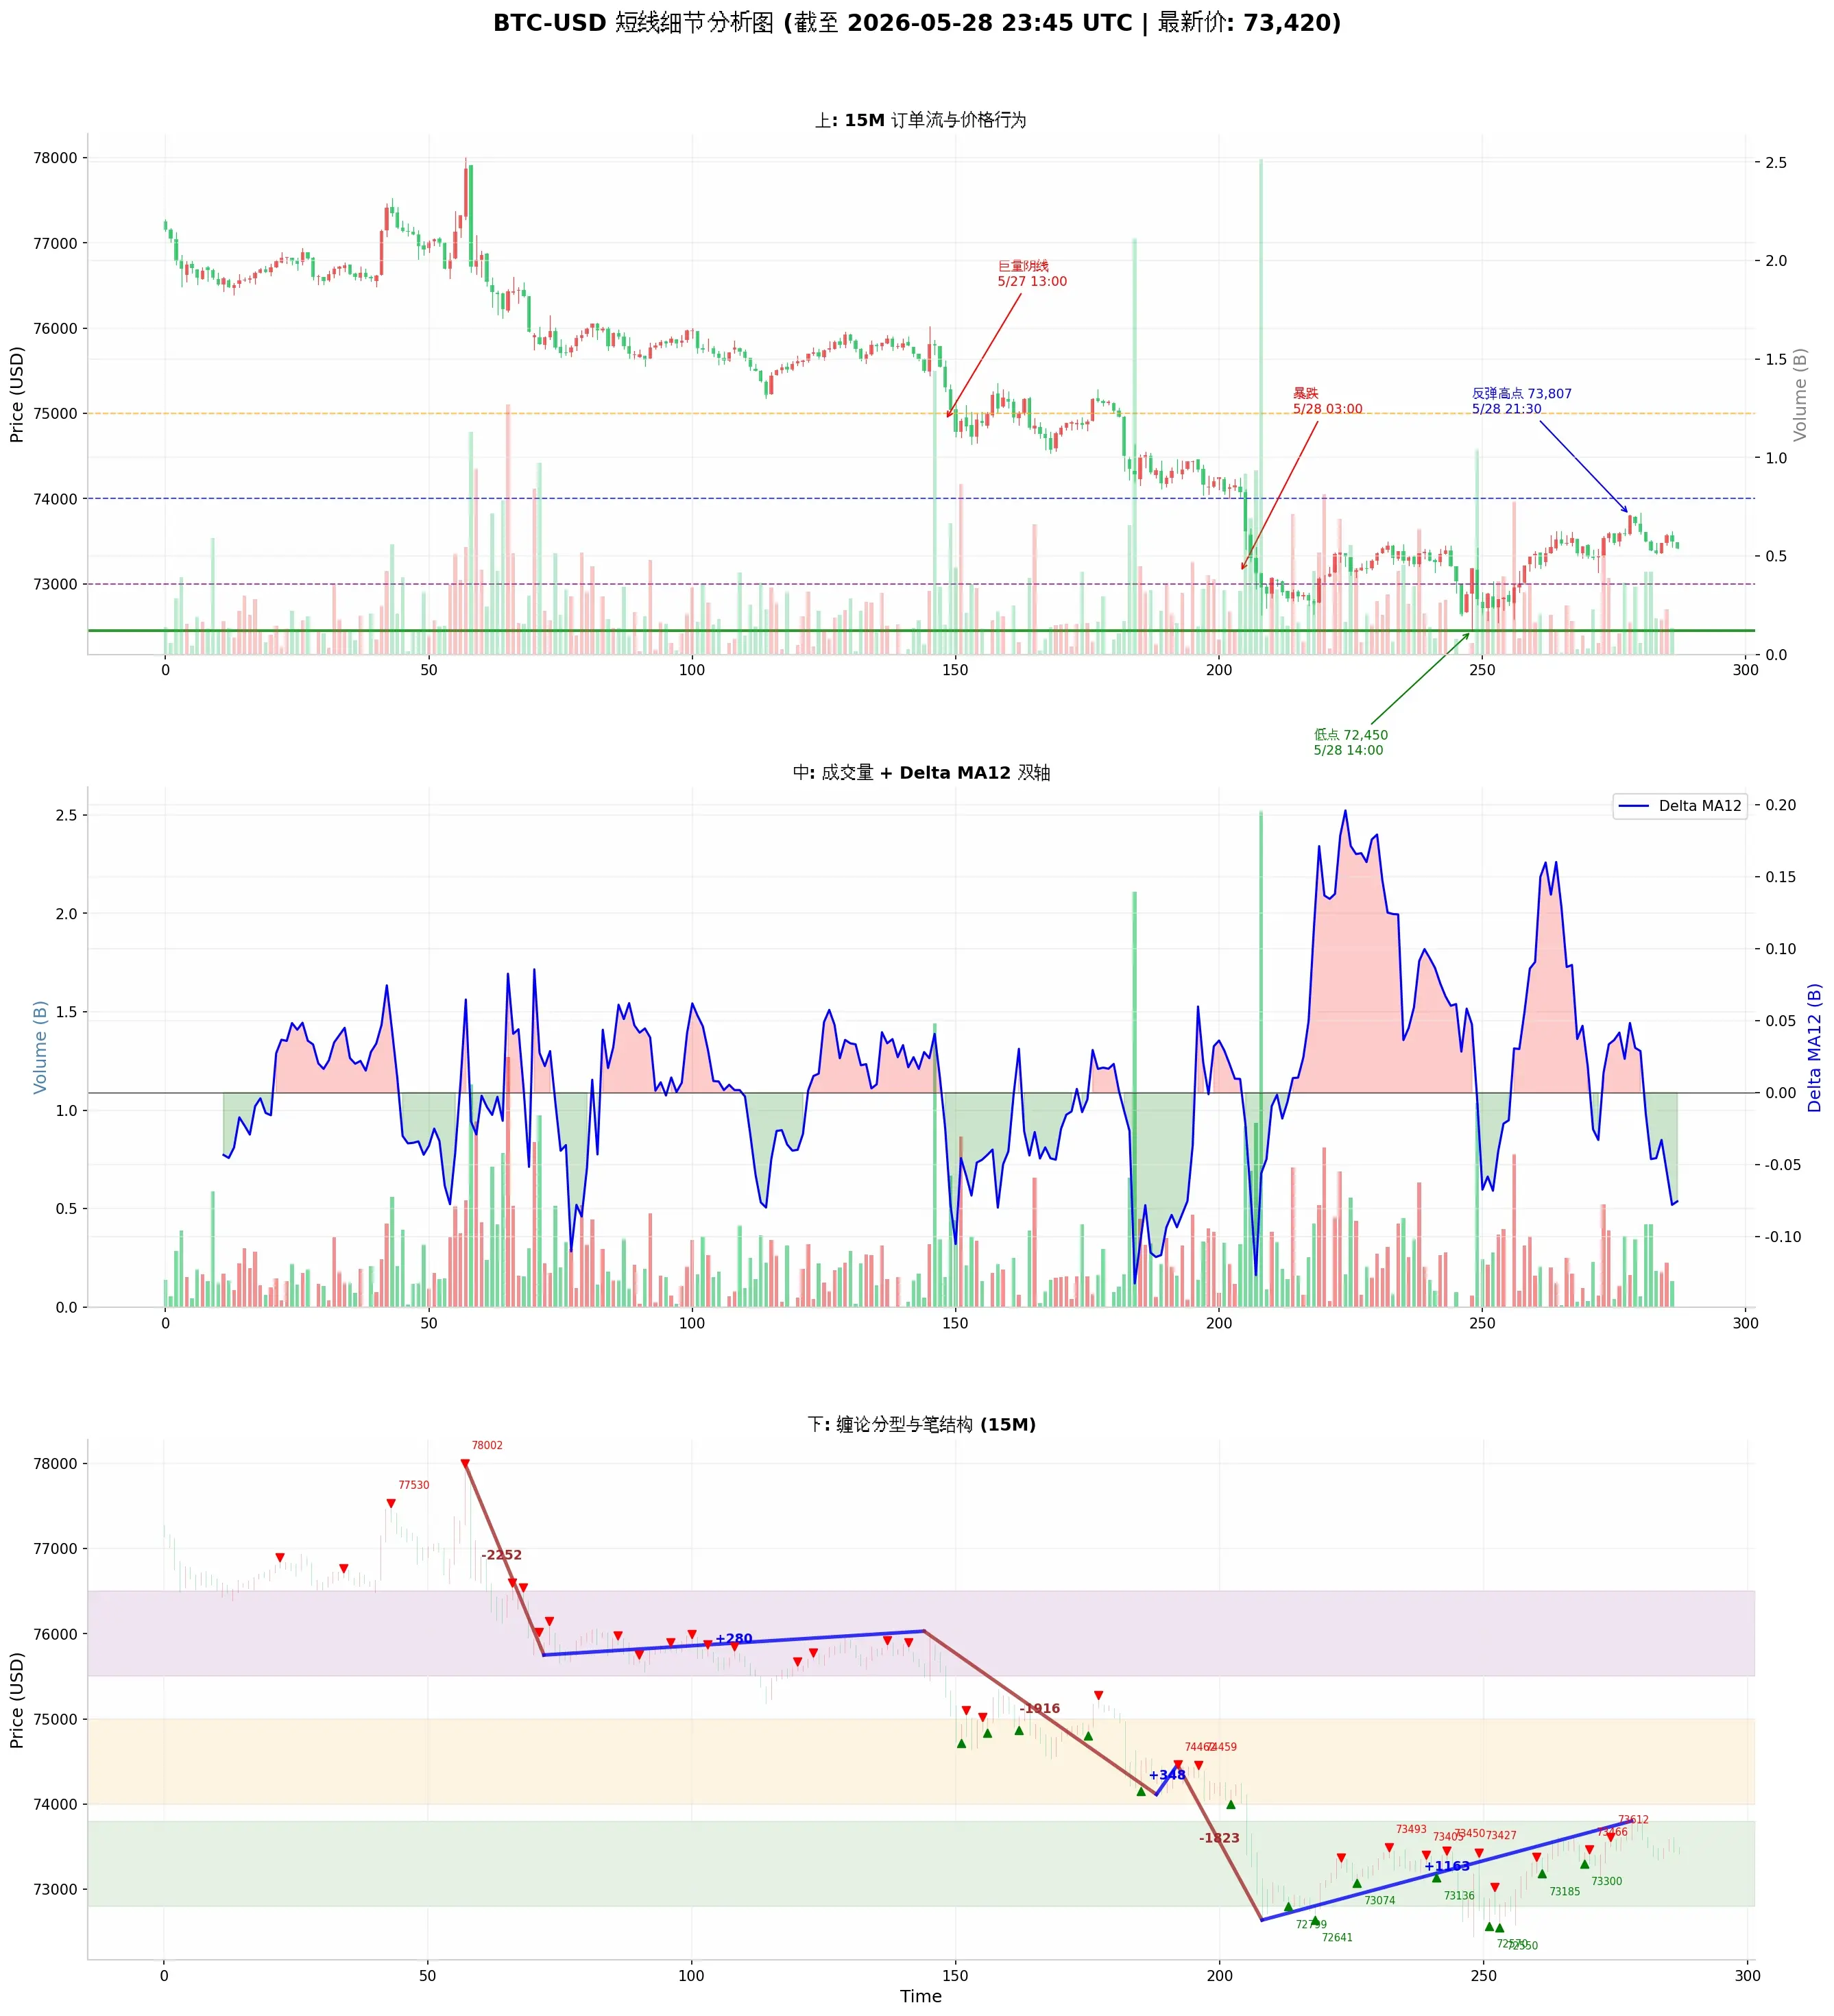
From Dow Theory, Chan Theory, Elliott Wave Theory, Volume-Price Relationship, Order Flow, and Price Action Analysis of BTC Short-term Trends
$BTC ‌1. Dow Theory (Dow Theory)
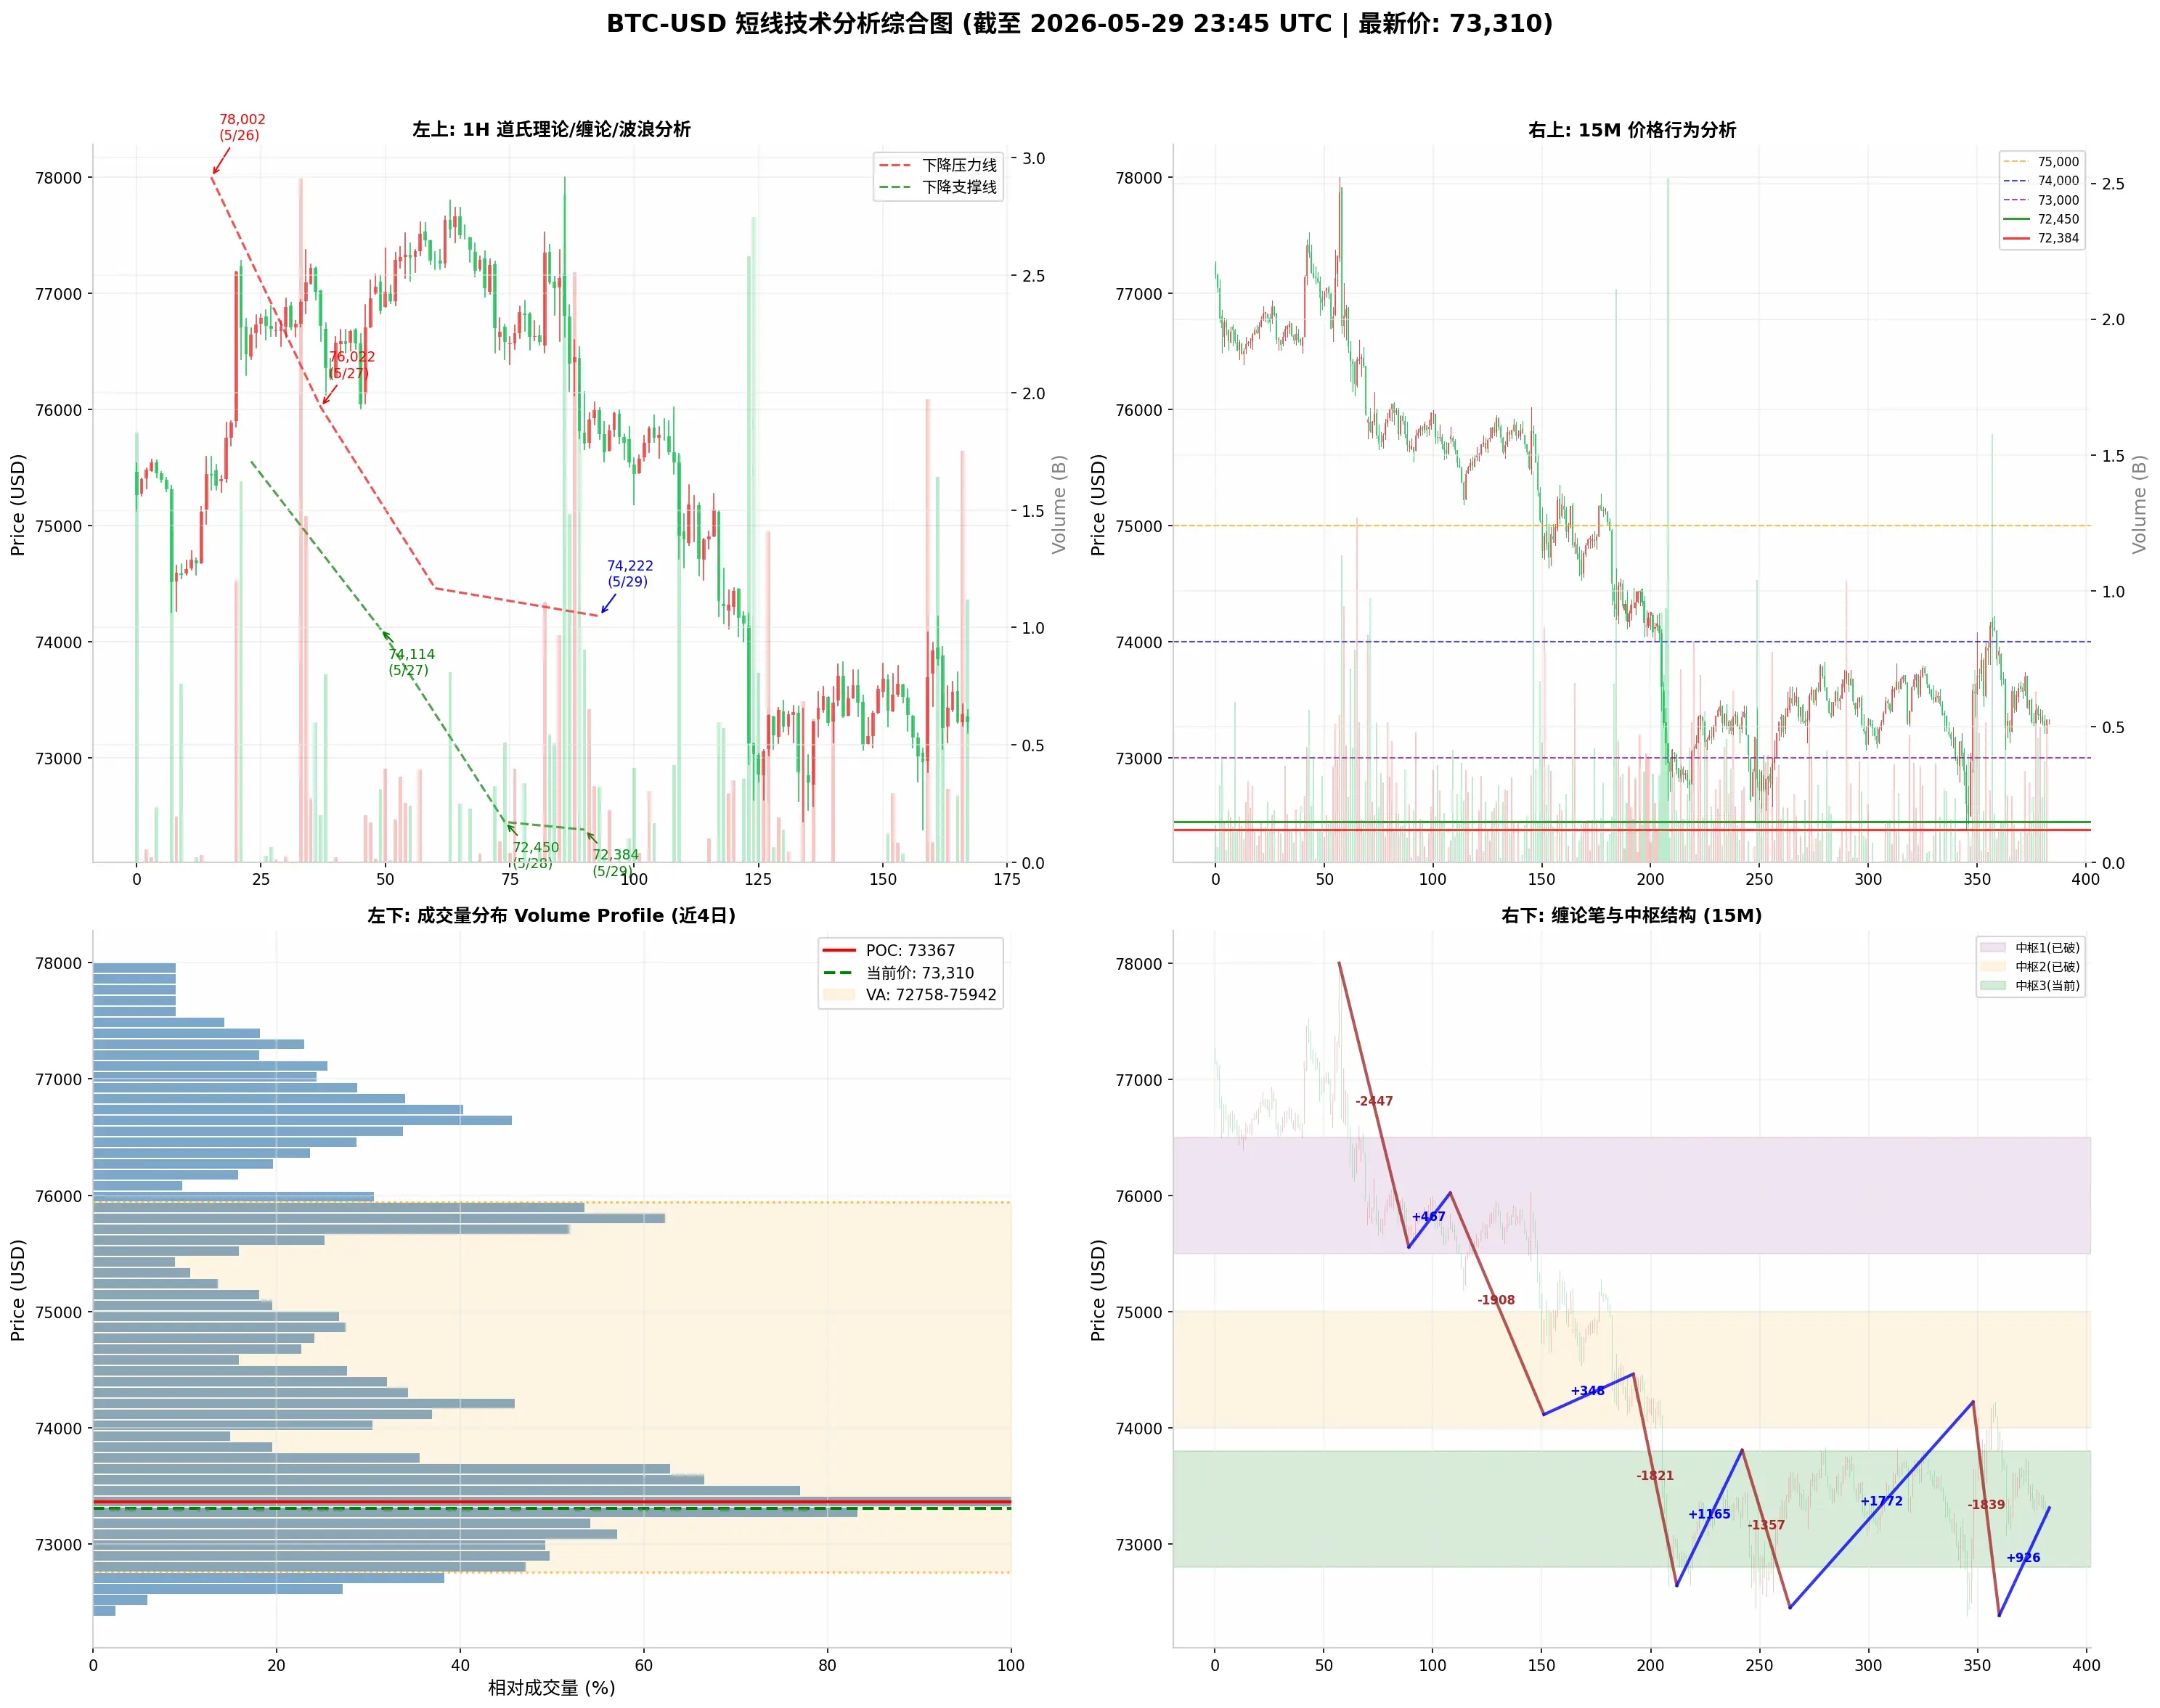
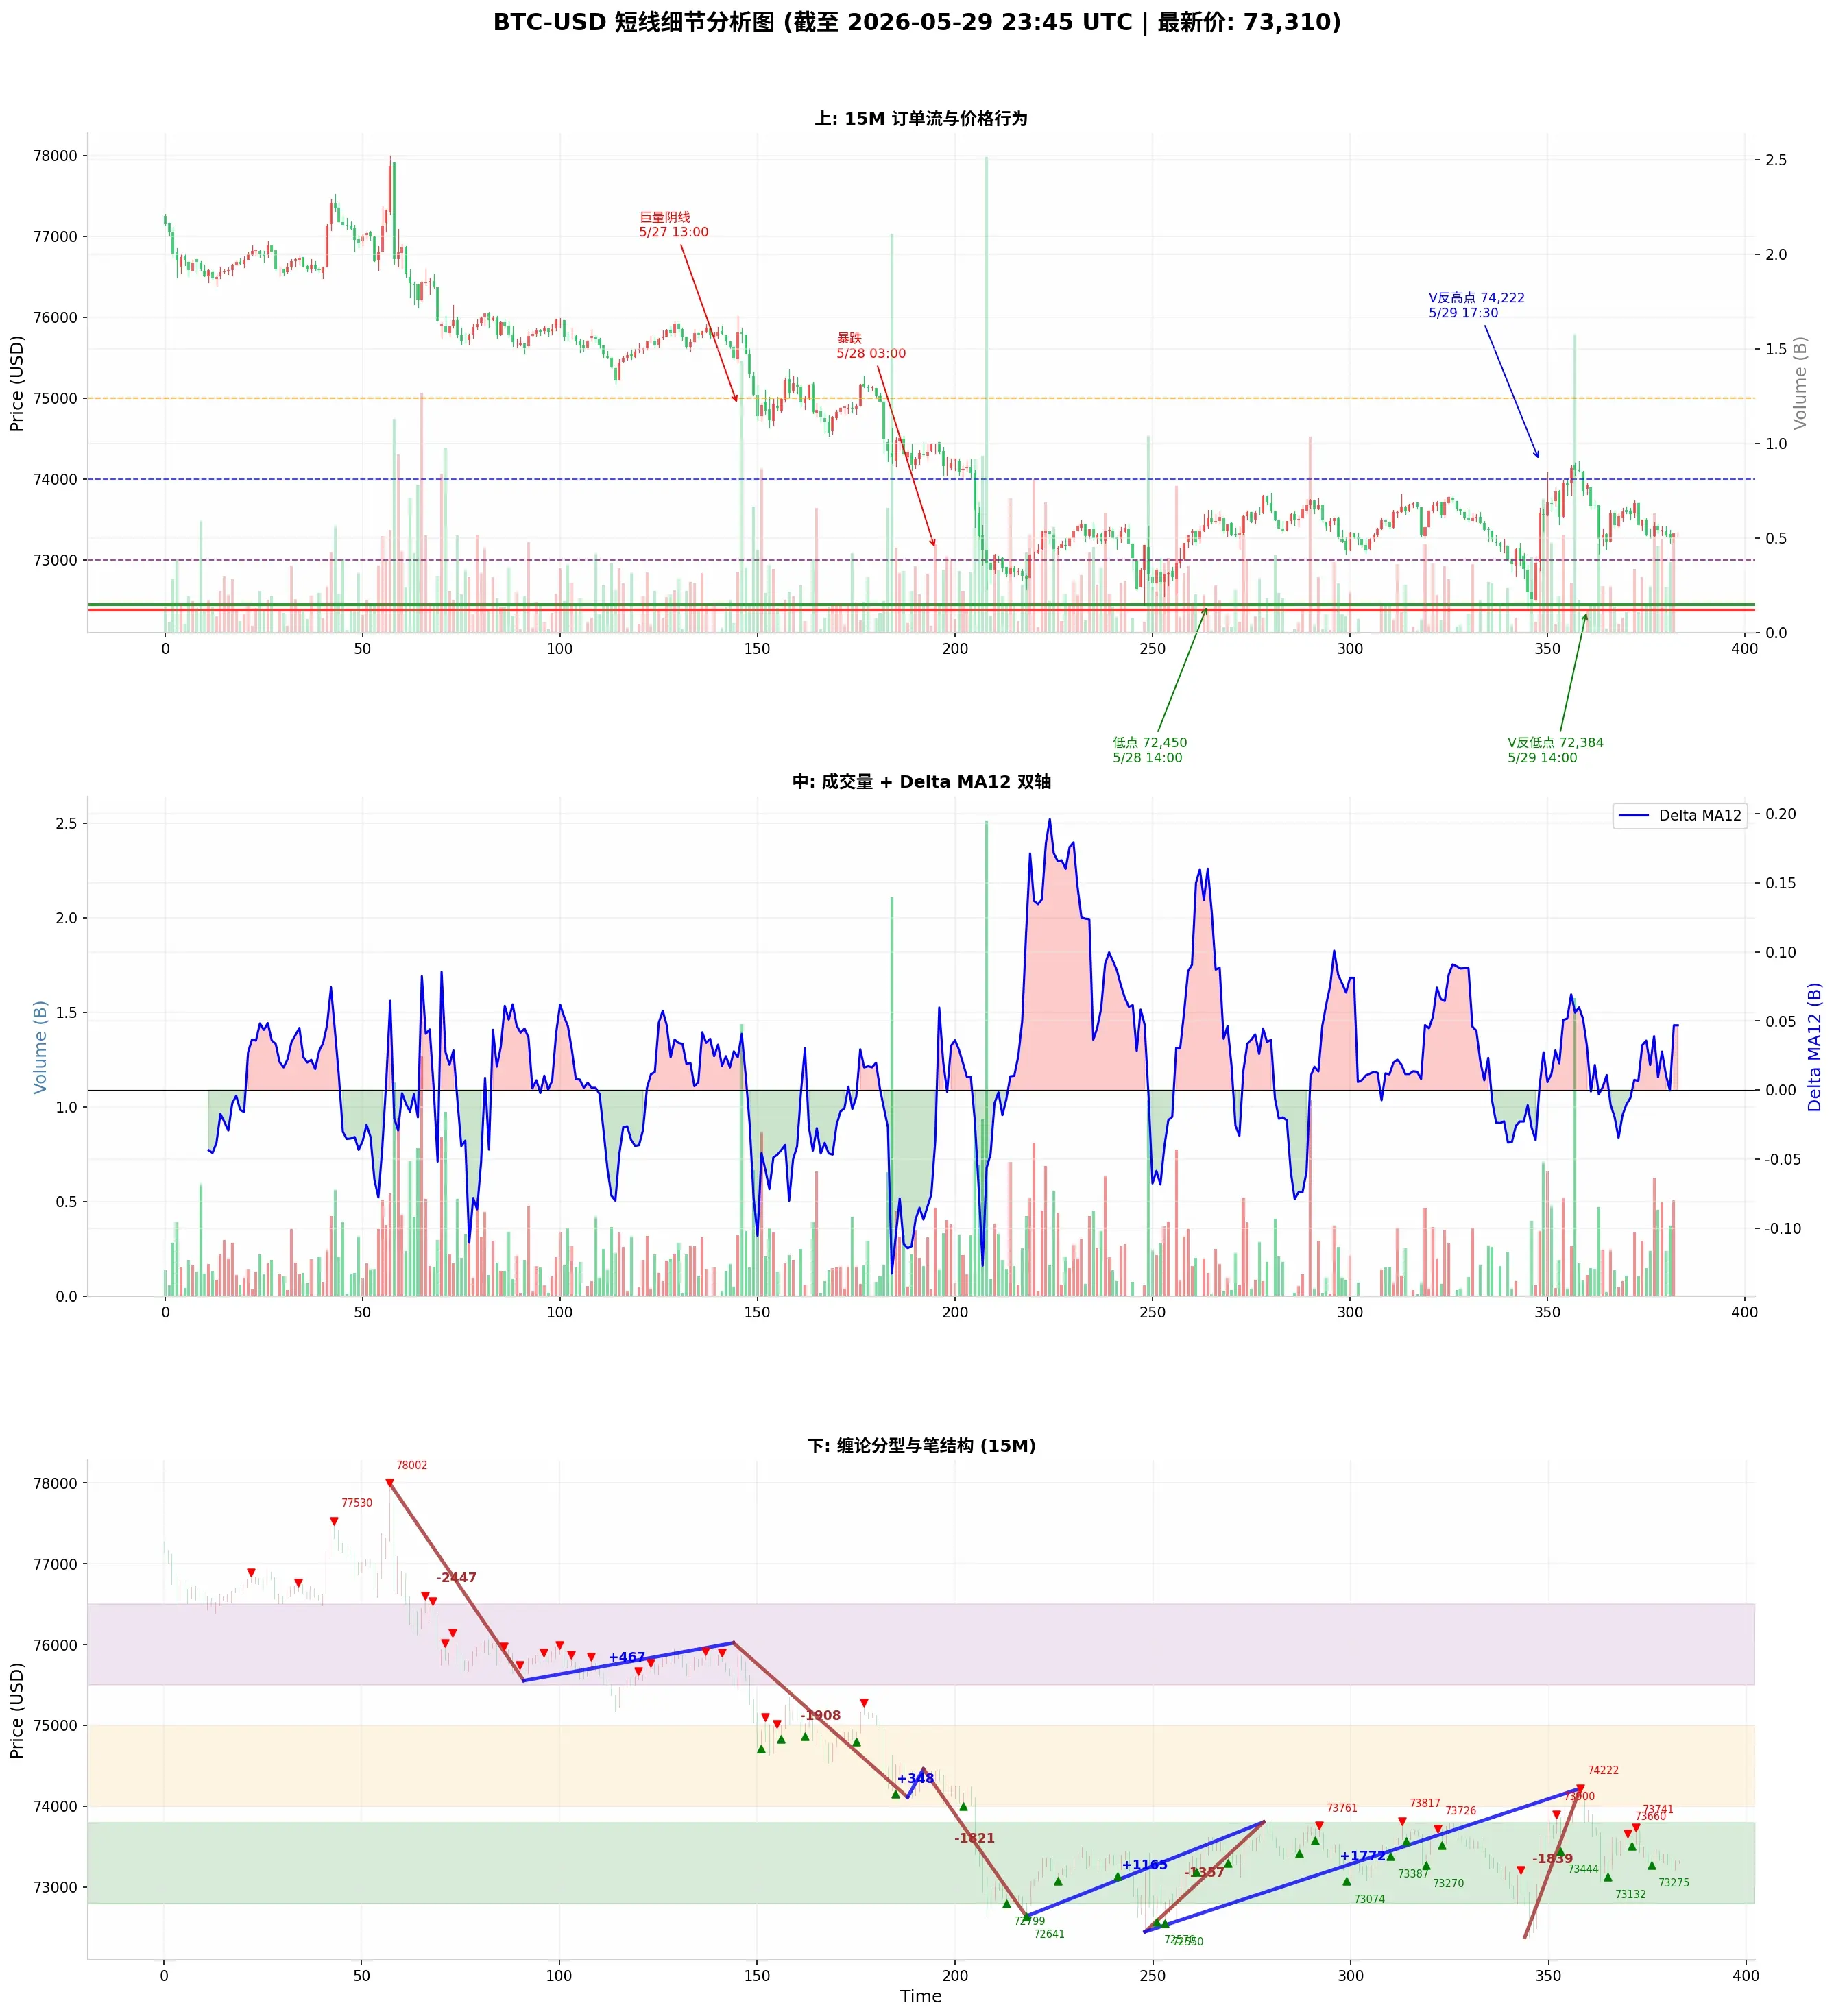
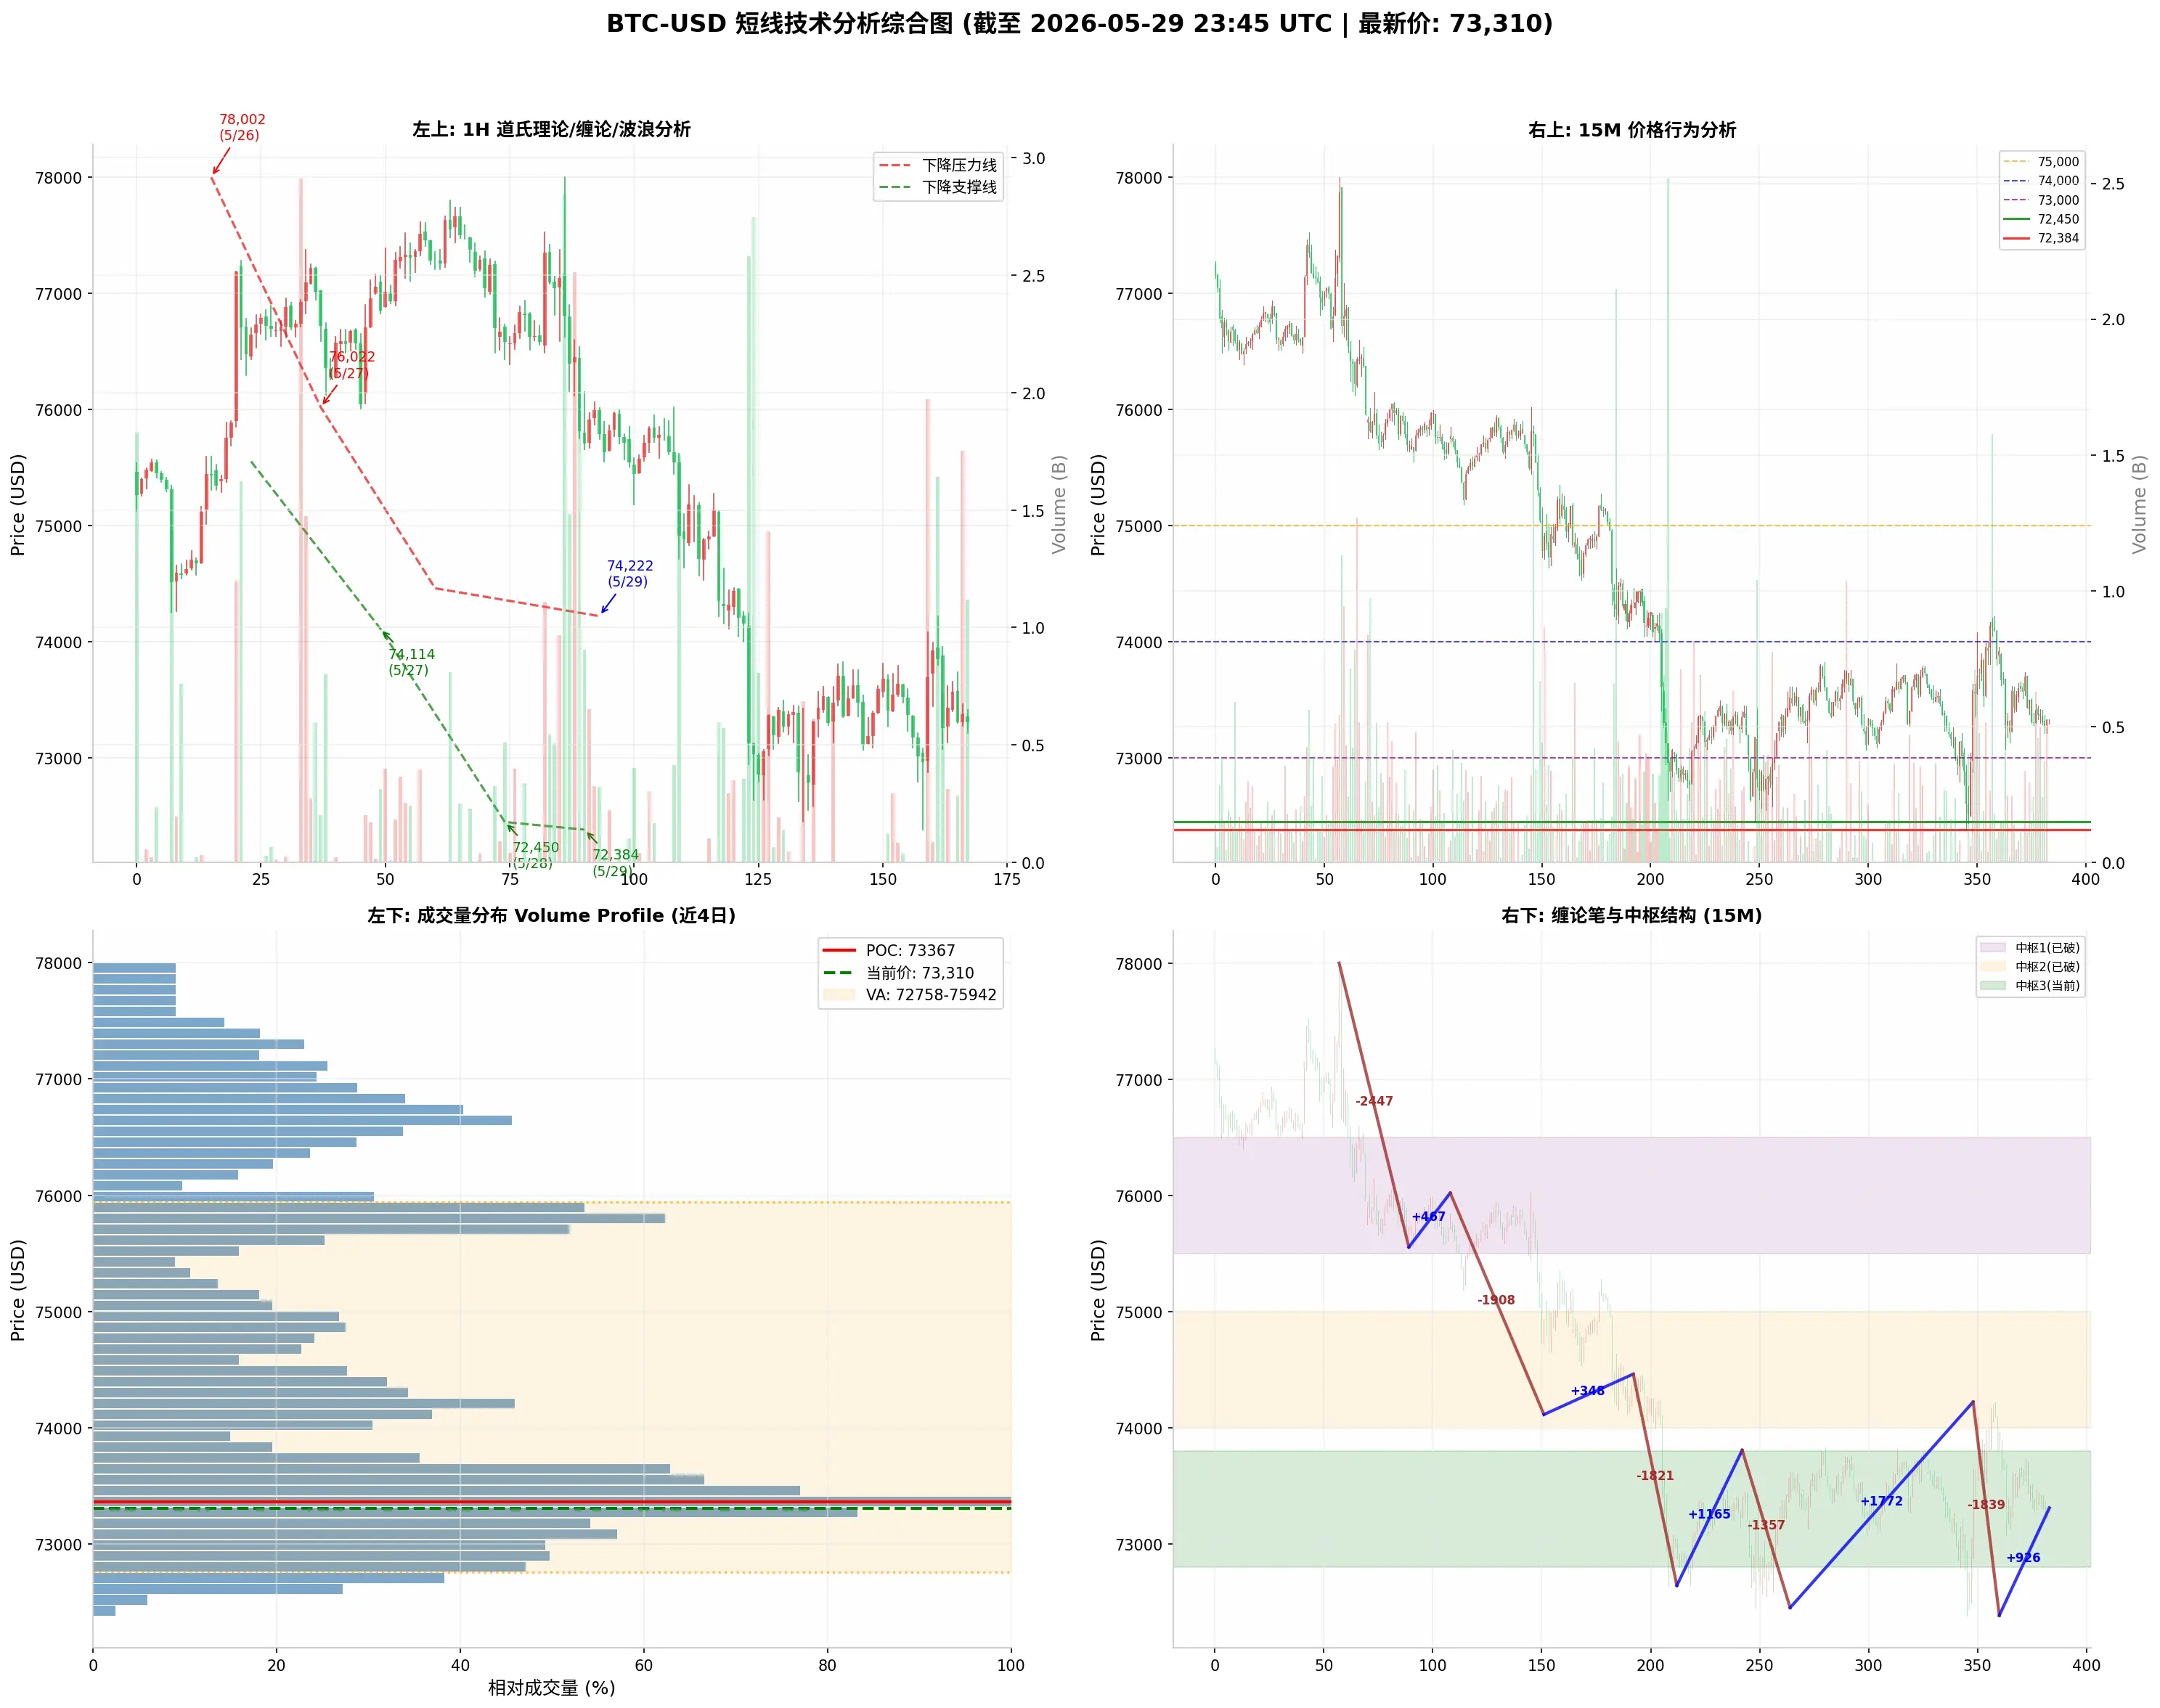
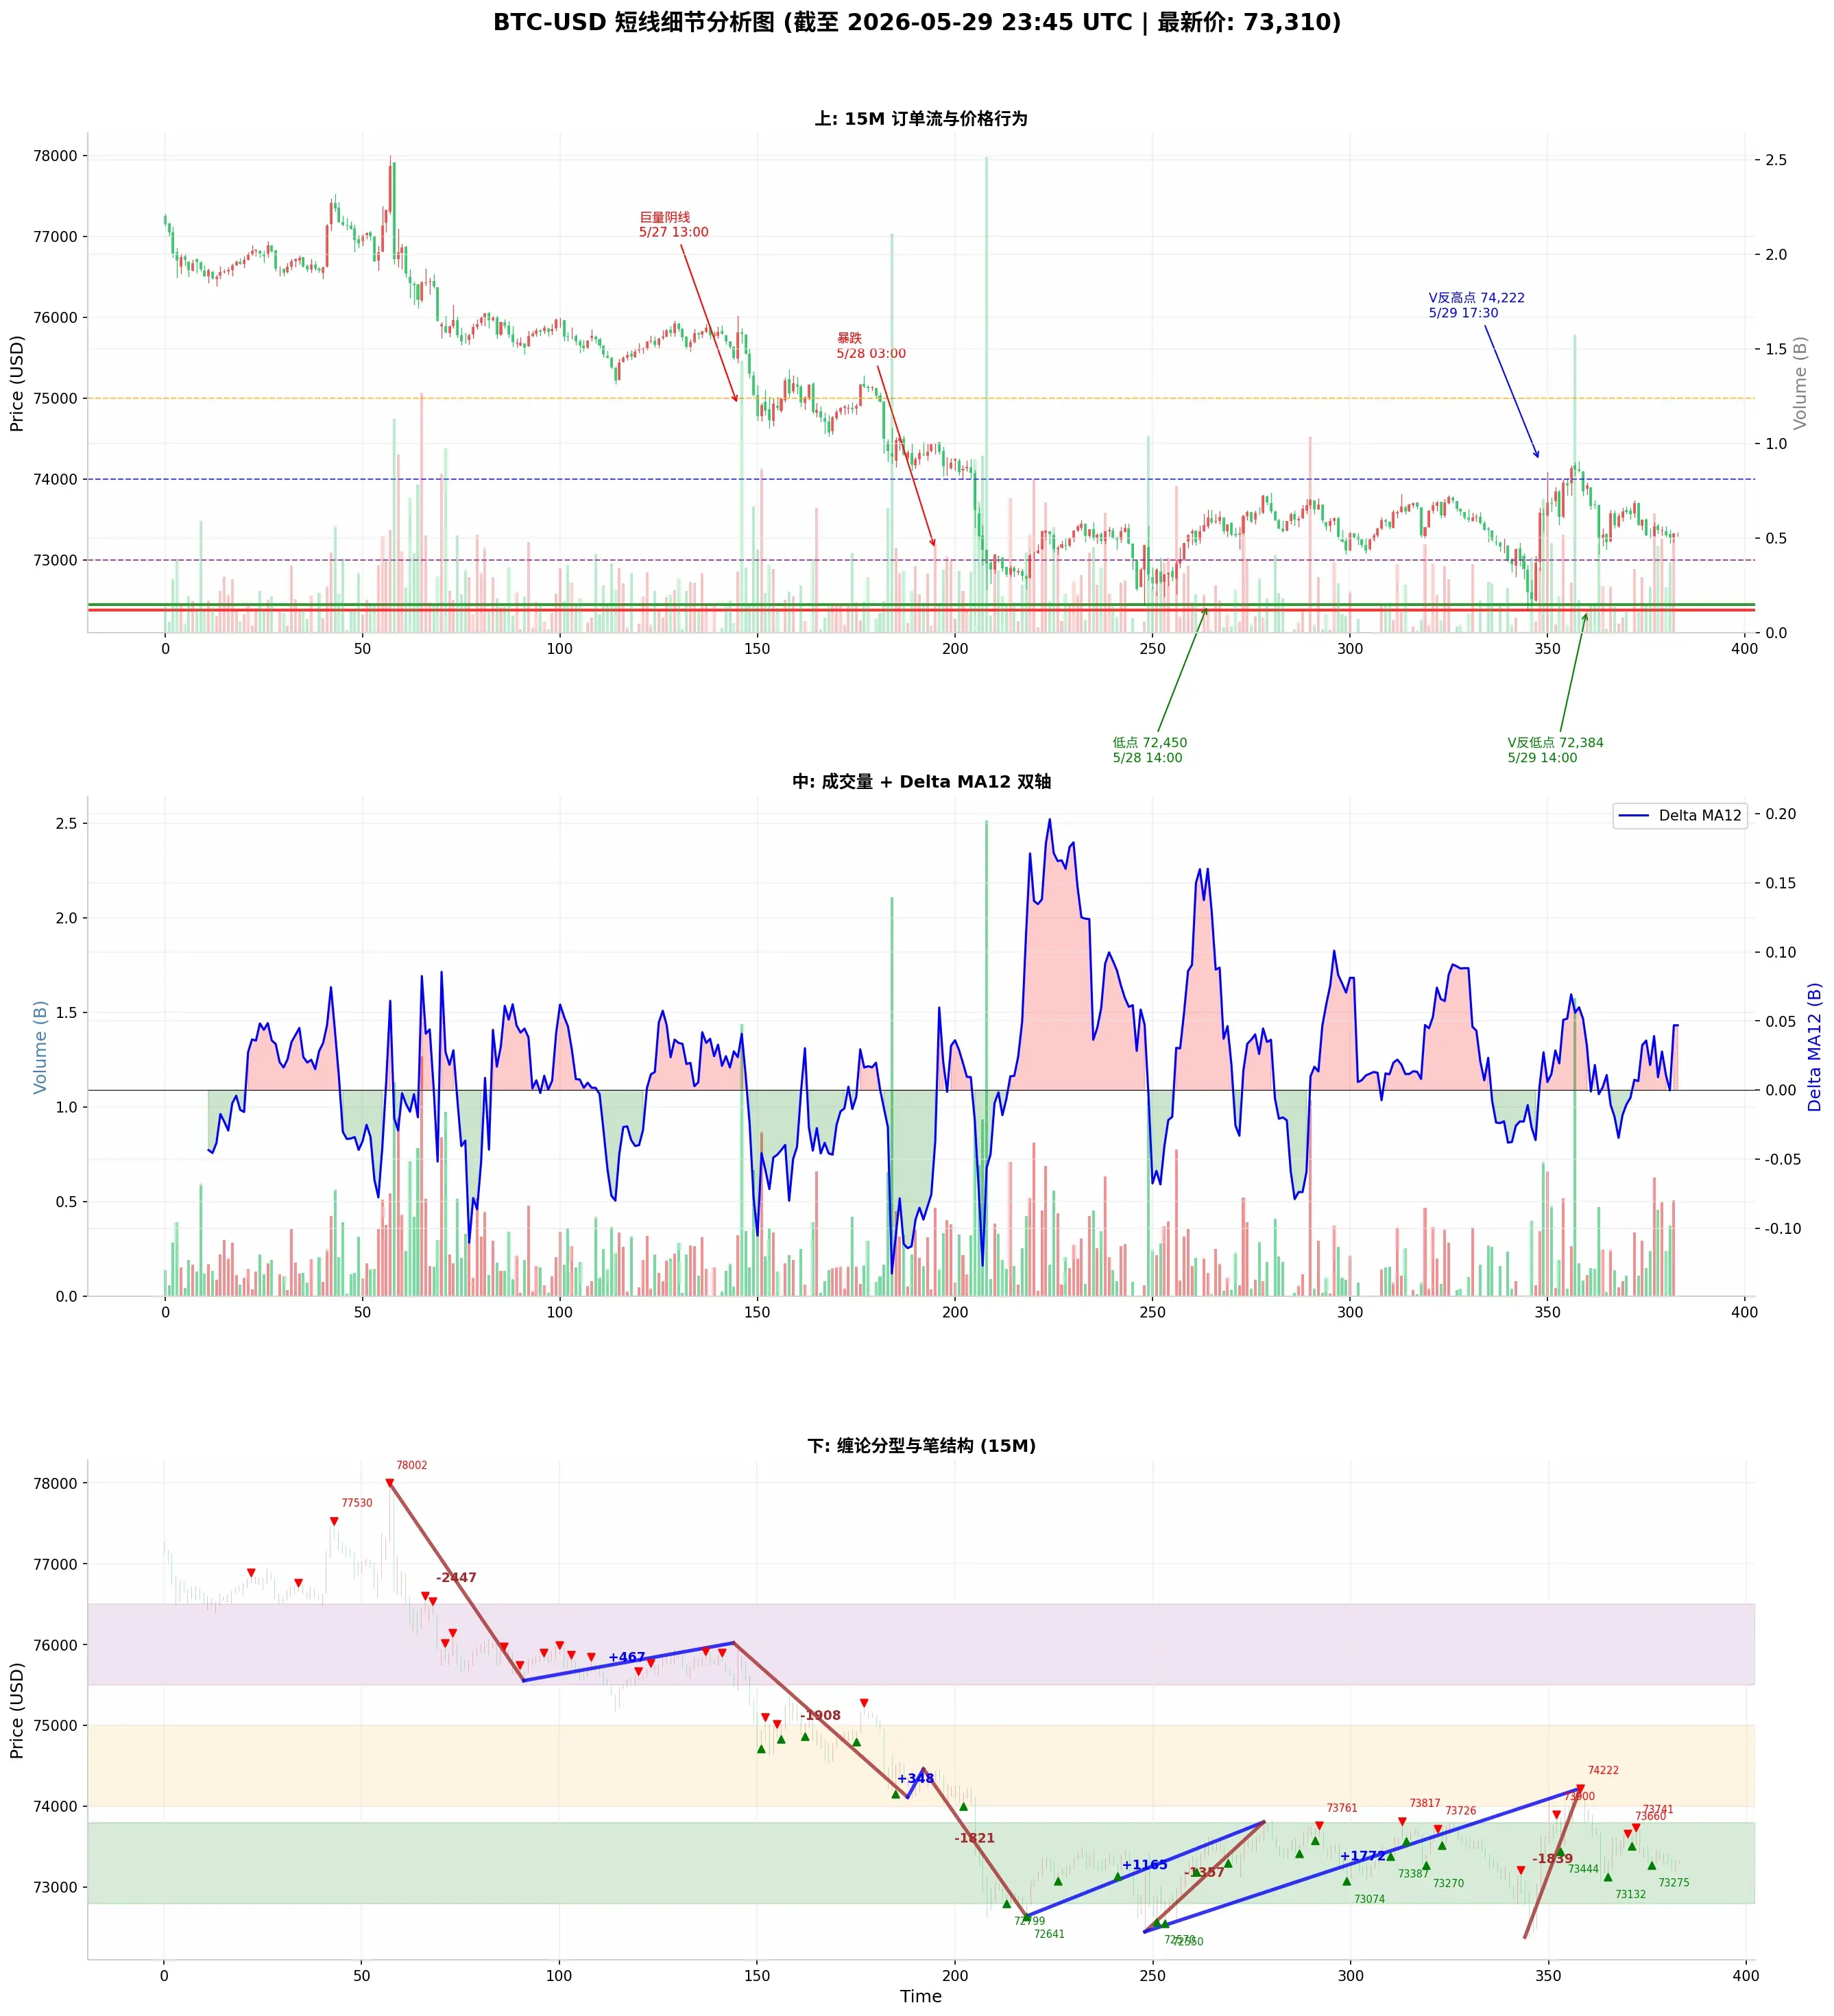
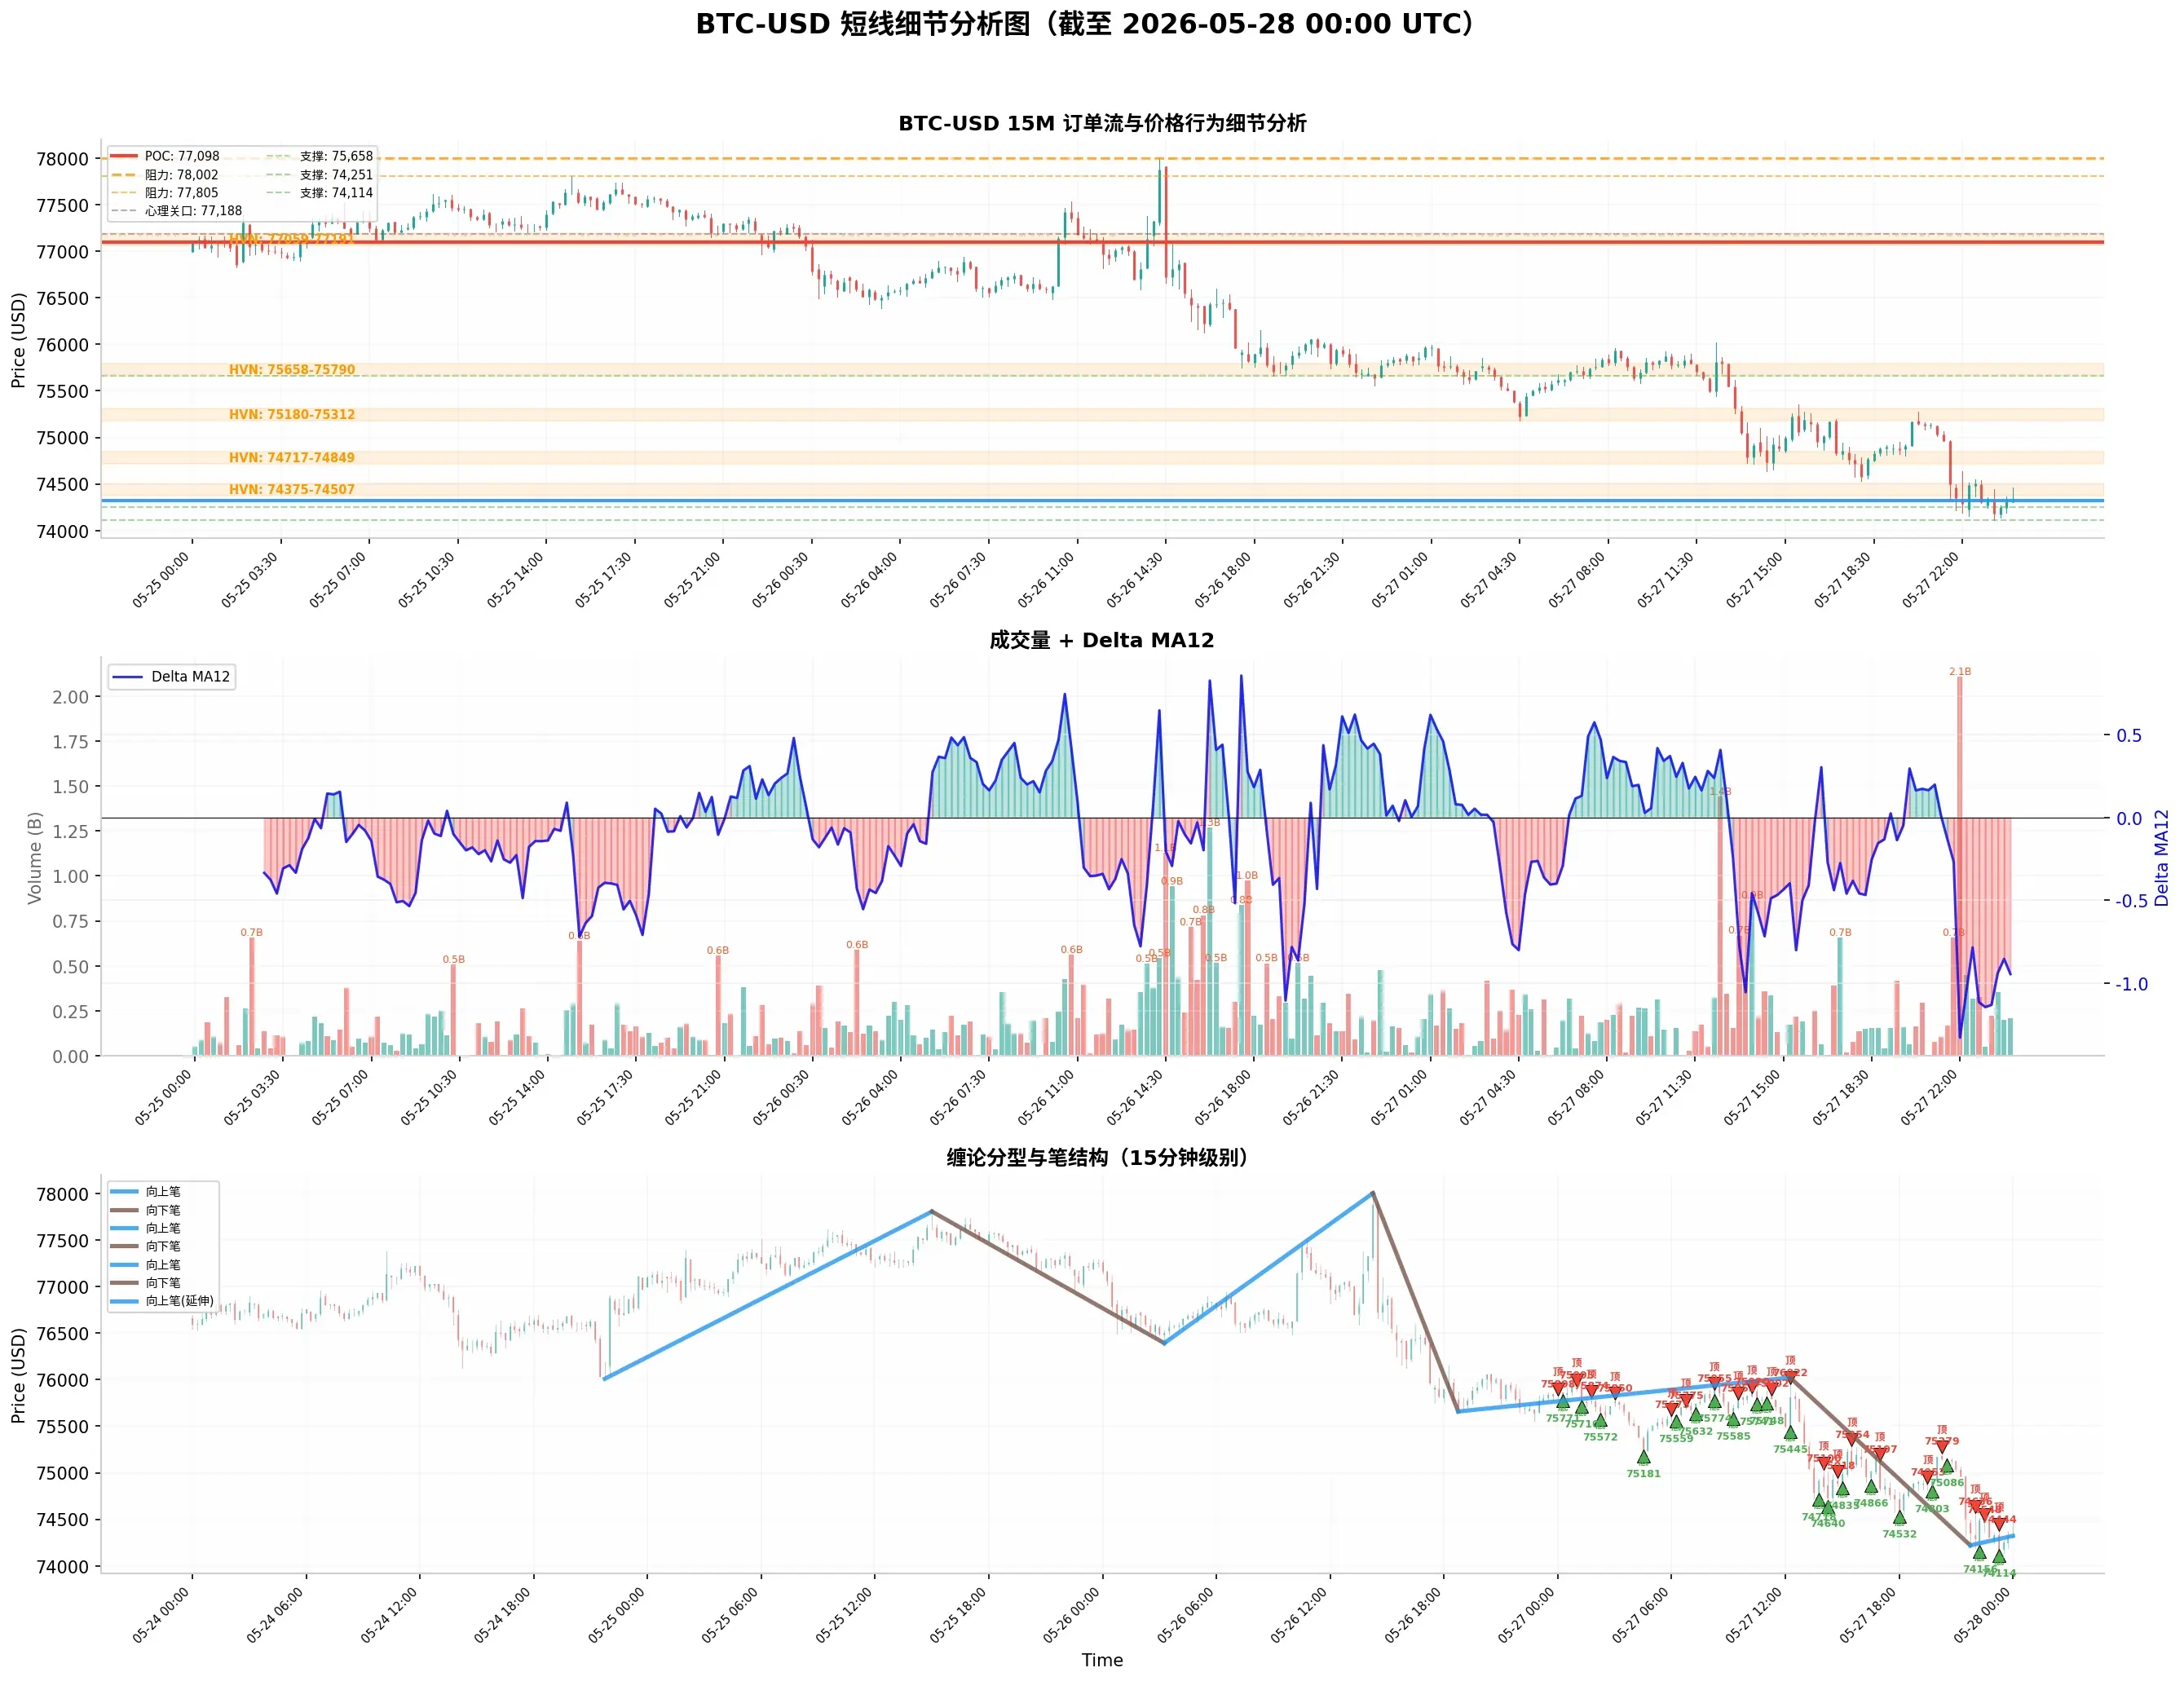
Main trend (1-hour level): The medium-term downtrend from the high point of 82,448 on May 10 is still ongoing. The high point of 78,002 on May 26 became an important turning point in this decline, after which the market entered a "stepwise plunge" mode. On May 27, from 76,022, it plunged to 74,114; on May 28, from 74,462, it crashed to 72,450, hitting a near 10-day low. On May 29, the movement was extremely dramatic—morni
BTC-0.15%
View Original
post-image
post-image
  • Reward
  • Comment
  • Repost
  • Share
Based on Dow Theory, Chan Theory, Wave Theory, Volume-Price Relationship, Order Flow, and Price Action Analysis of BTC Short-term Trends (Strategy Recommendations)
$BTC Comprehensive Judgment
Dow Theory indicates the main trend is downward but with diminishing downside momentum, suggesting a short-term trend of intense oscillation, with key levels at 74,000–74,500 (upper) and 72,384 (lower).
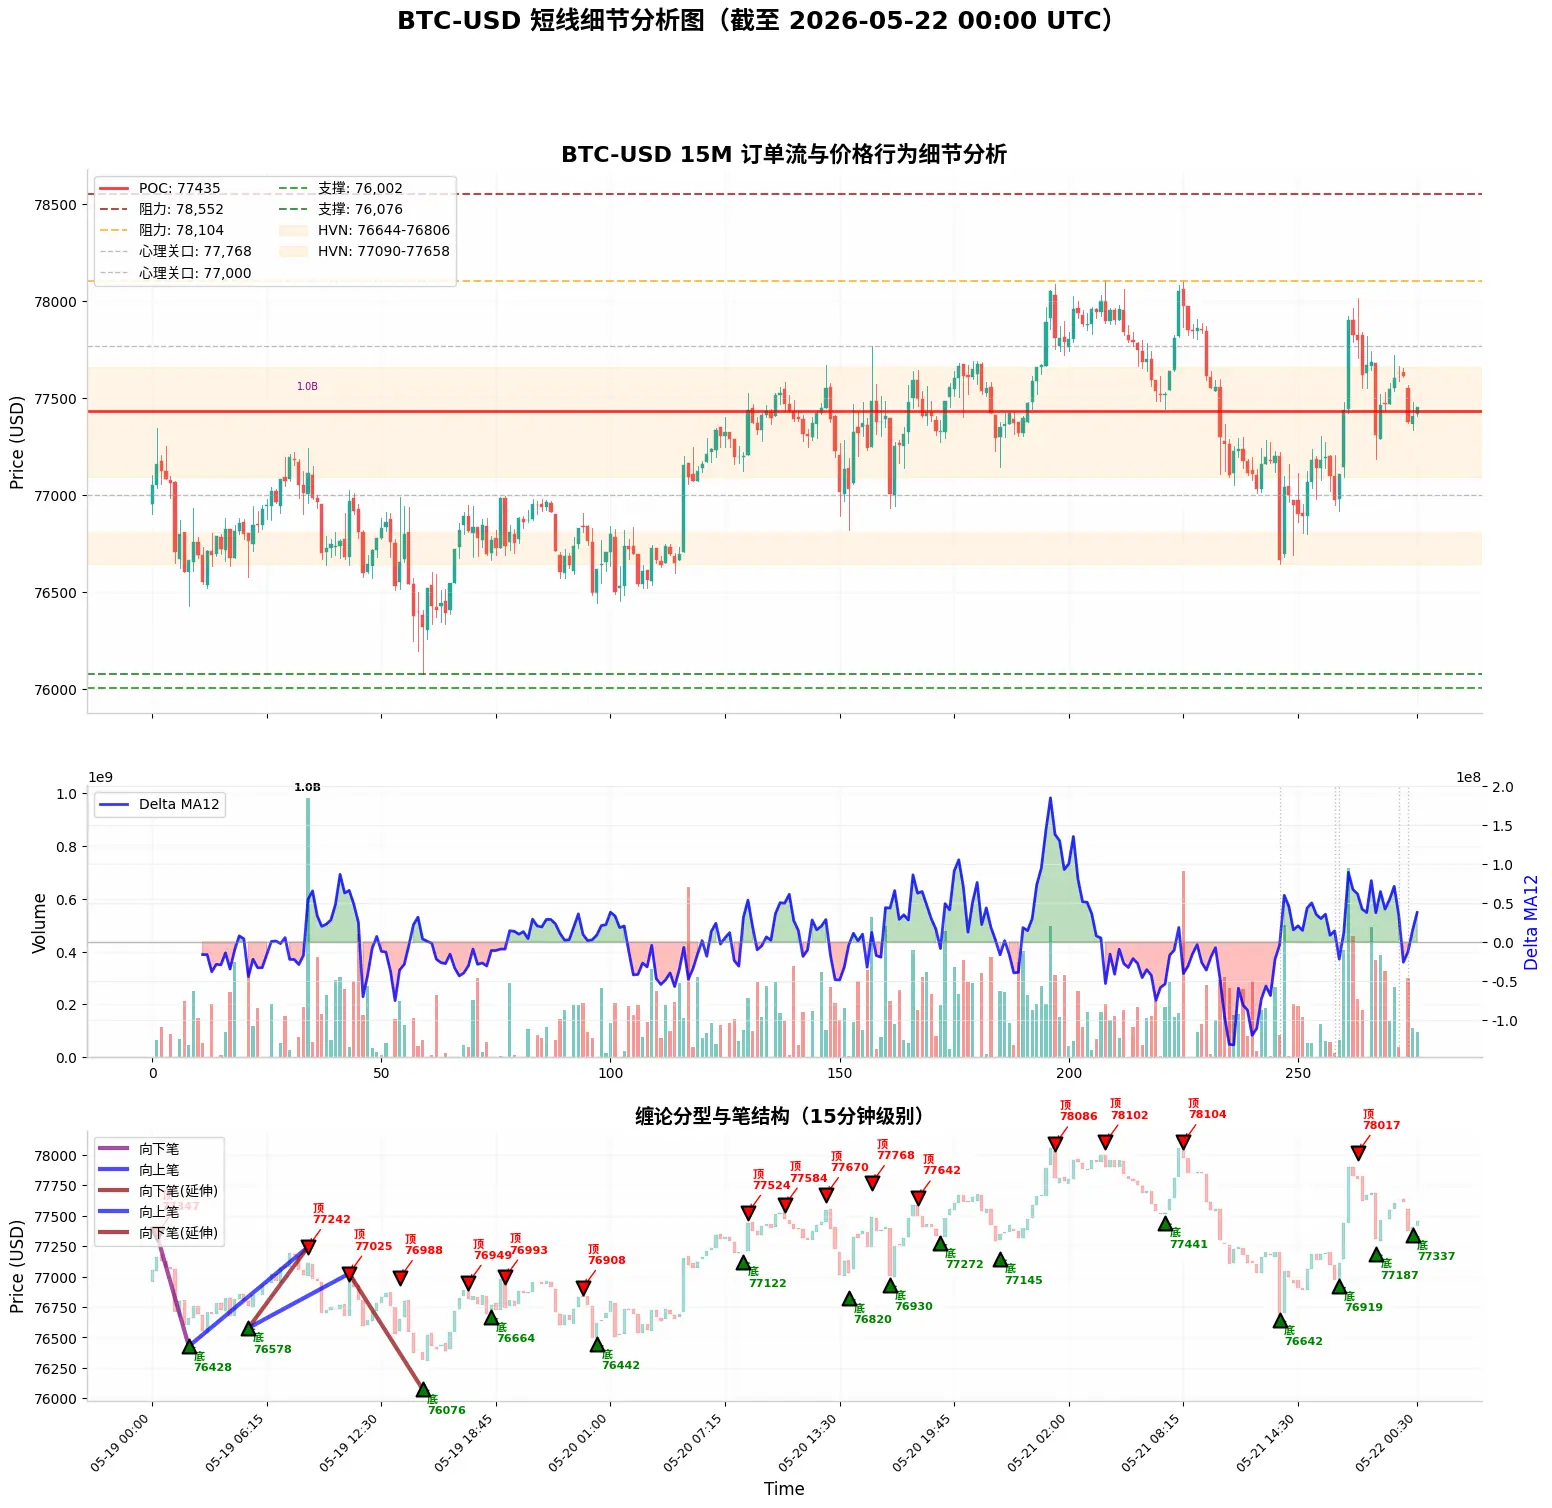
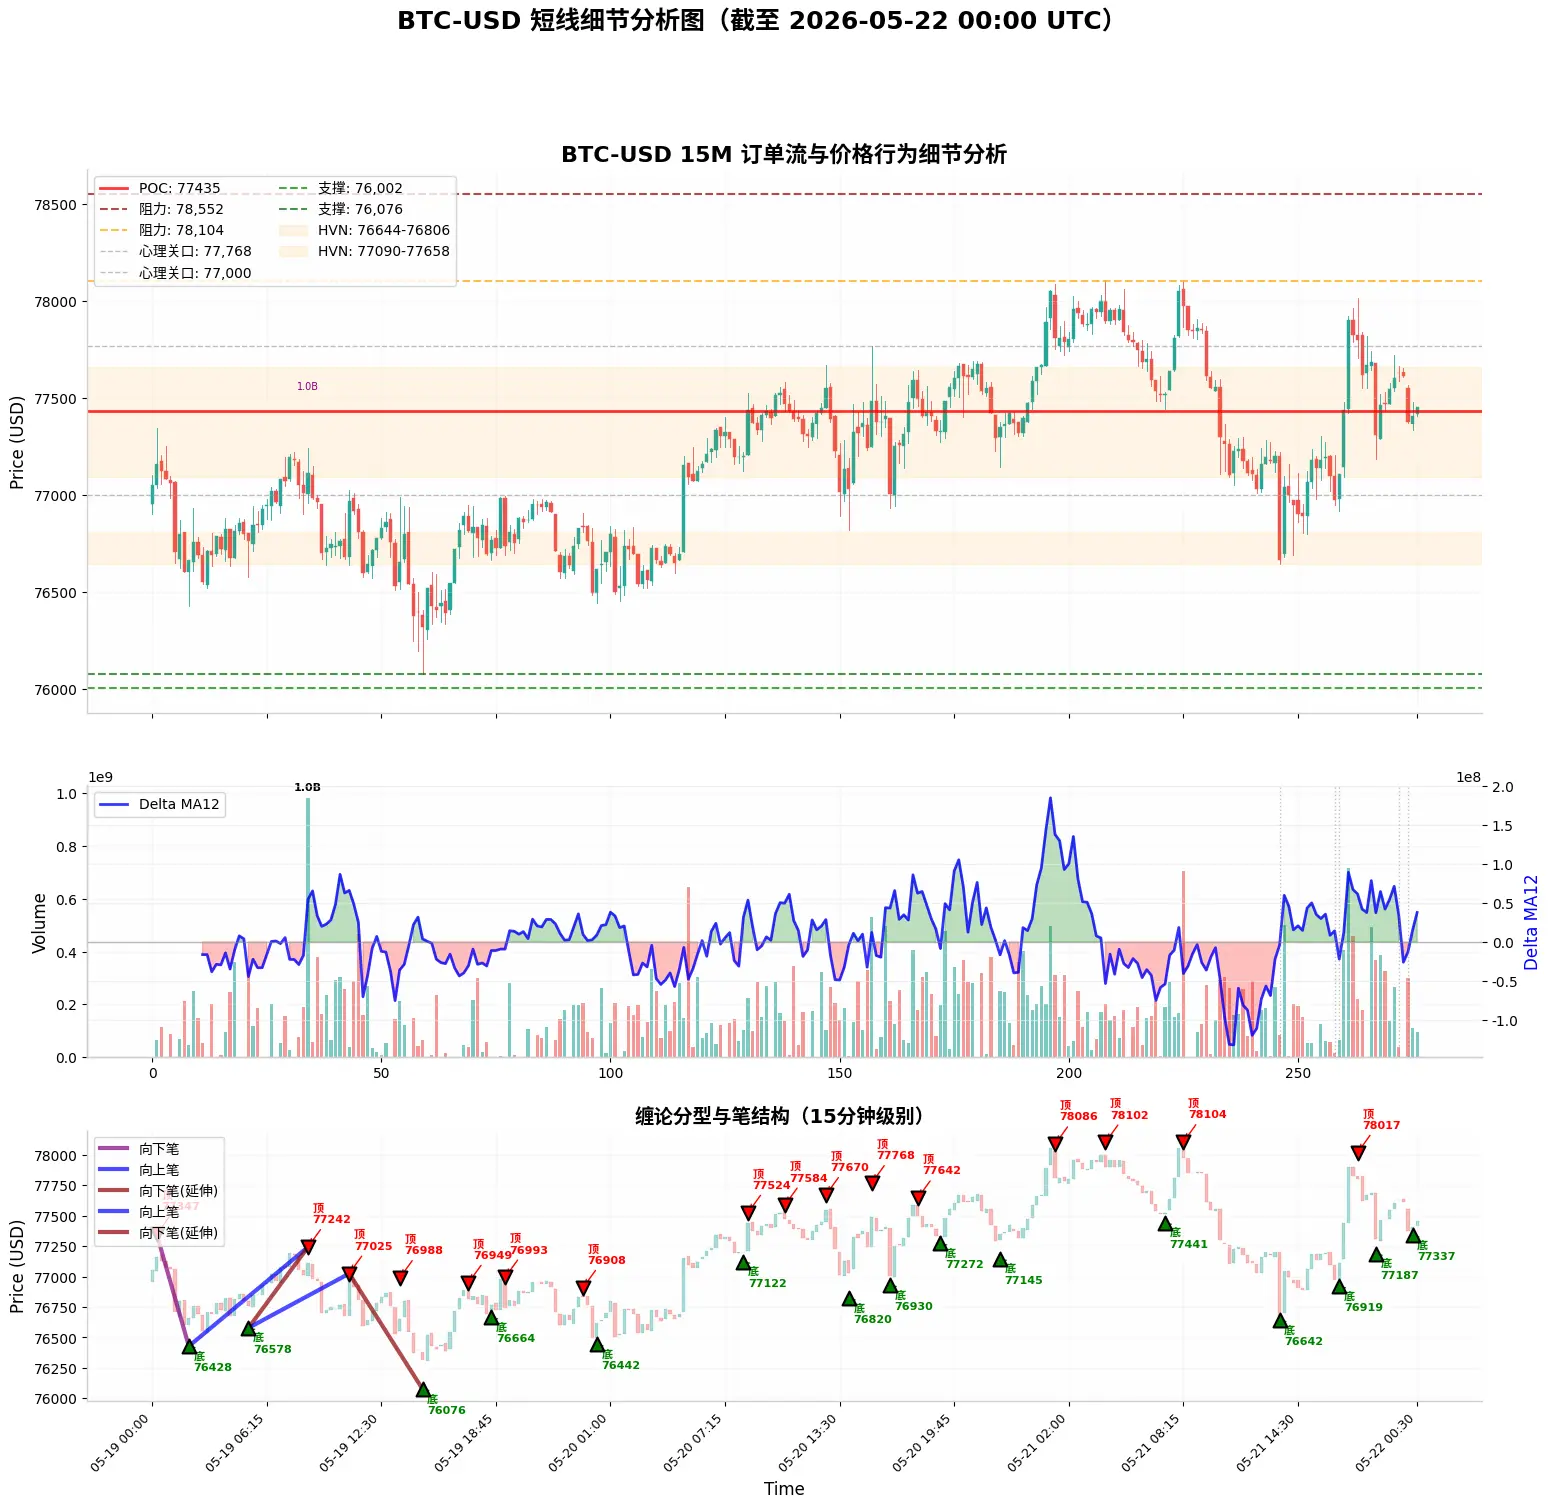
Chan Theory shows that the downward strokes remain strong, but the upward strokes have increased from +467, +348 to +1,772, indicating that the bulls' support strength has significantly strengthened, and
BTC-0.15%
View Original
post-image
post-image
  • Reward
  • Comment
  • Repost
  • Share
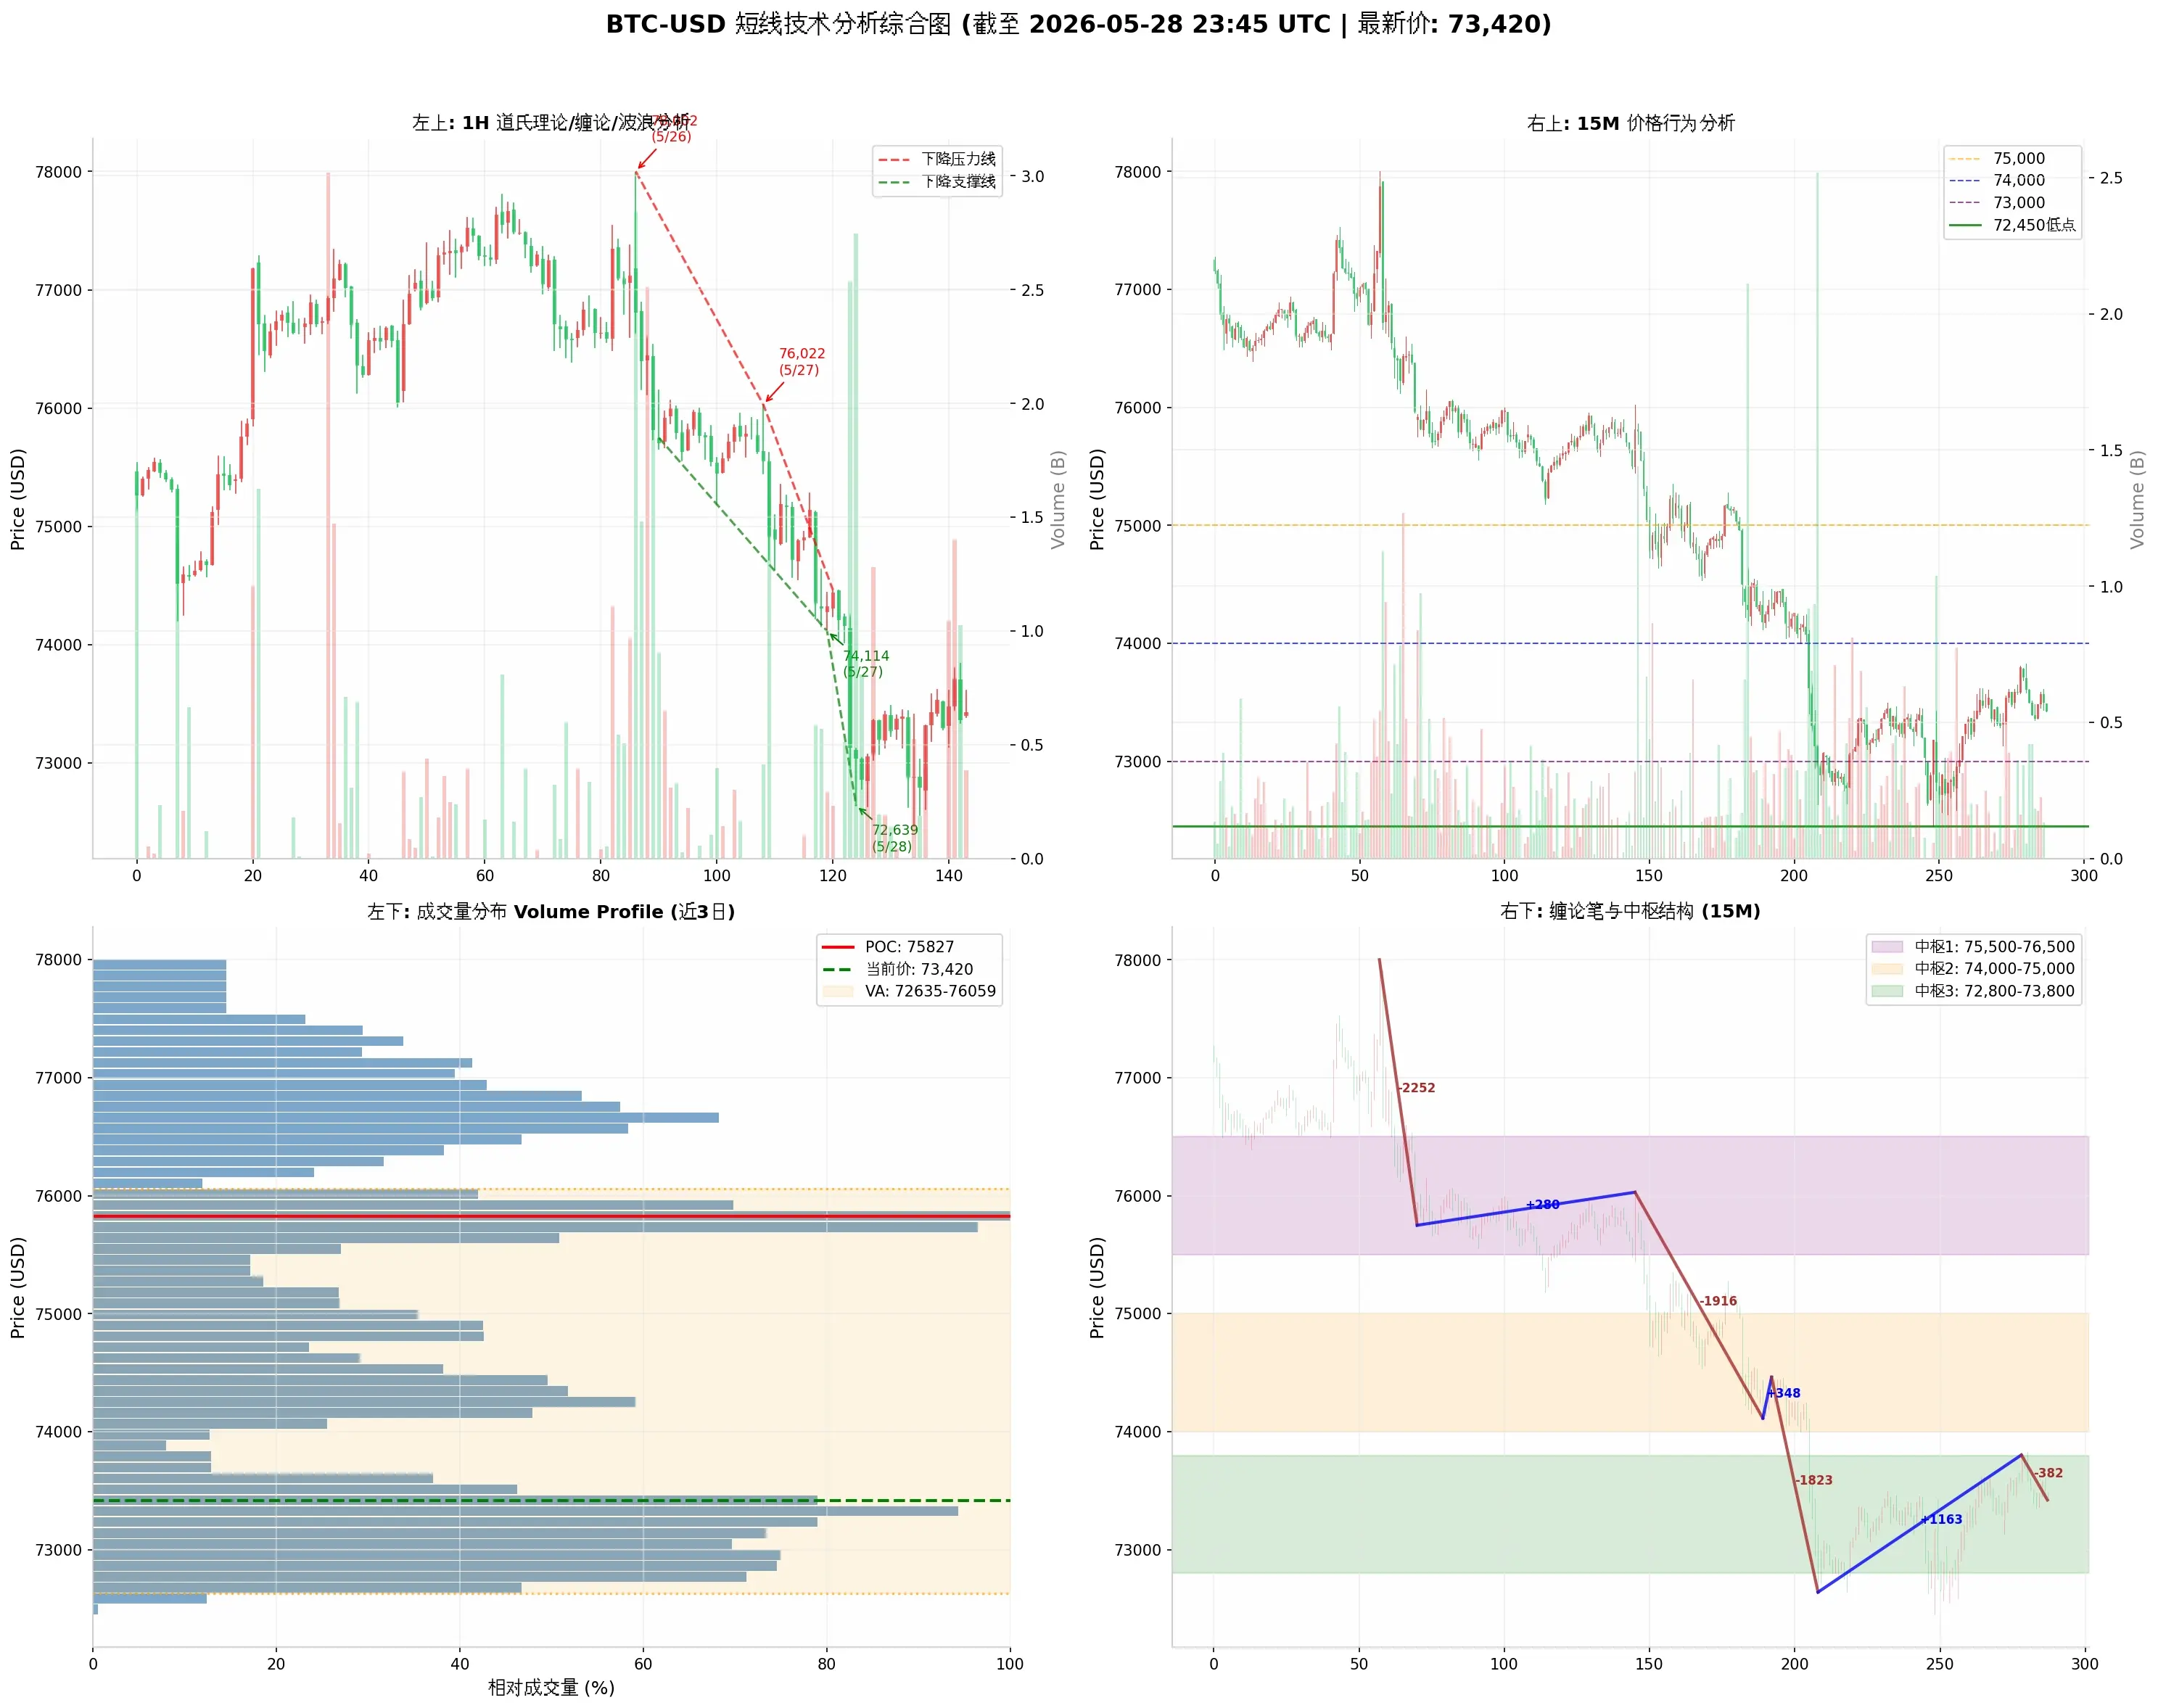
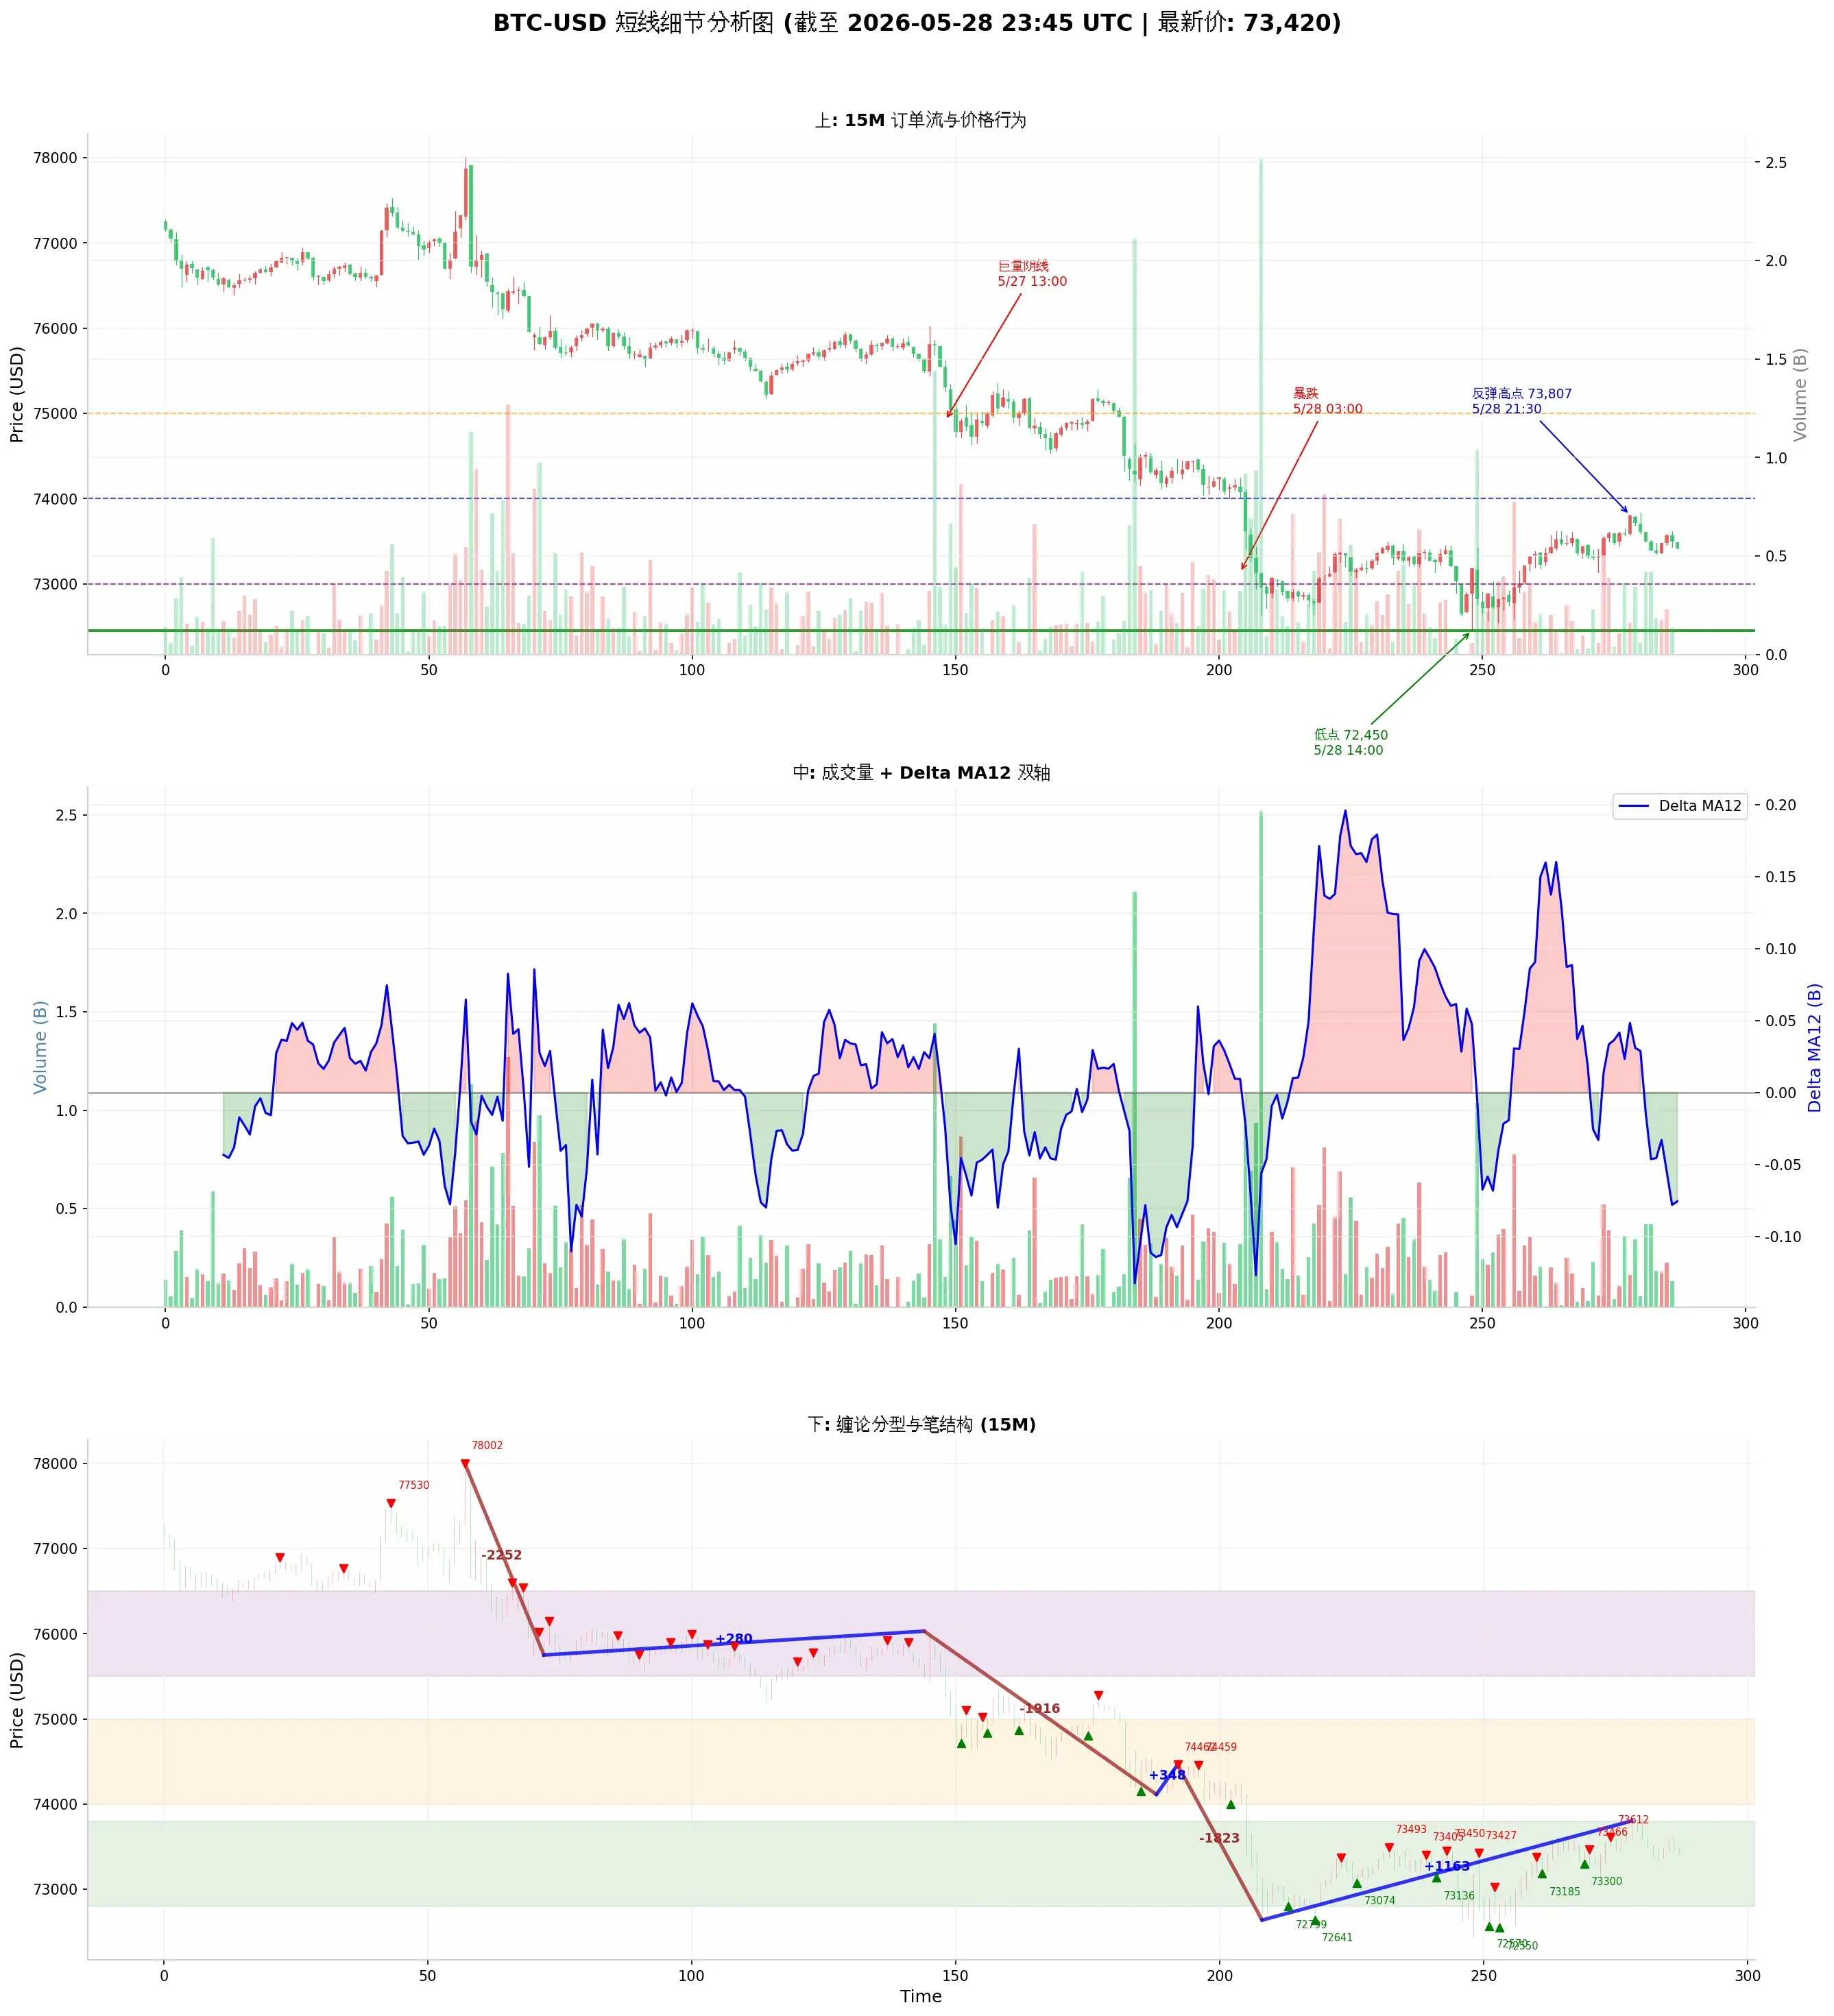
From Dow Theory, Chan Theory, Wave Theory, Volume-Price Relationship, Order Flow, and Price Action, a shallow analysis of BTC short-term trend
$BTC
1. Dow Theory (Dow Theory)
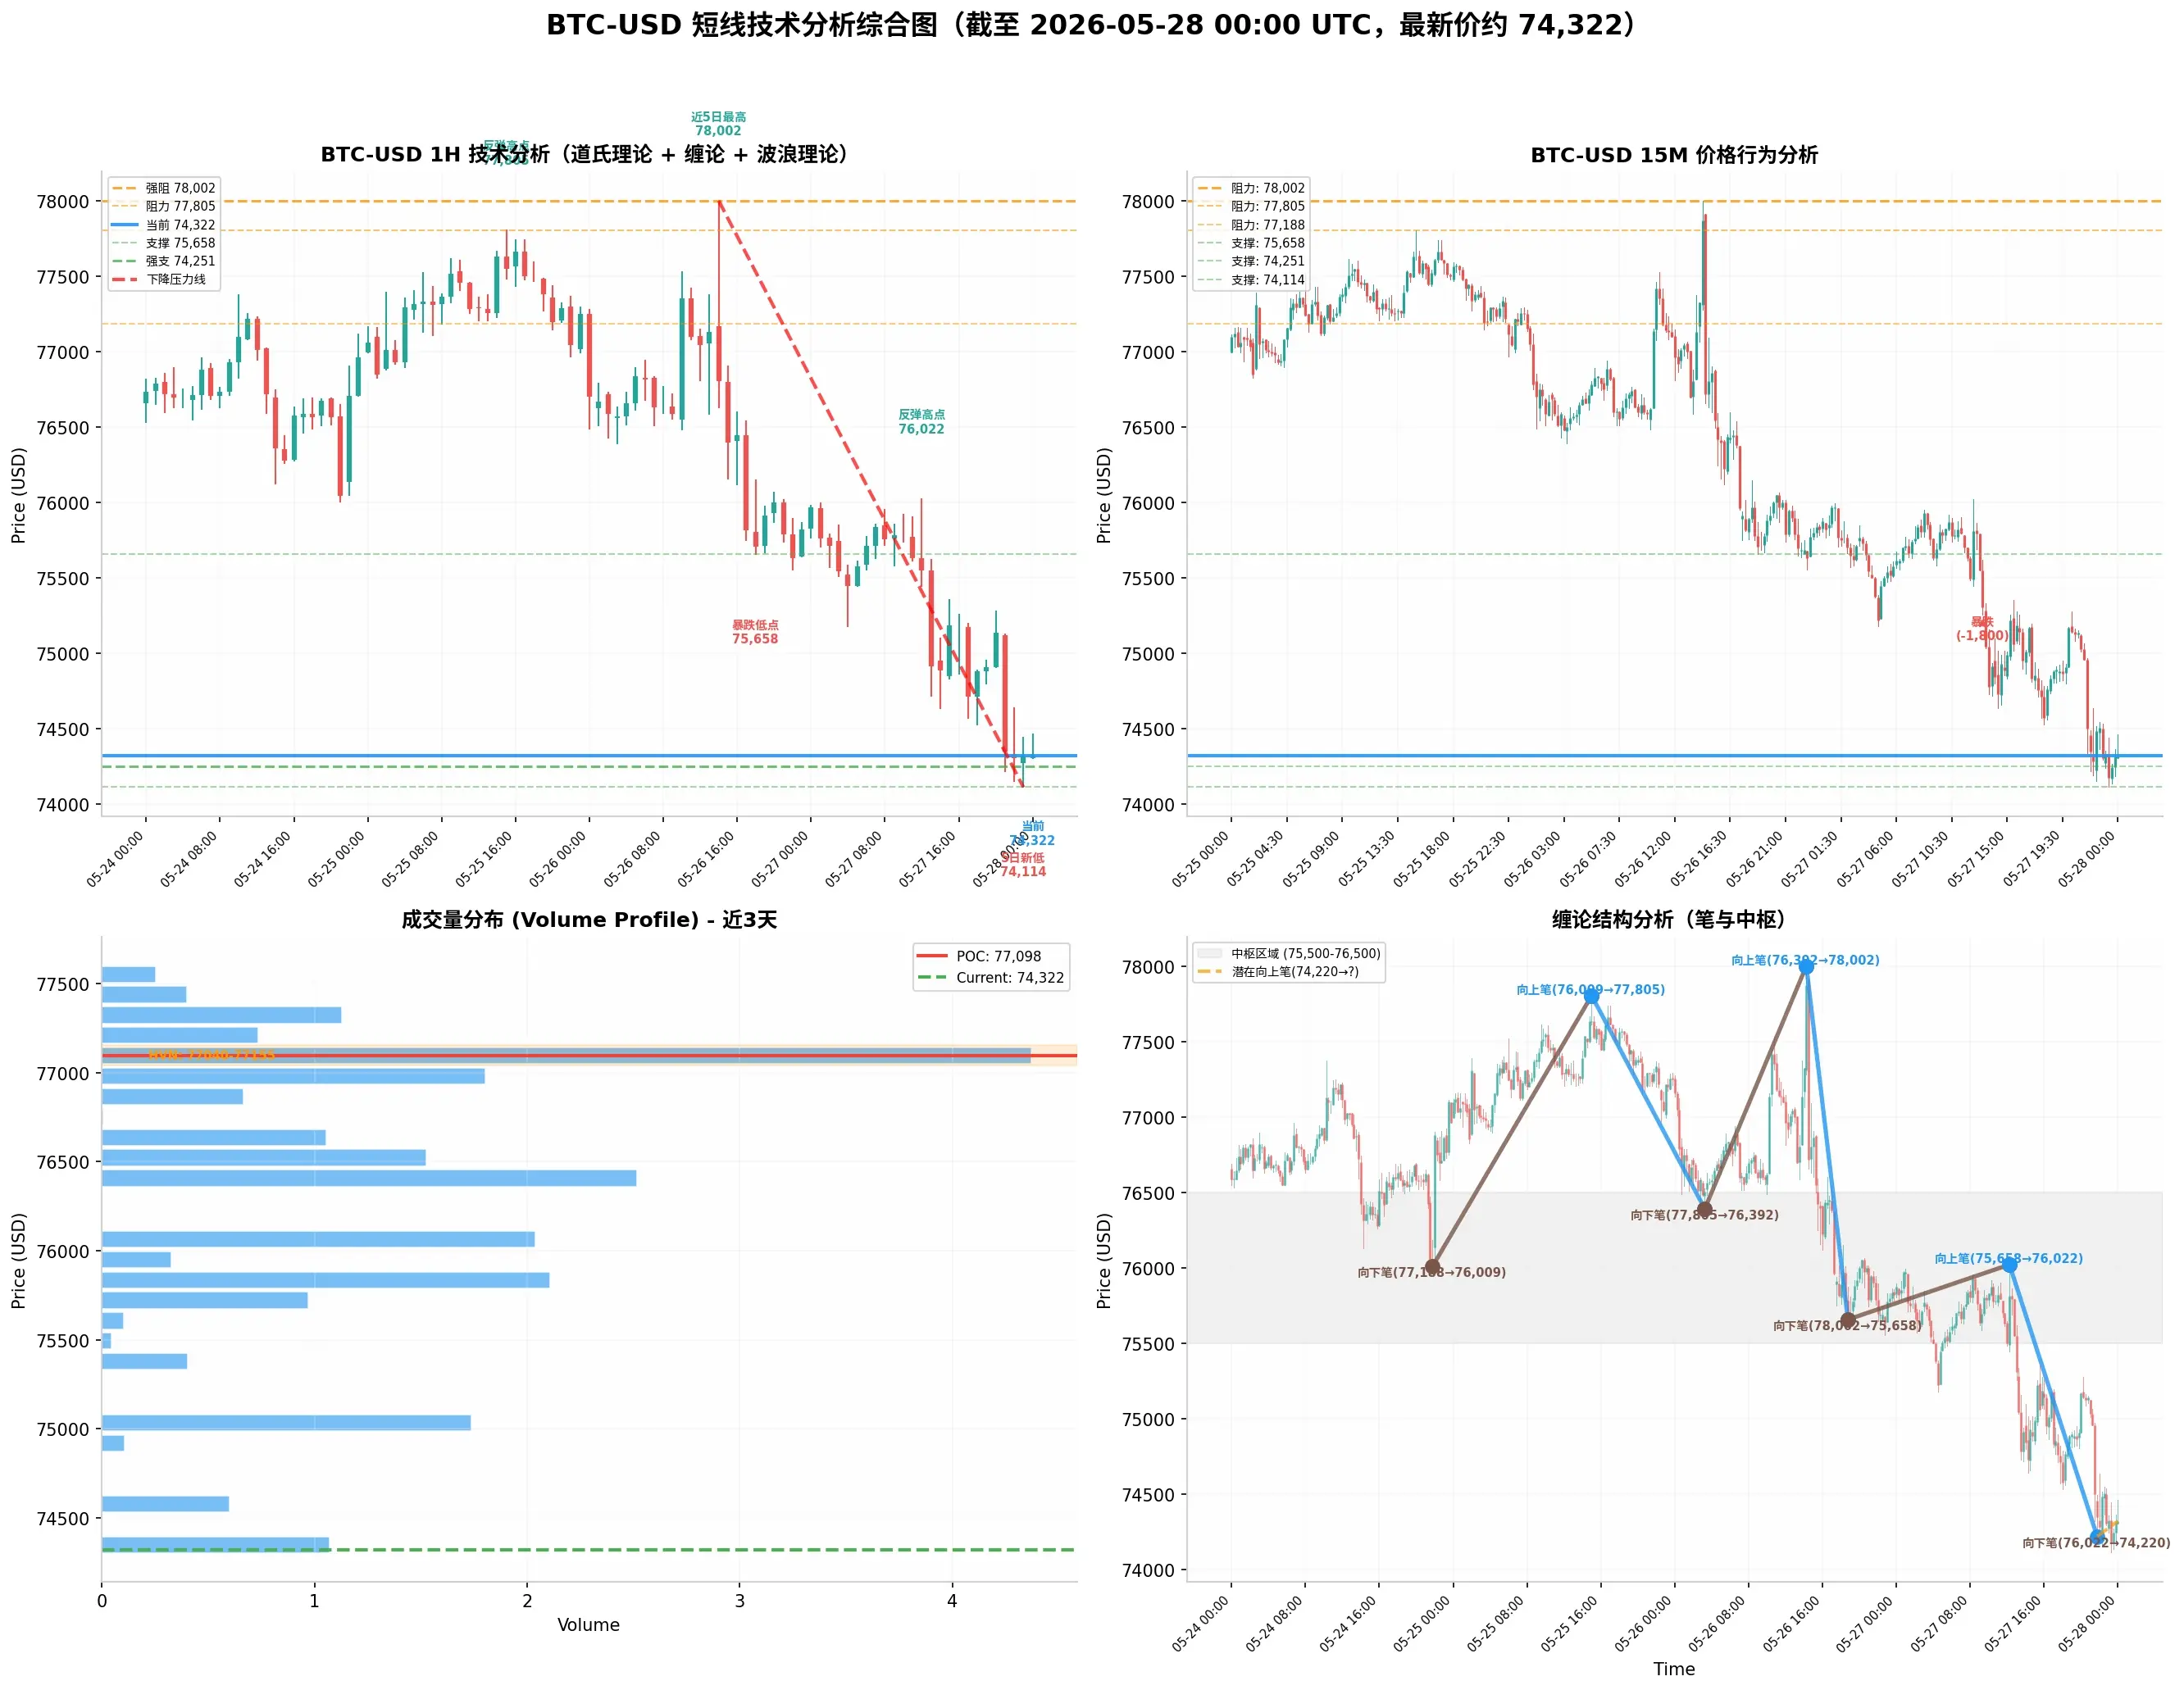
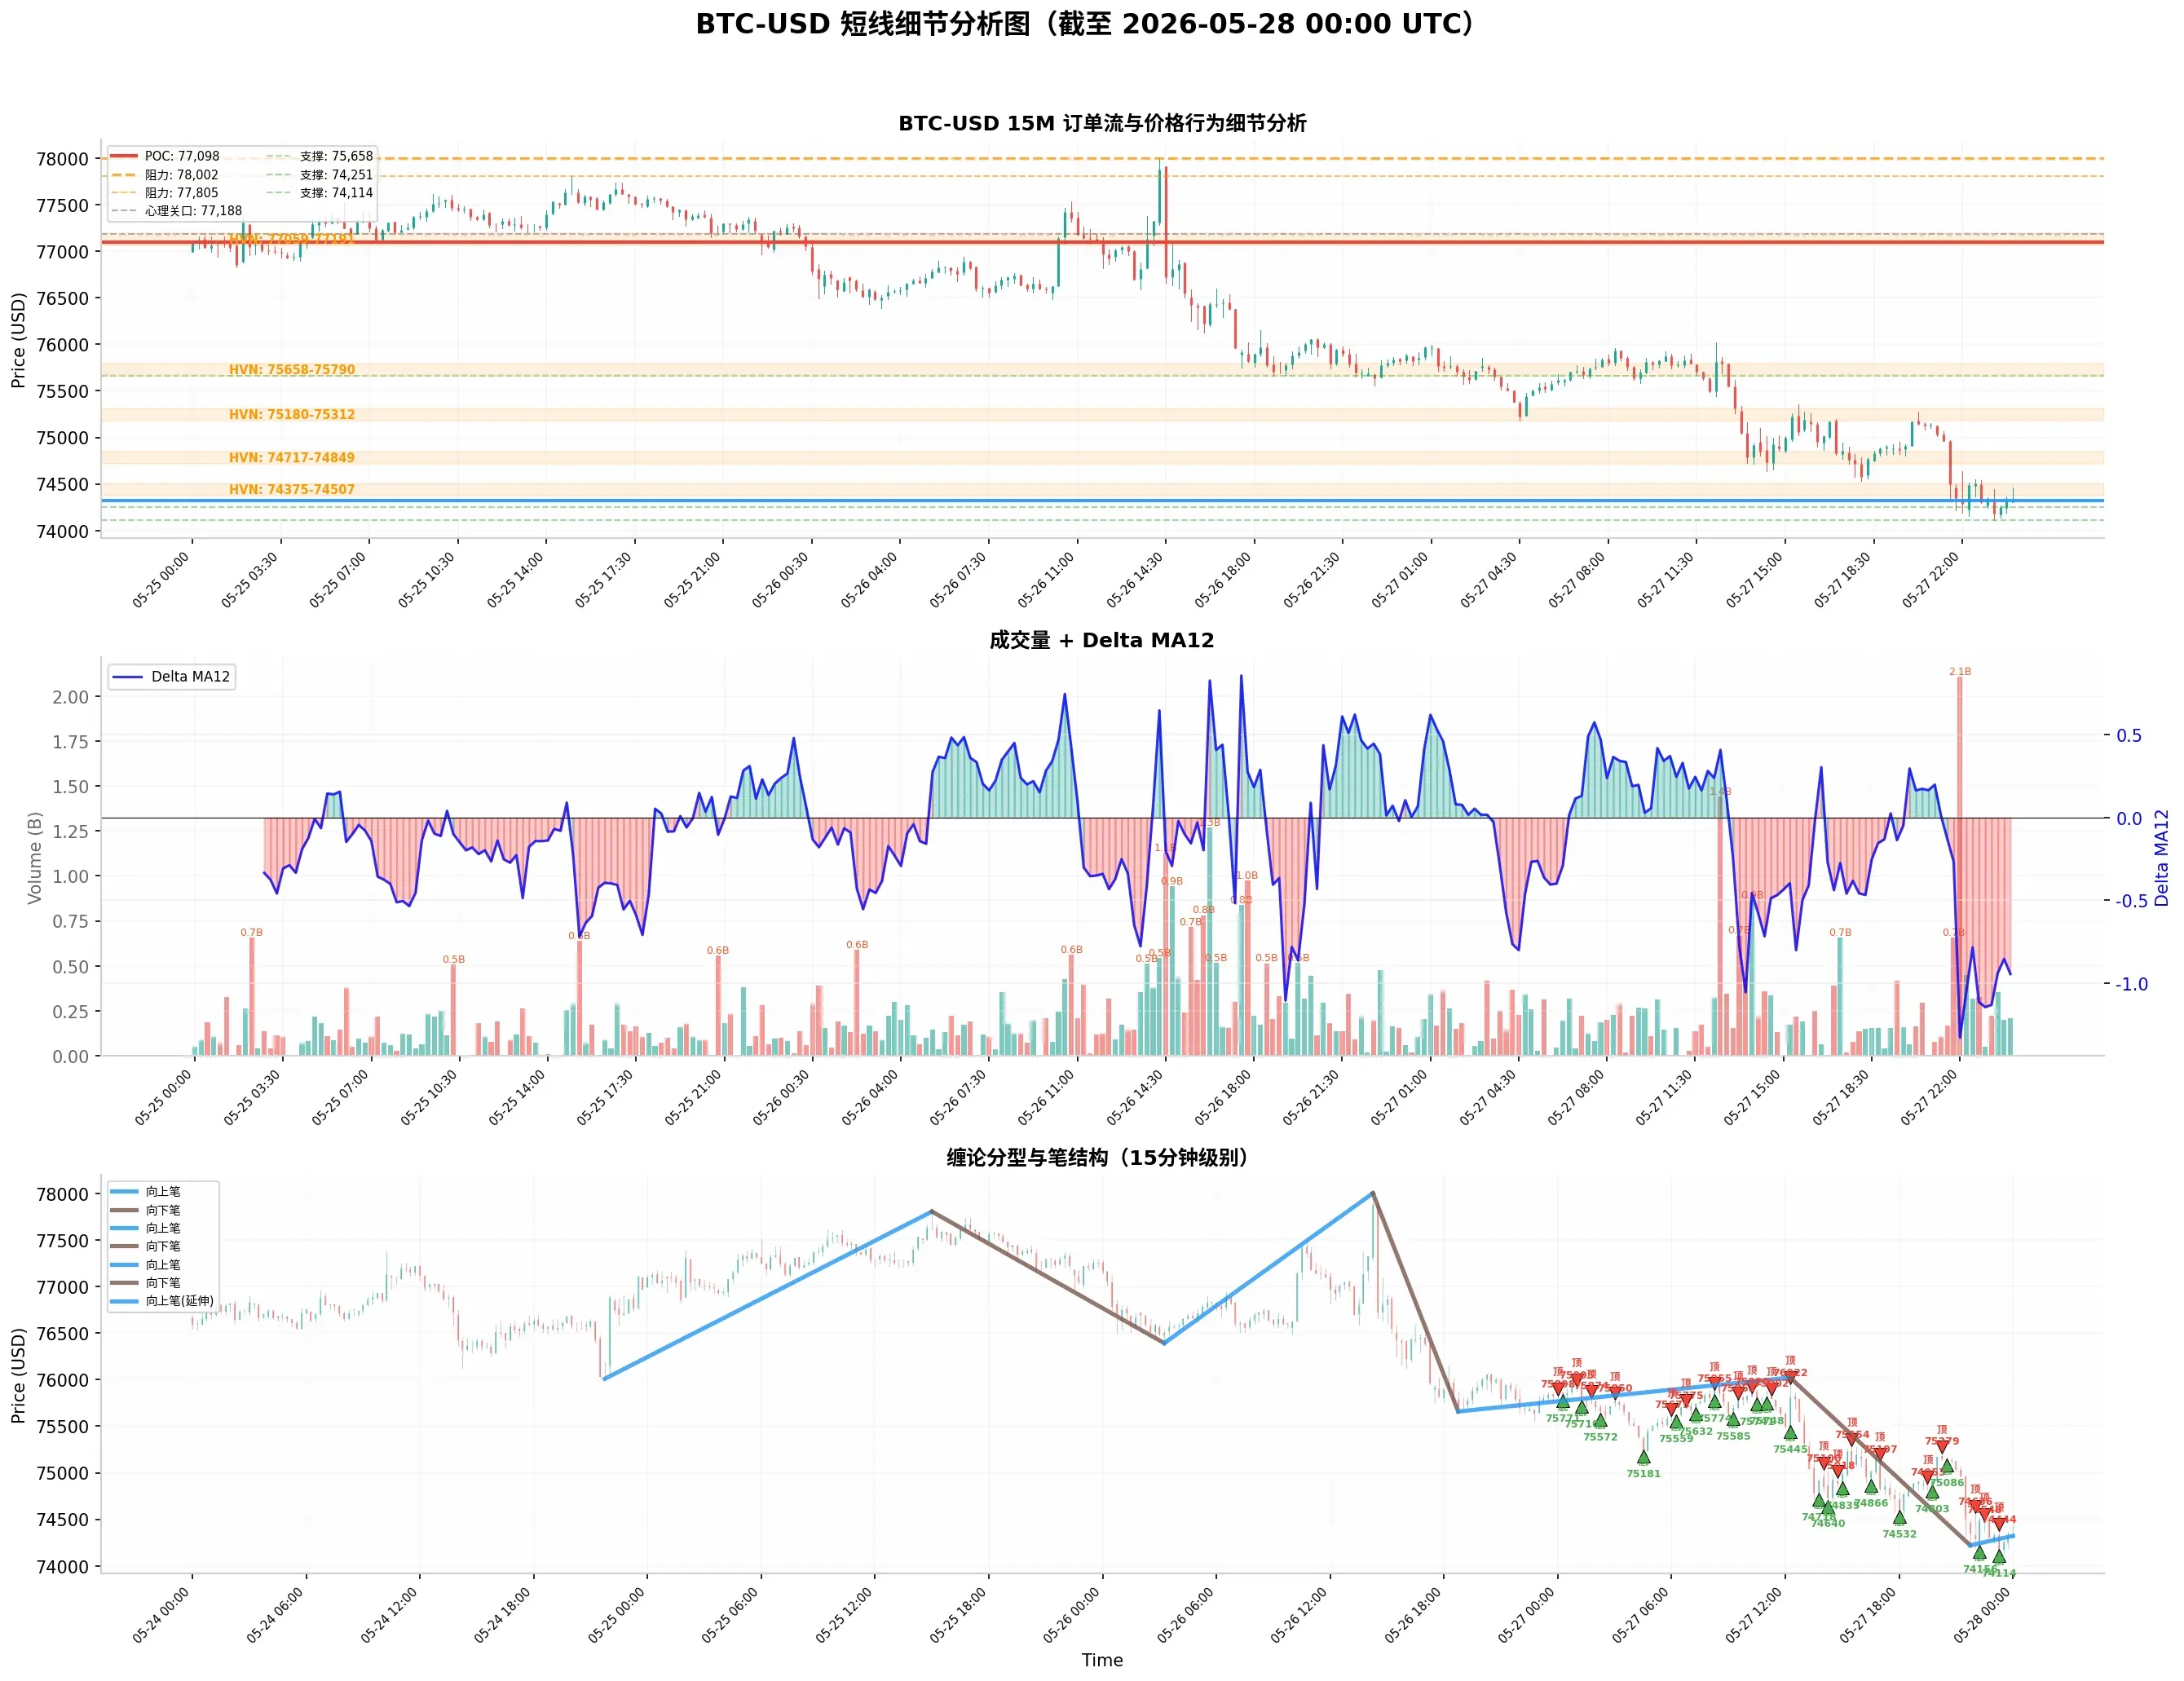
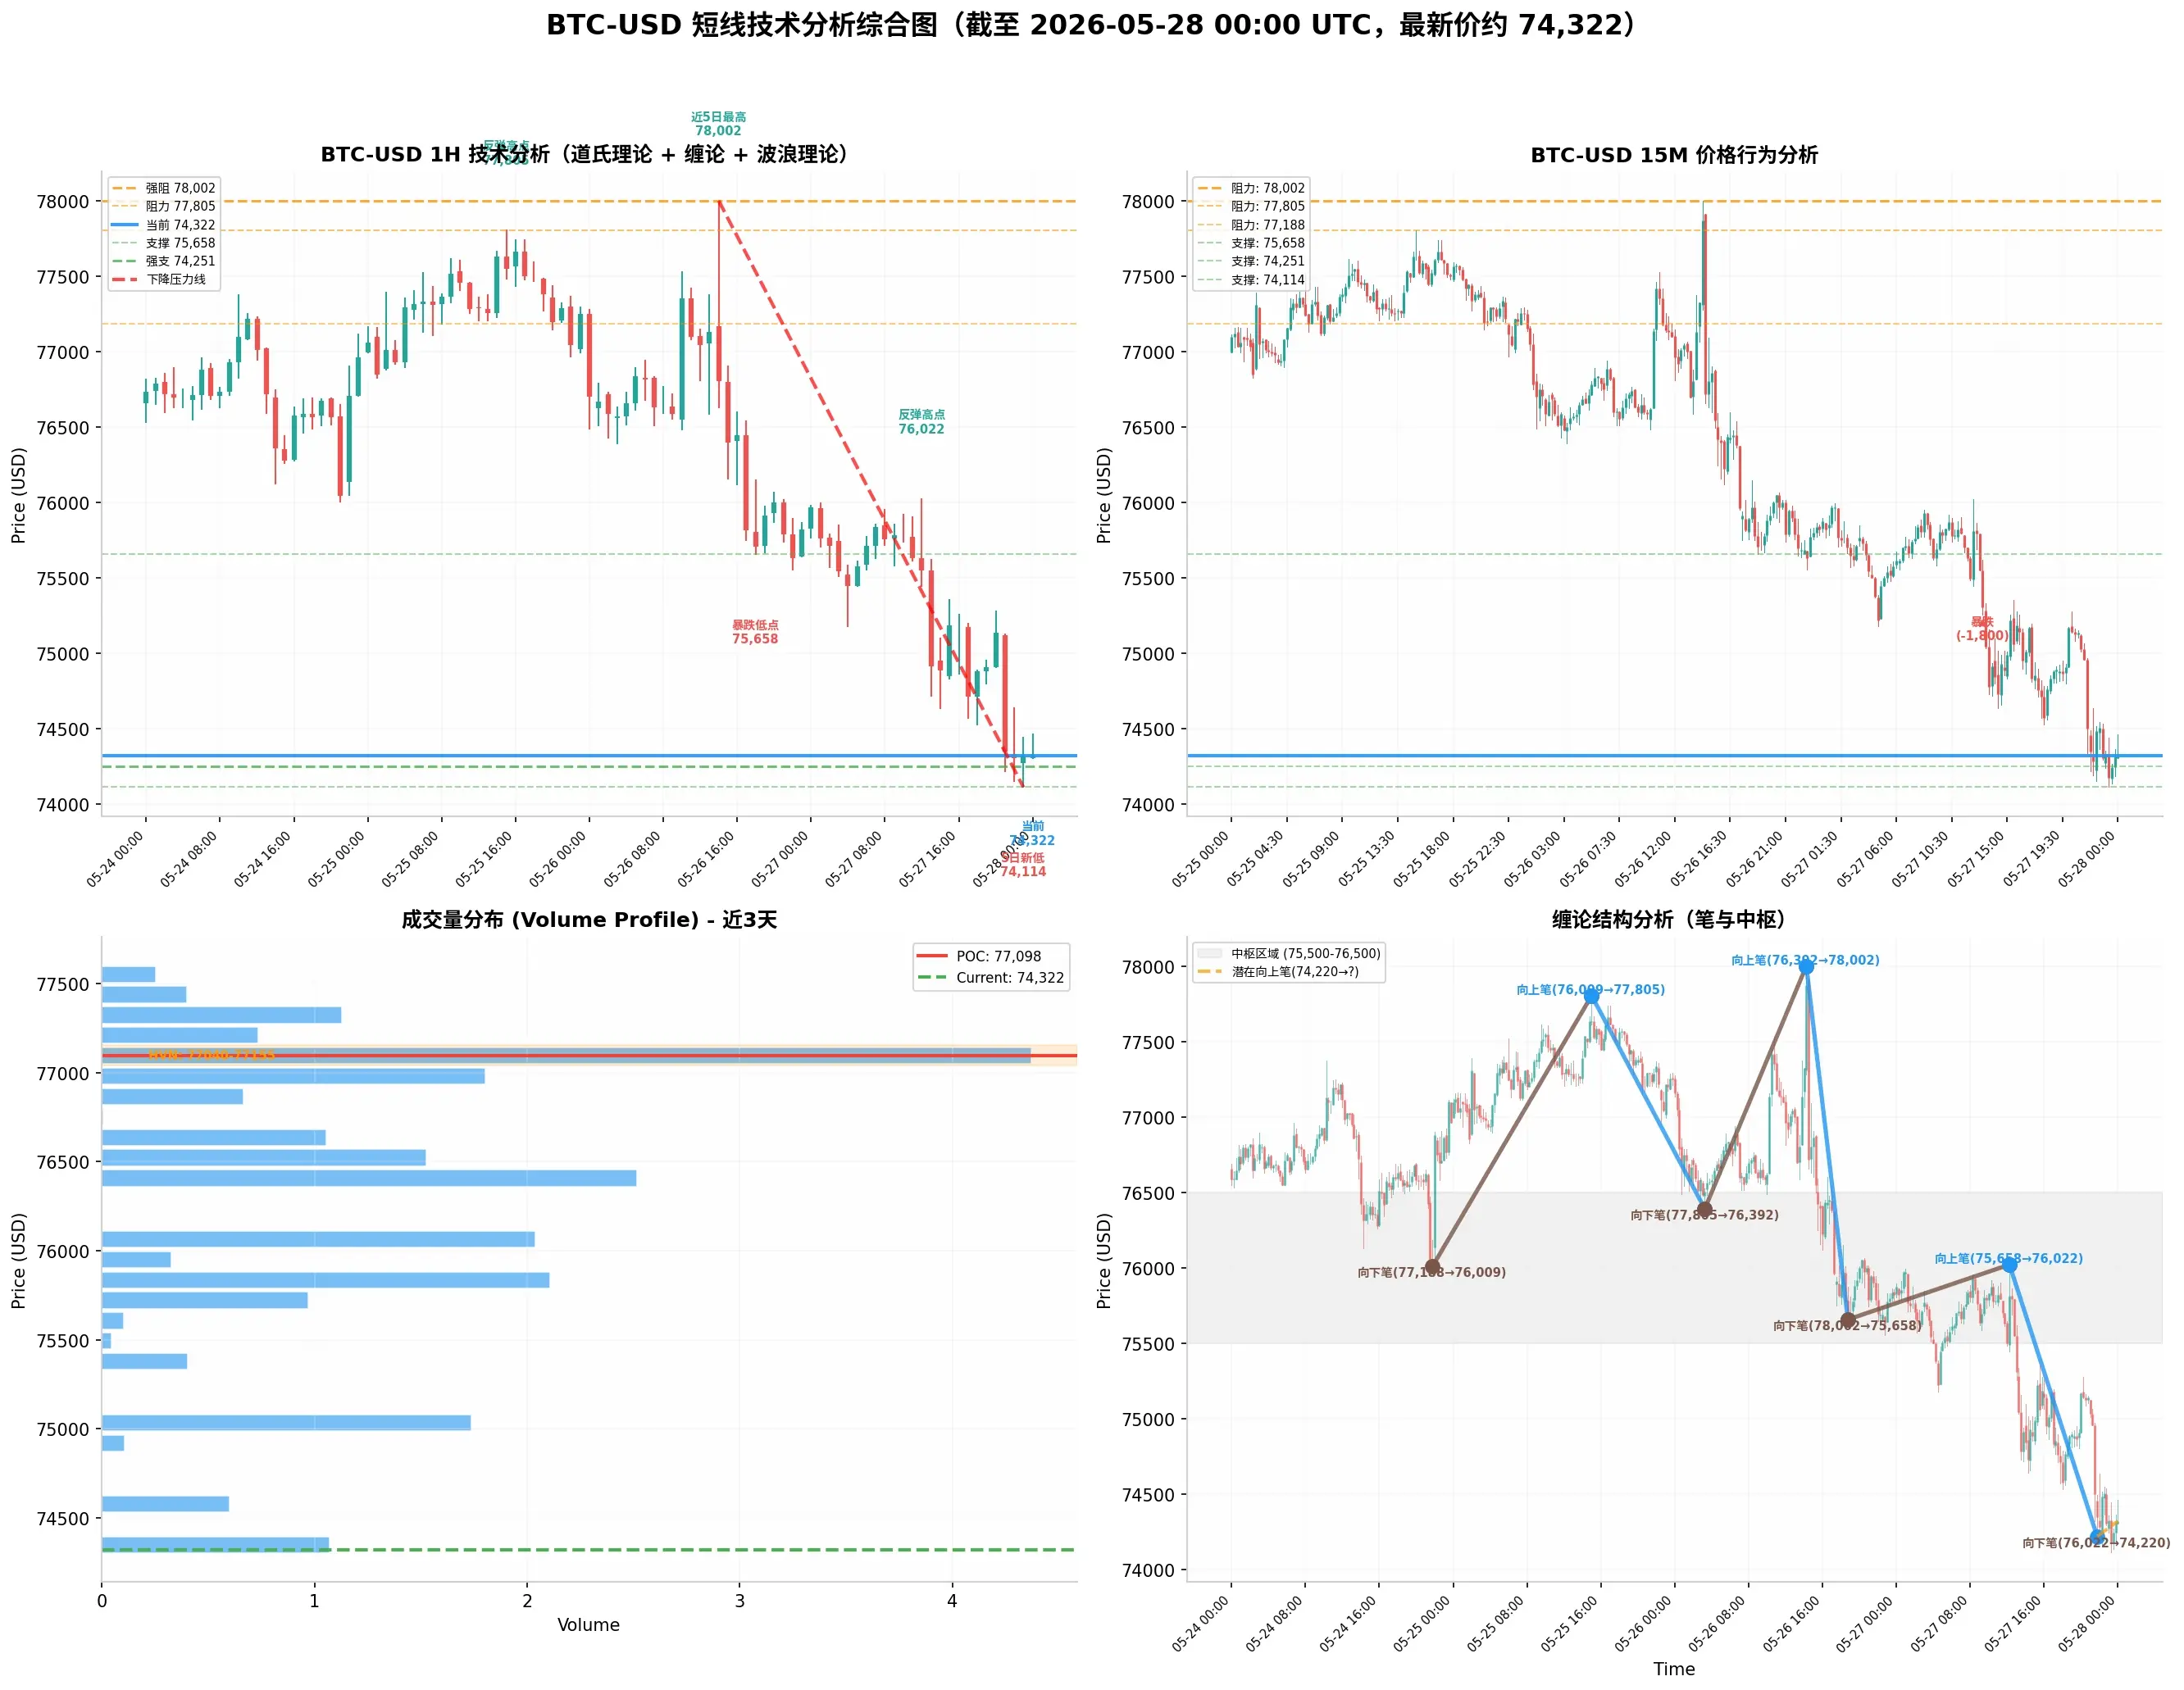
Main trend (1-hour level): The medium-term downtrend from the high point of 82,448 on May 10 continues and is accelerating. The high point of 78,002 on May 26 has become a key turning point in this decline, after which the market entered a "stepwise crash" mode. On May 27, it plummeted from around 75,800 to 74,114, briefly rebounded to 74,462 in the early morning of May 28, then again sharply dropped to 72,639, tou
BTC-0.15%
View Original
post-image
post-image
  • Reward
  • Comment
  • Repost
  • Share
Based on Dow Theory, Chan Theory, Wave Theory, Volume-Price Relationship, Order Flow, and Price Action Analysis of BTC Short-term Trends (Strategy Recommendations)
$BTC
Comprehensive Judgment
Dow Theory indicates a primary trend that is downward and accelerating, with a short-term trend that is steeply declining. Key levels are at 74,500 (upside) and 72,450 (downside).
Chan Theory shows very strong downward strokes (-1,823, -1,916, -2,252) far exceeding upward strokes (+280, +348), but the current upward stroke (+1,168) has significantly strengthened, with no end signal yet.
Wave Theory sug
BTC-0.15%
View Original
post-image
post-image
  • Reward
  • Comment
  • Repost
  • Share
I have been securely trading digital currencies on the 13-year-old exchange Gate. Join me in participating in the hottest activities right now! https://www.gate.com/campaigns/gold-lucky-draws-s5?ch=3009&ref=BQRGUFxZ&ref_type=132
View Original
post-image
  • Reward
  • Comment
  • Repost
  • Share
Based on Dow Theory, Chan Theory, Elliott Wave Theory, Volume-Price Relationship, Order Flow, and Price Action, a shallow analysis of BTC short-term trend
$BTC
1. Dow Theory
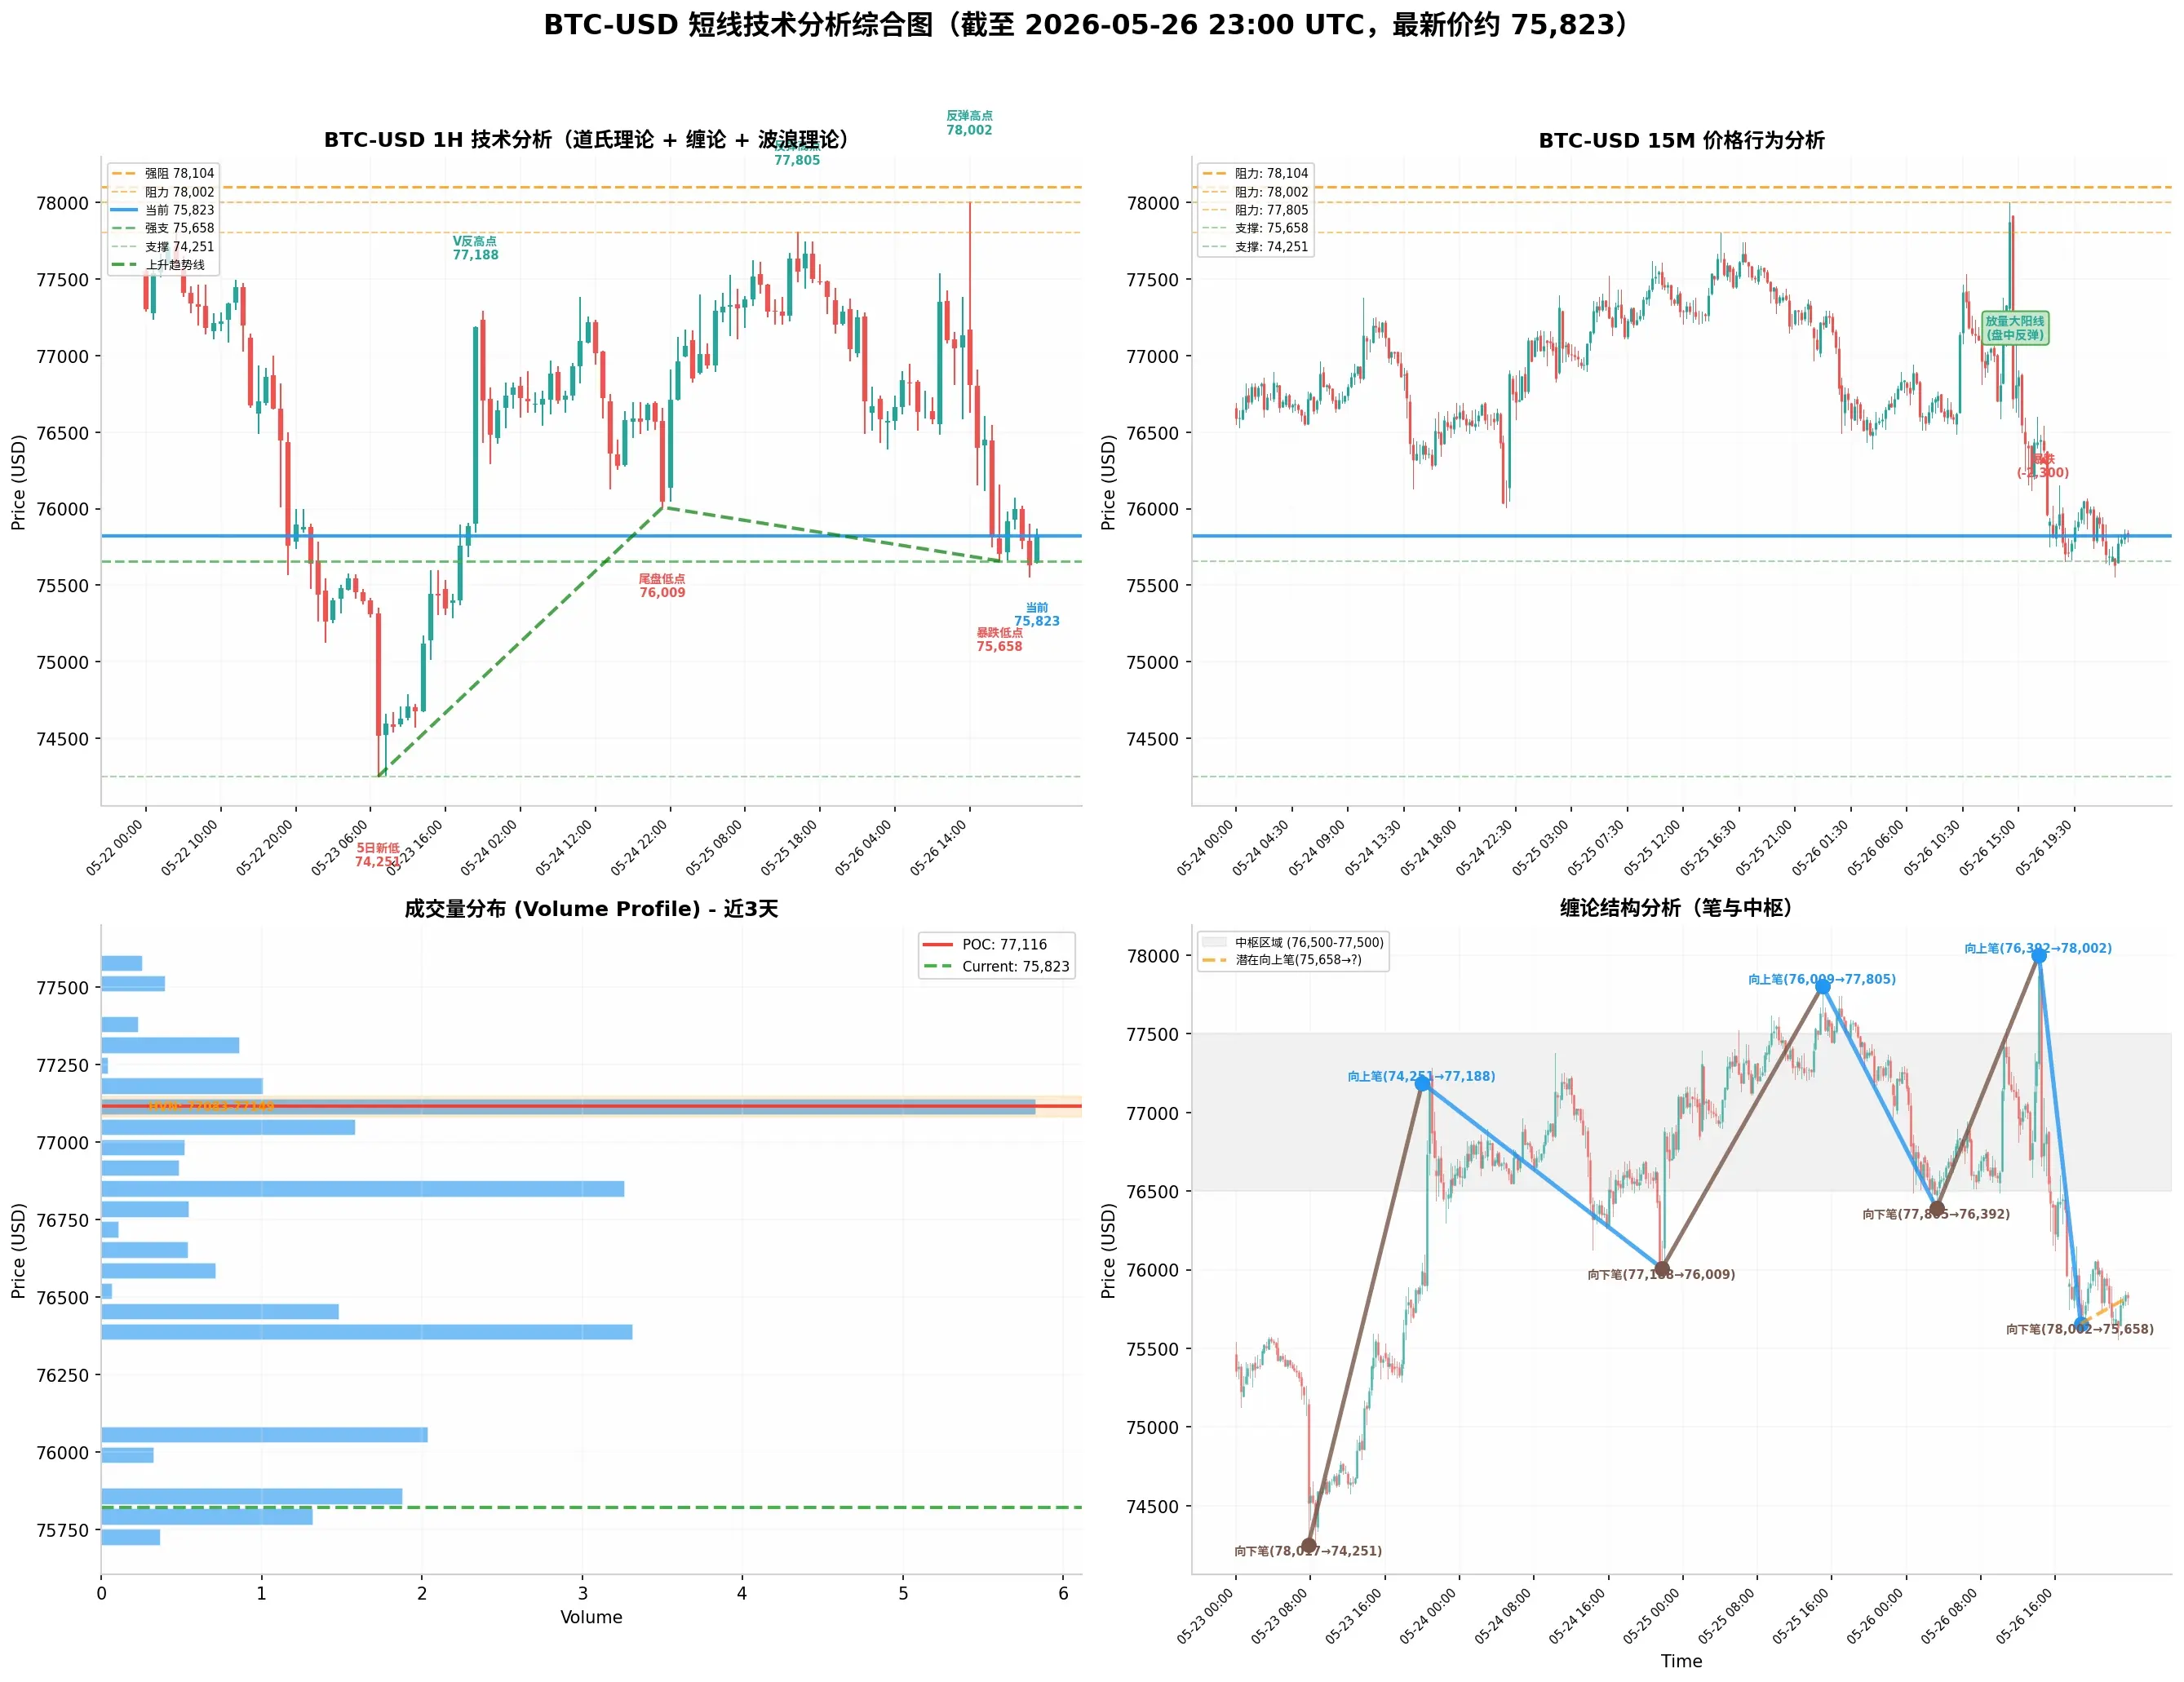
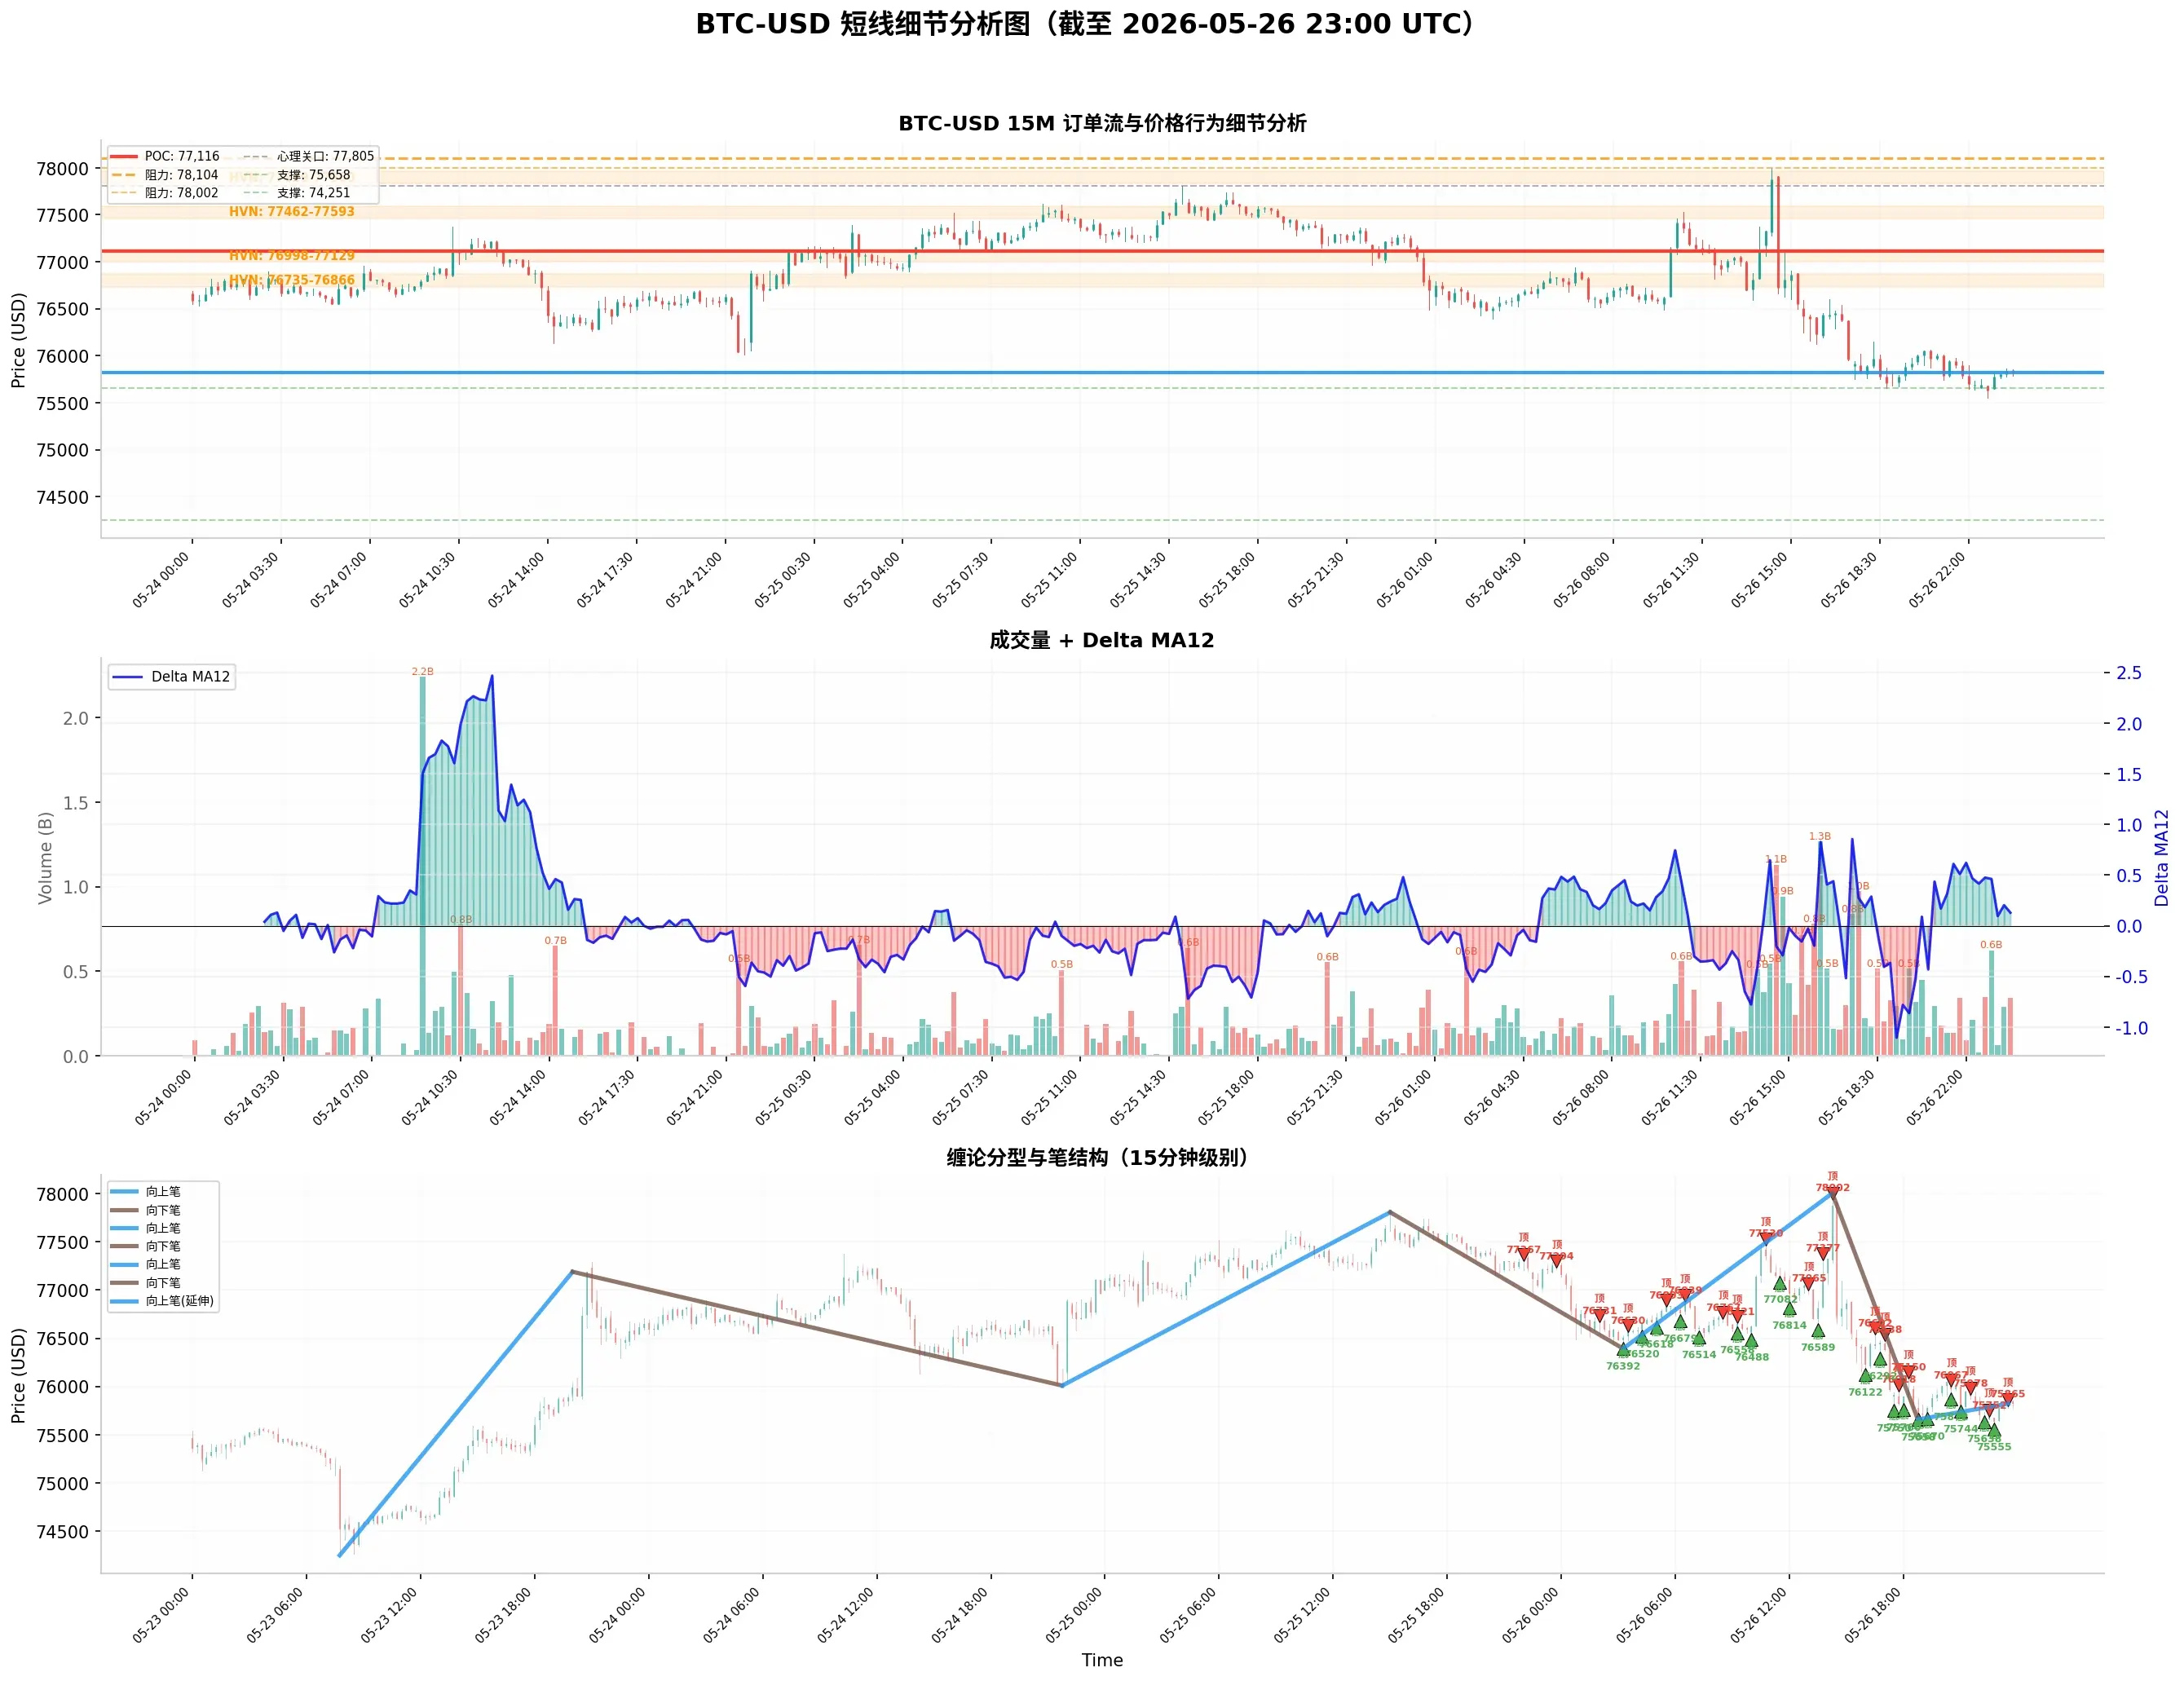
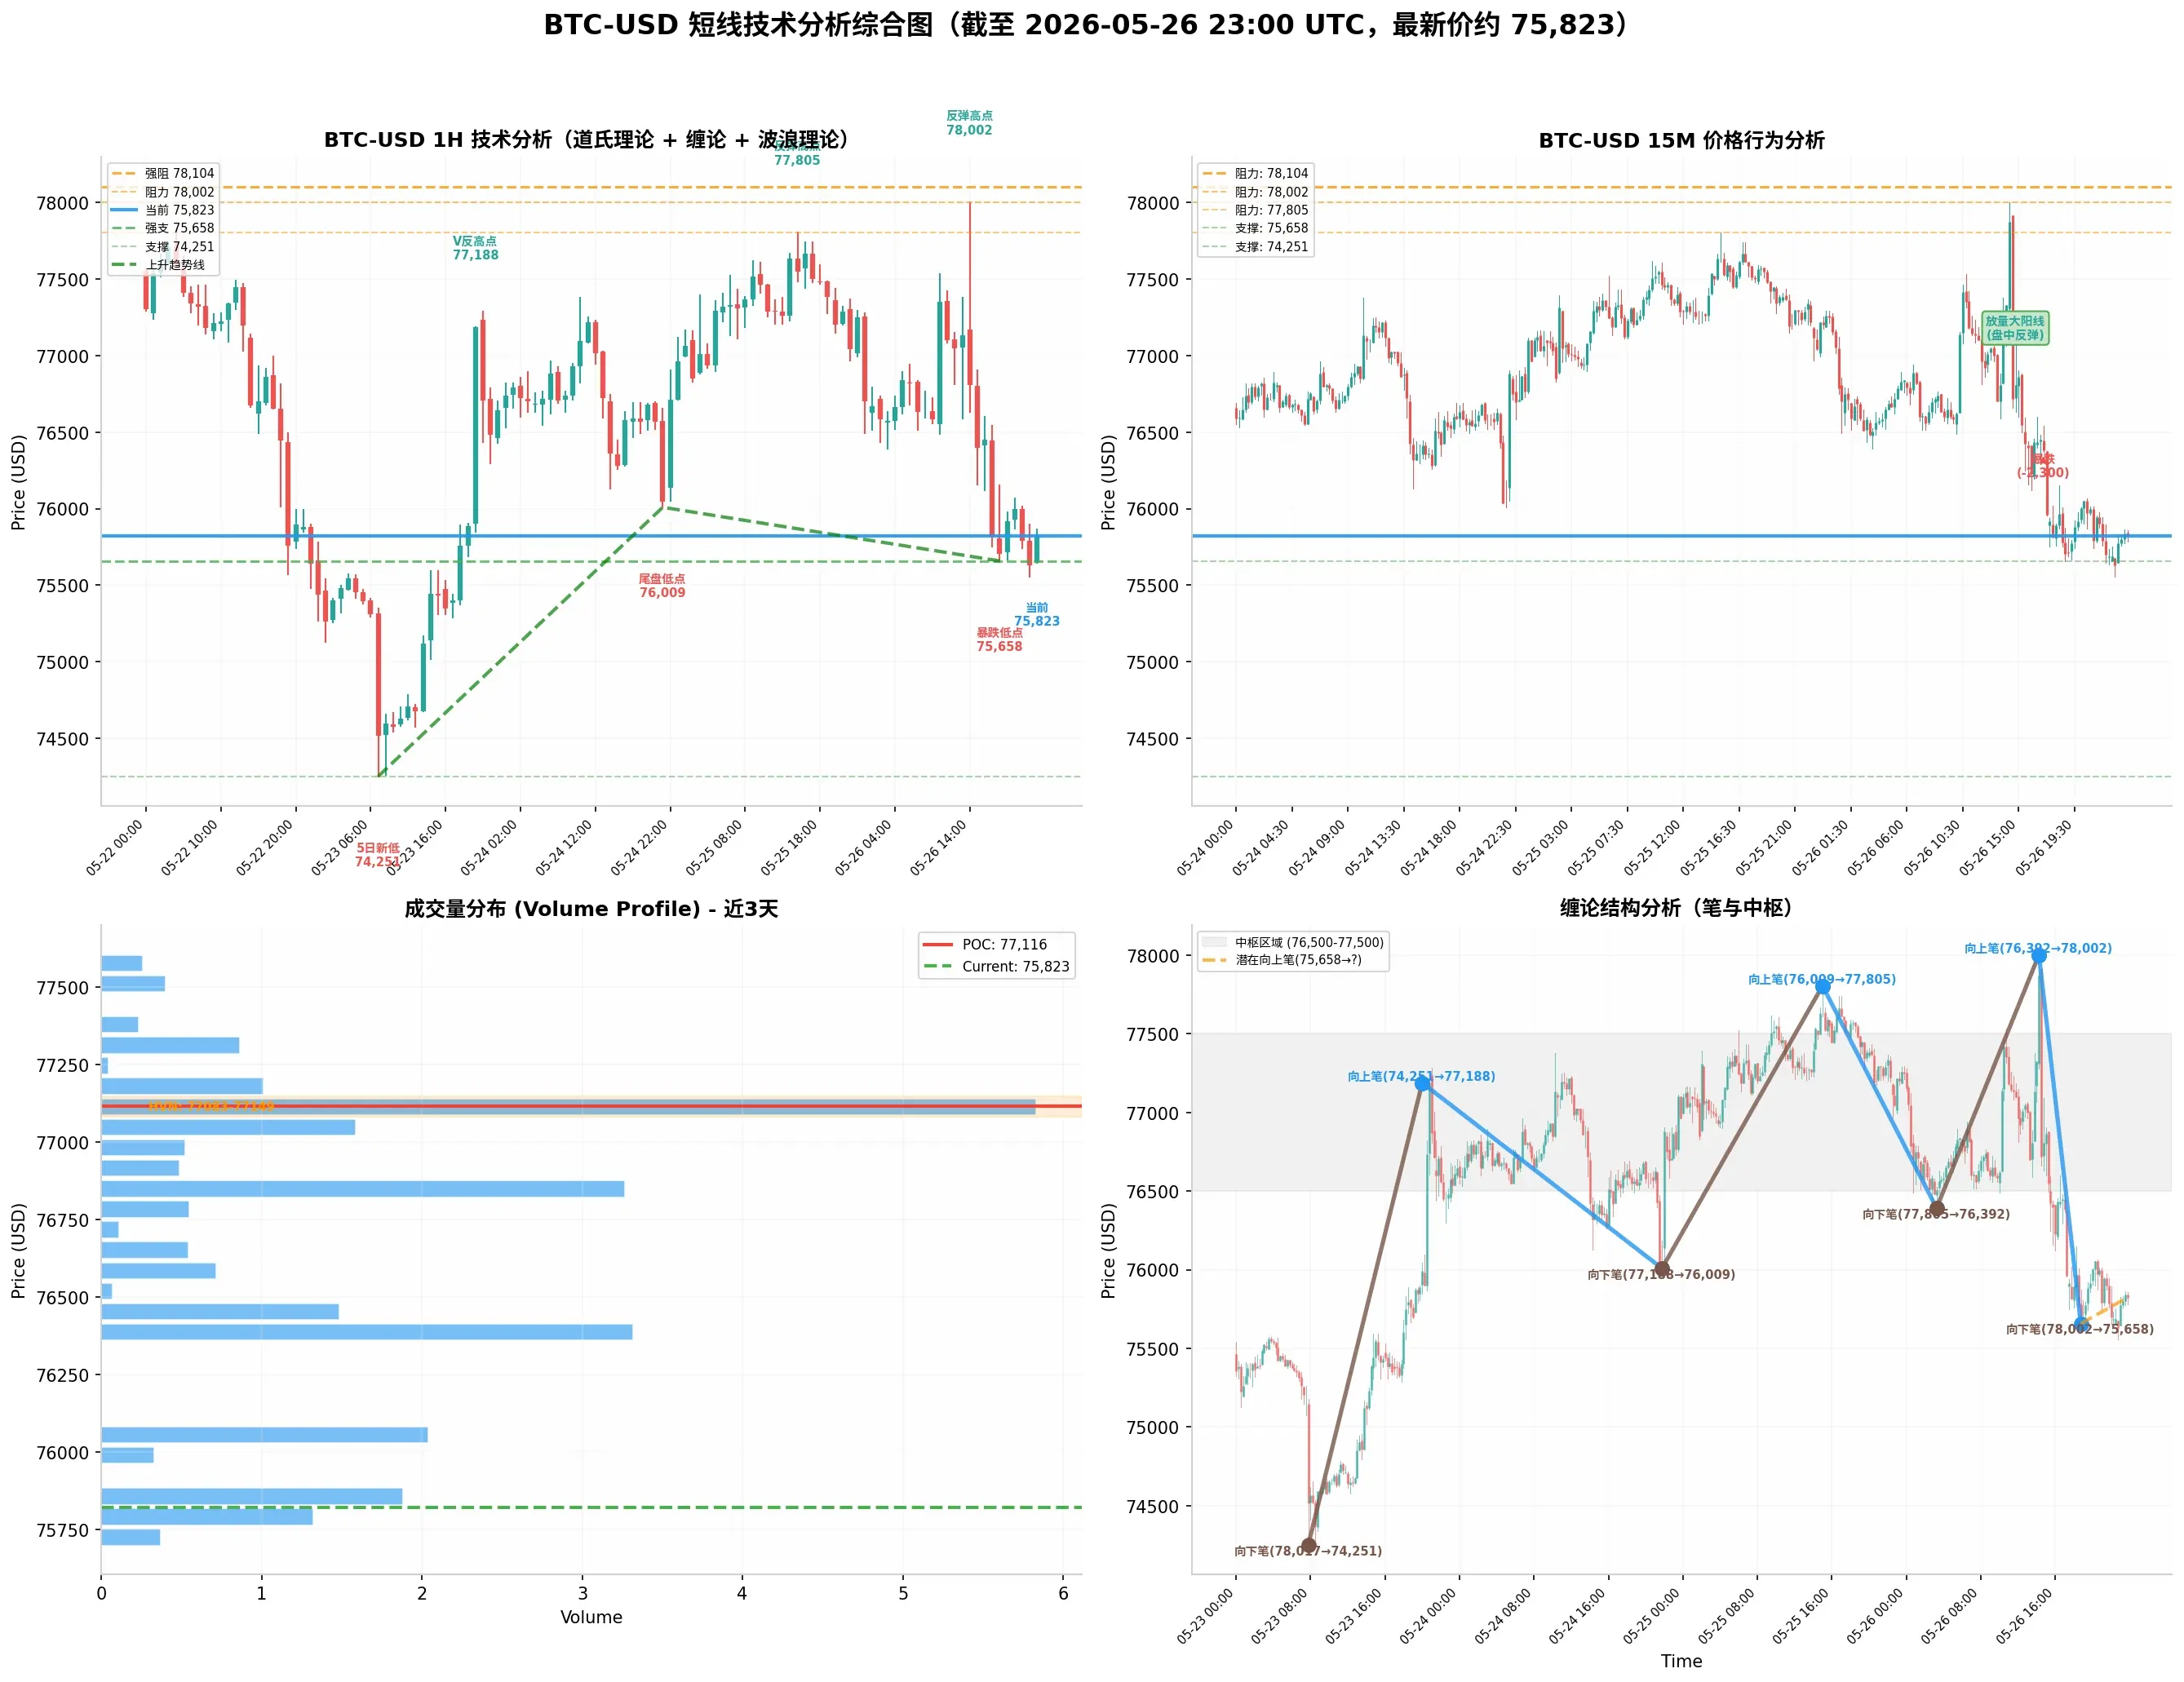
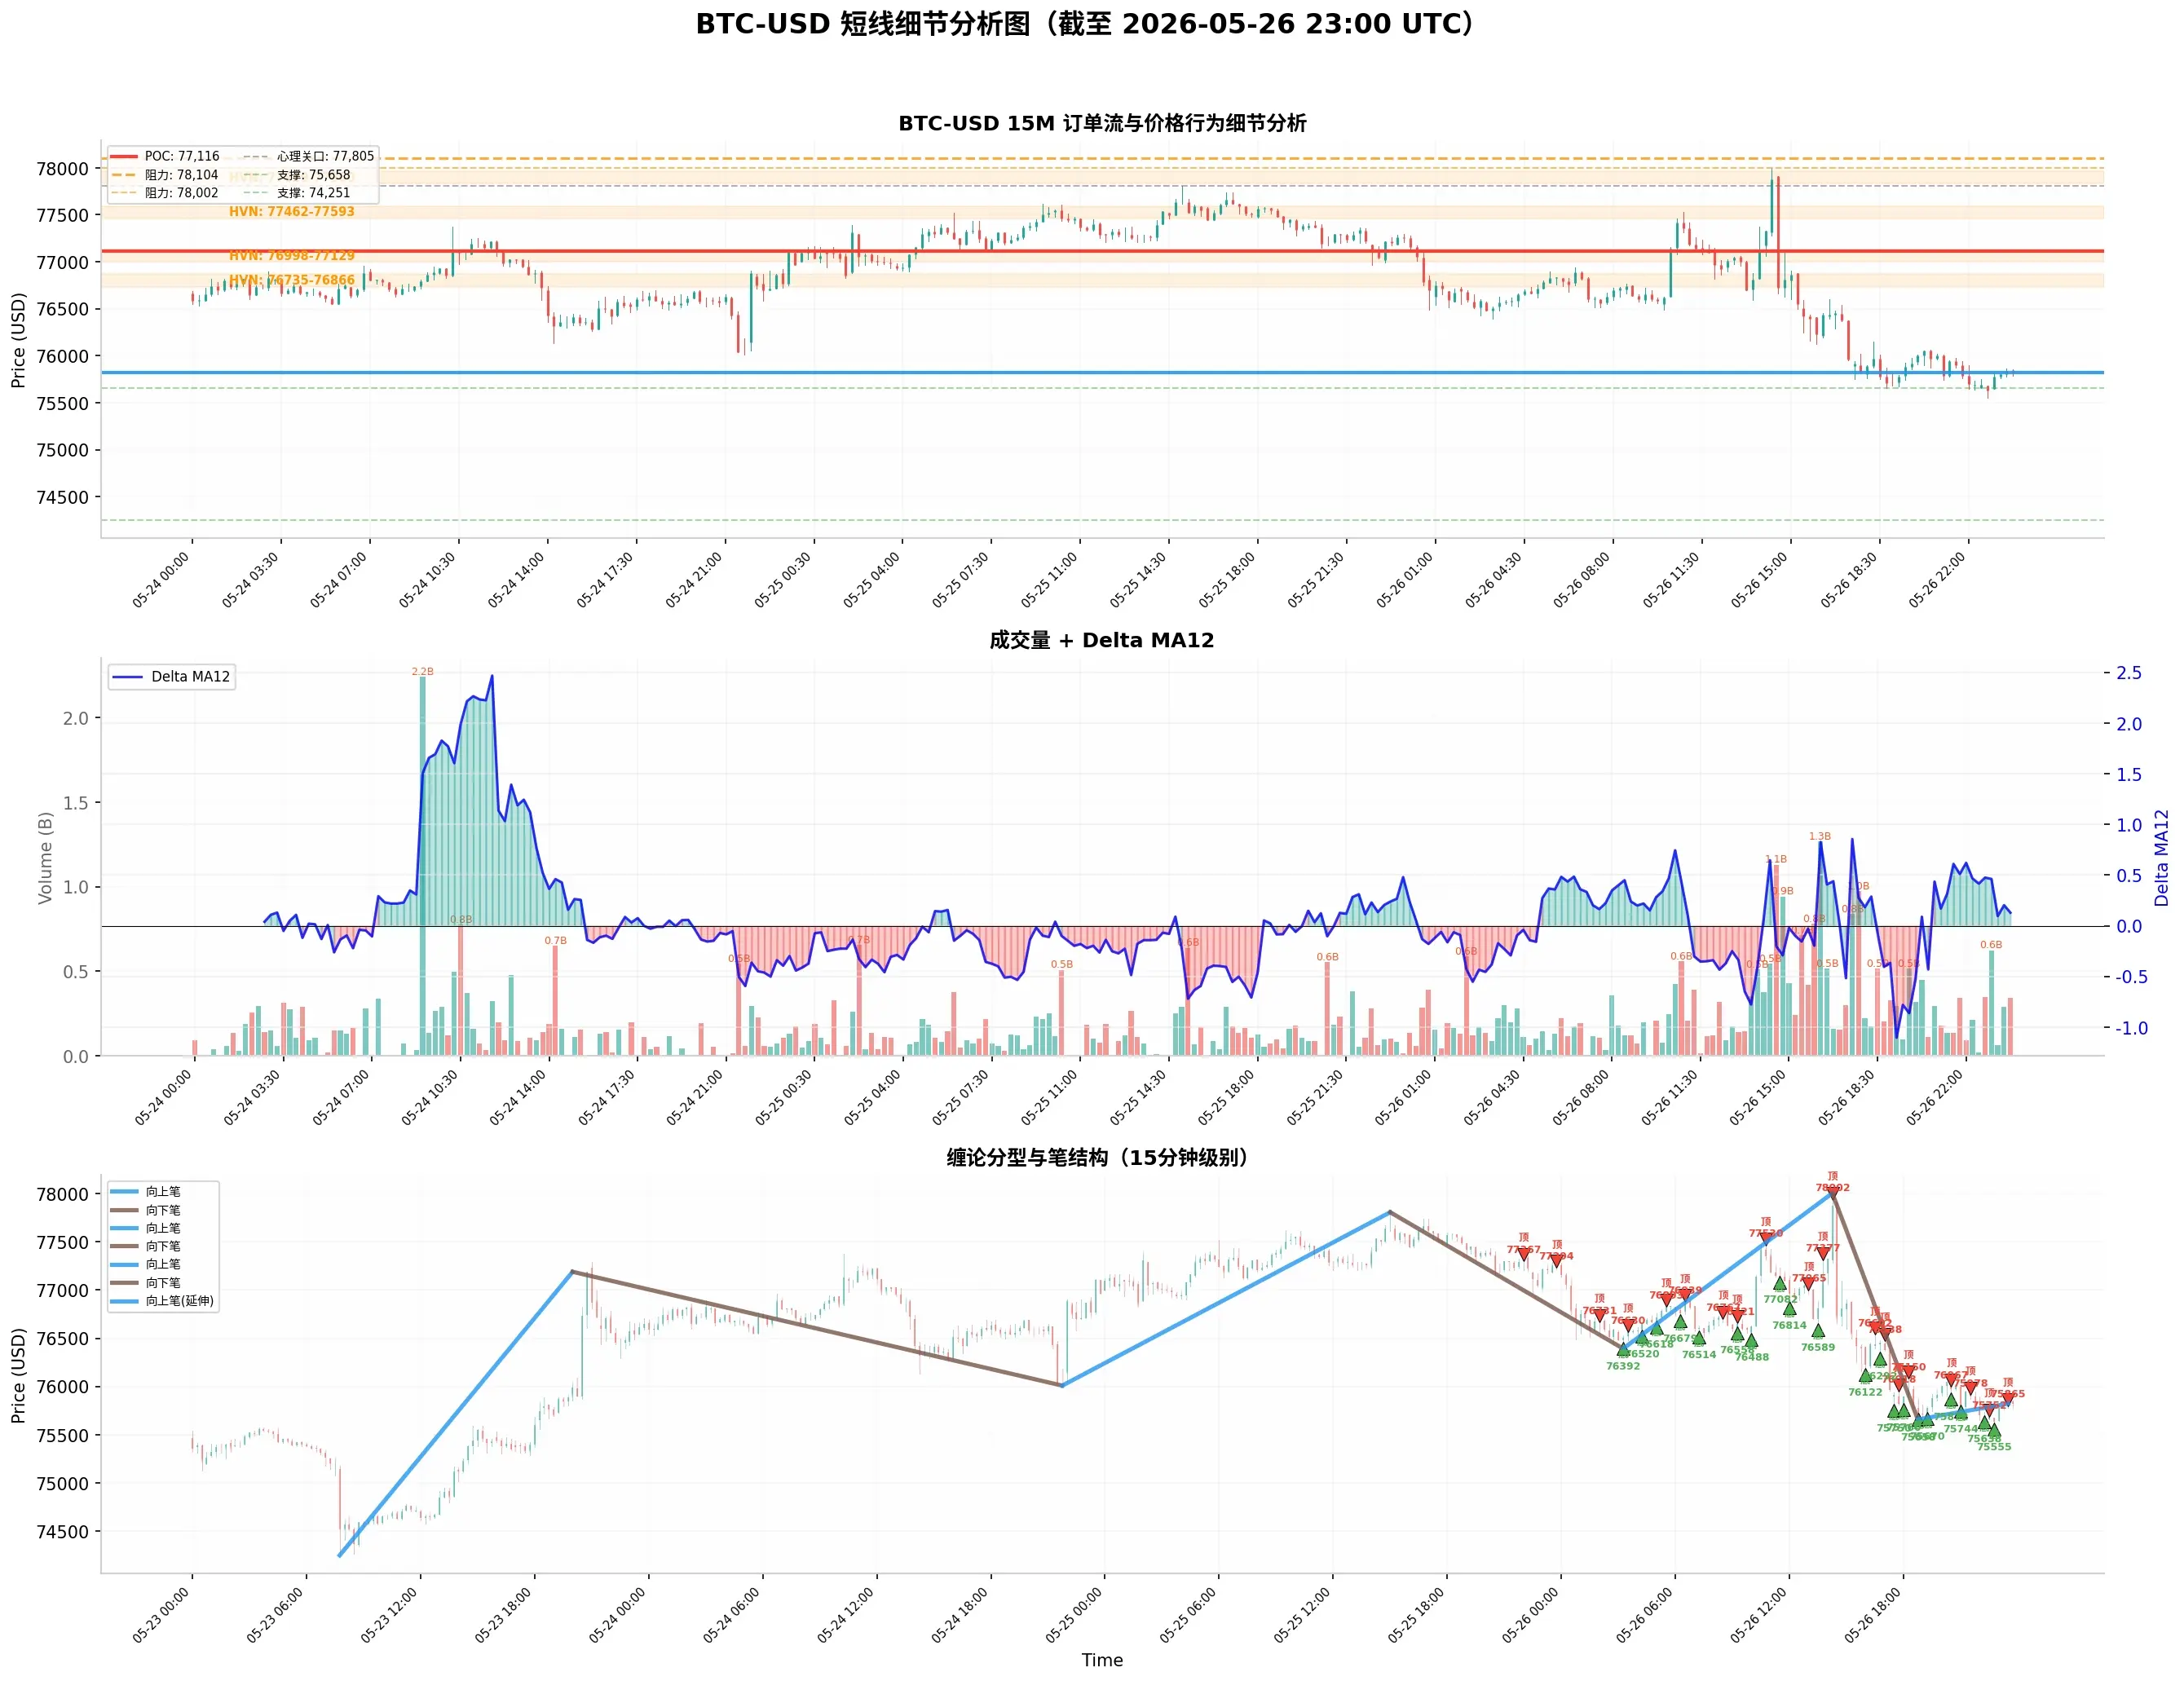
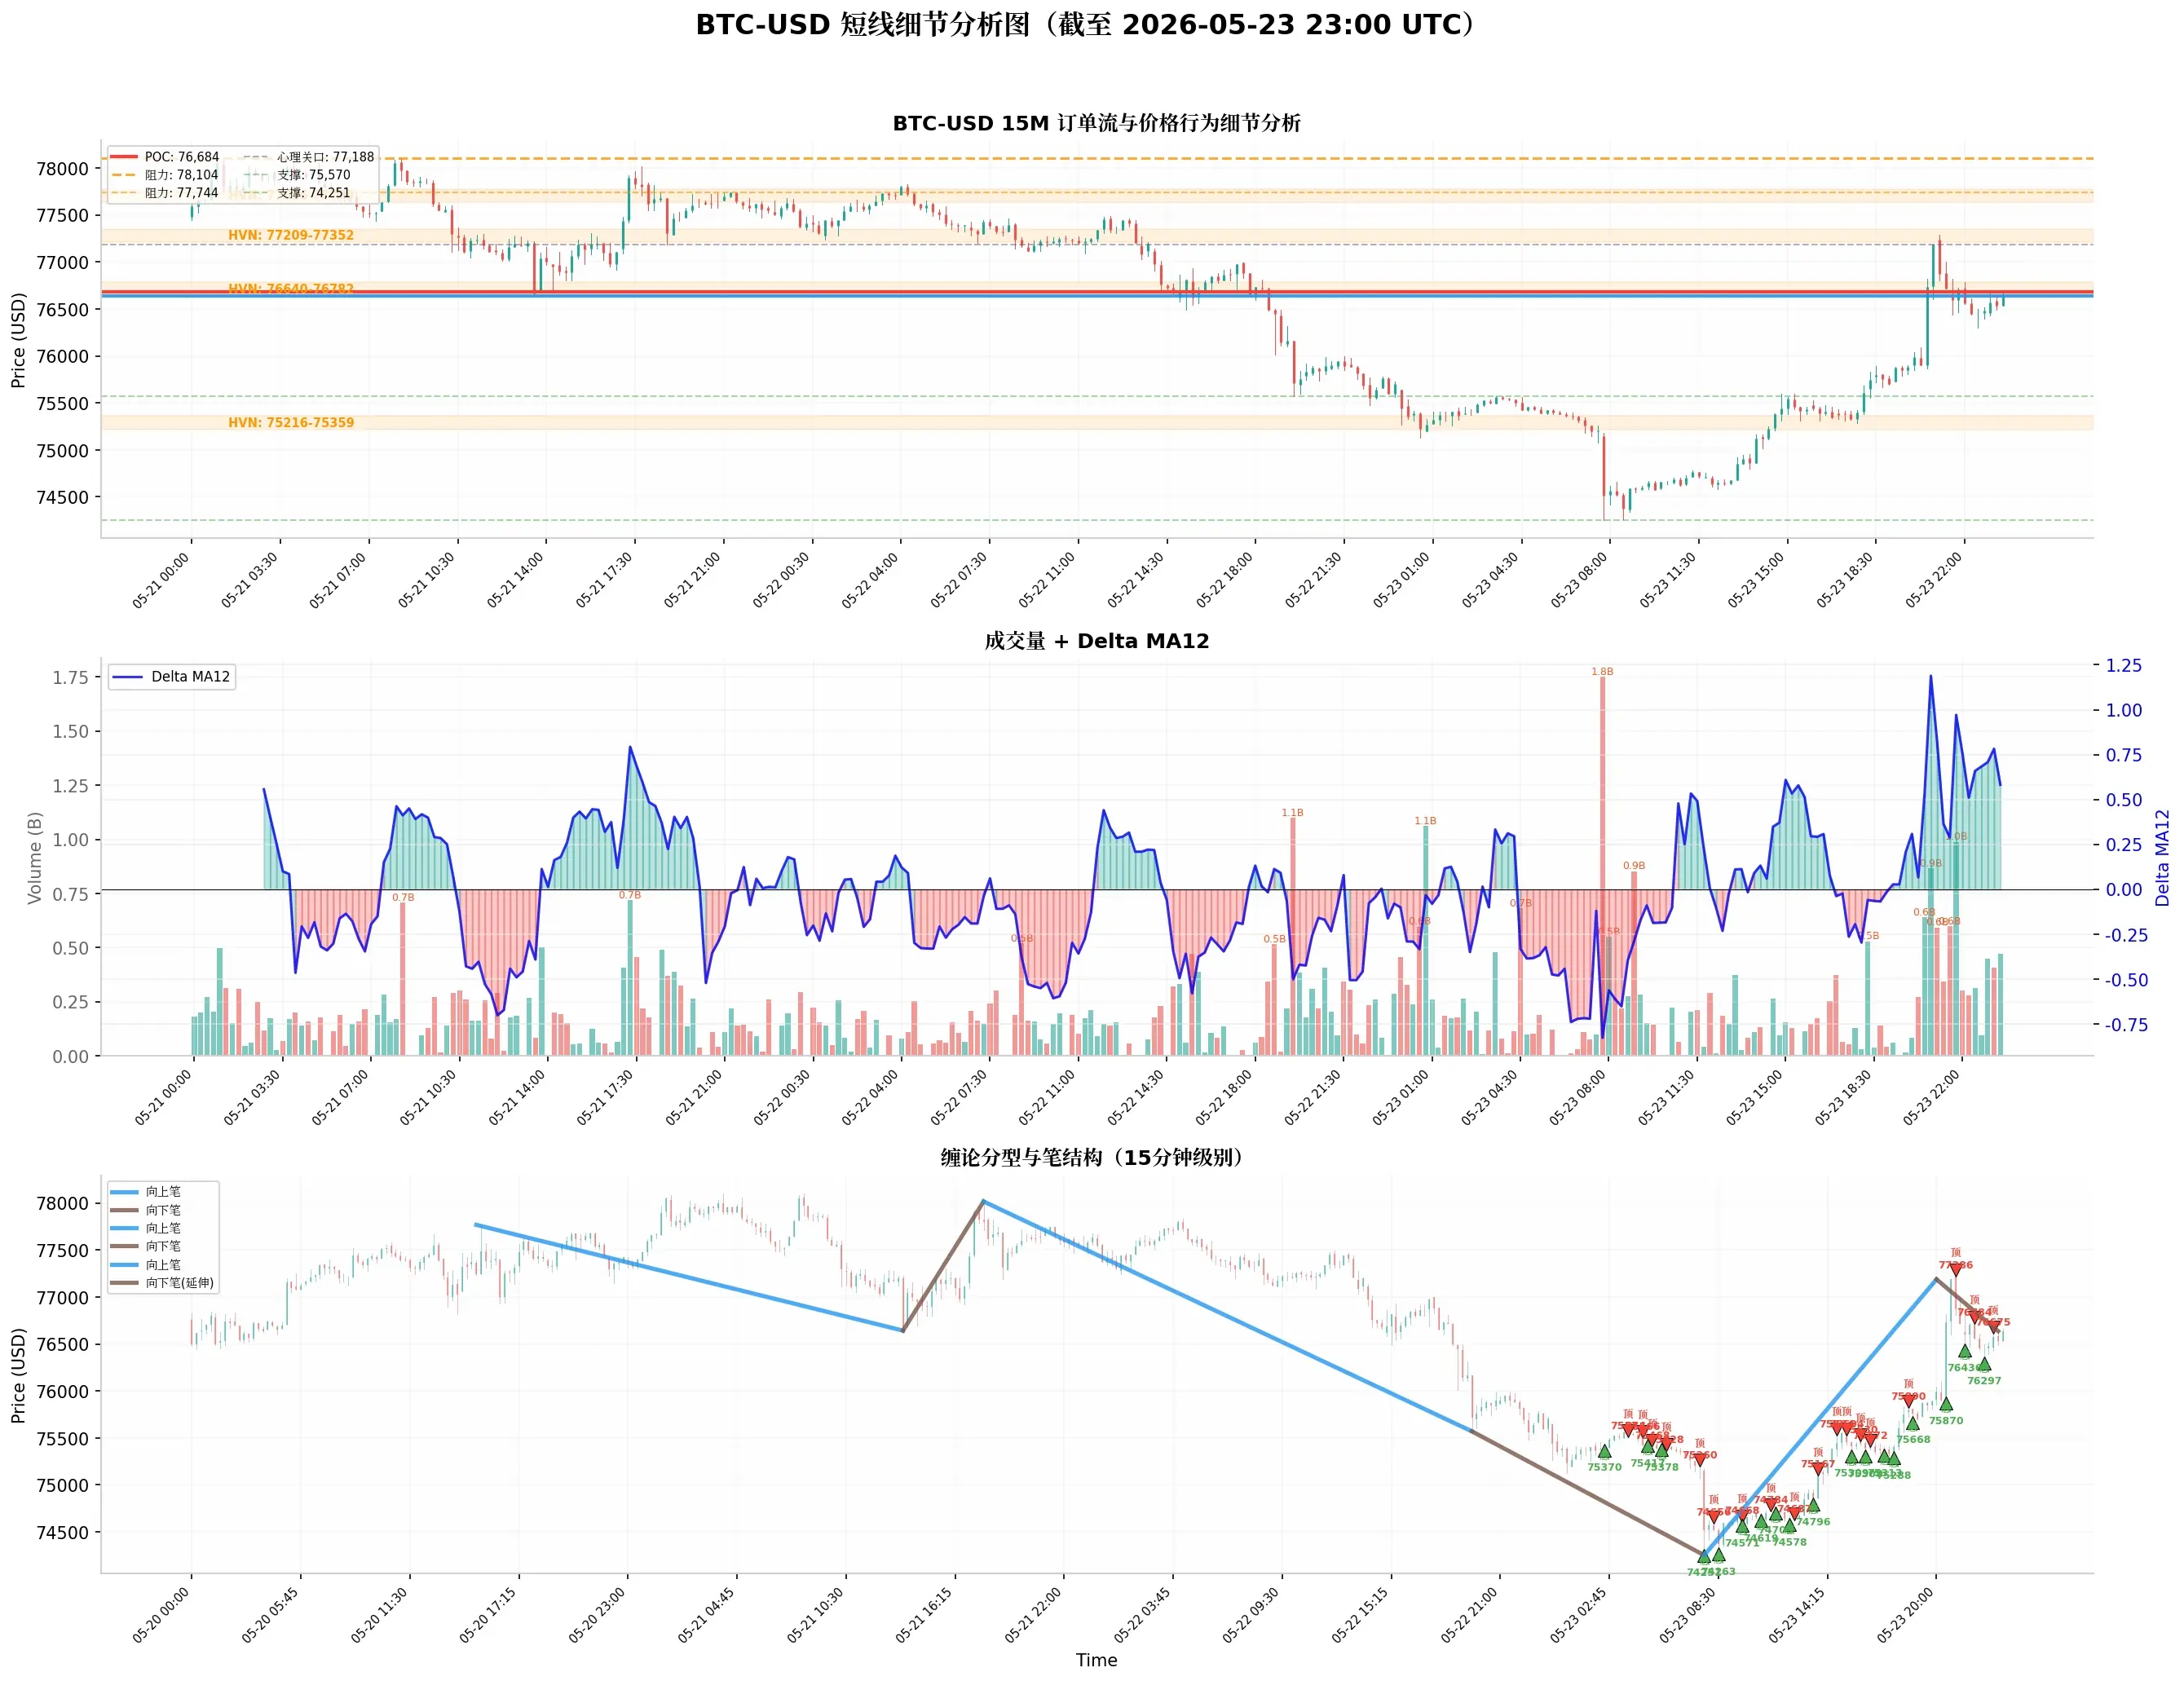
Main trend (1-hour timeframe): Since the high point of 82,448 on May 10, the medium-term downtrend is still ongoing and accelerating. After making a new low of 74,251 on May 23, the market experienced a strong V-shaped reversal, surging from 74,251 to 77,188. However, each subsequent rebound was weaker—on May 24 rebounded to 77,375, May 25 to 77,805, May 26 to 78,002 (near 5-day high)—but each rebound was followed b
BTC-0.15%
View Original
post-image
post-image
  • Reward
  • Comment
  • Repost
  • Share
From Dow Theory, Chan Theory, Wave Theory, Volume-Price Relationship, Order Flow, and Price Action Analysis of BTC Short-term Trends (Strategy Recommendations)
$BTC
Comprehensive Judgment
Dow Theory indicates a primary trend of decline with accelerating signals, with the short-term trend being steep decline, key levels at 75,658 (upper) and 74,114 (lower).
Chan Theory shows a very strong downward stroke (-1,802) far exceeding the upward stroke (+364), currently in the early stage of a slight rebound after a downward stroke extension, with no signs of termination yet.
Wave Theory suggests th
BTC-0.15%
View Original
post-image
post-image
  • Reward
  • Comment
  • Repost
  • Share
From Dow Theory, Chan Theory, Elliott Wave Theory, Volume-Price Relationship, Order Flow, and Price Action Analysis of BTC Short-term Trends
$BTC ‌1. Dow Theory
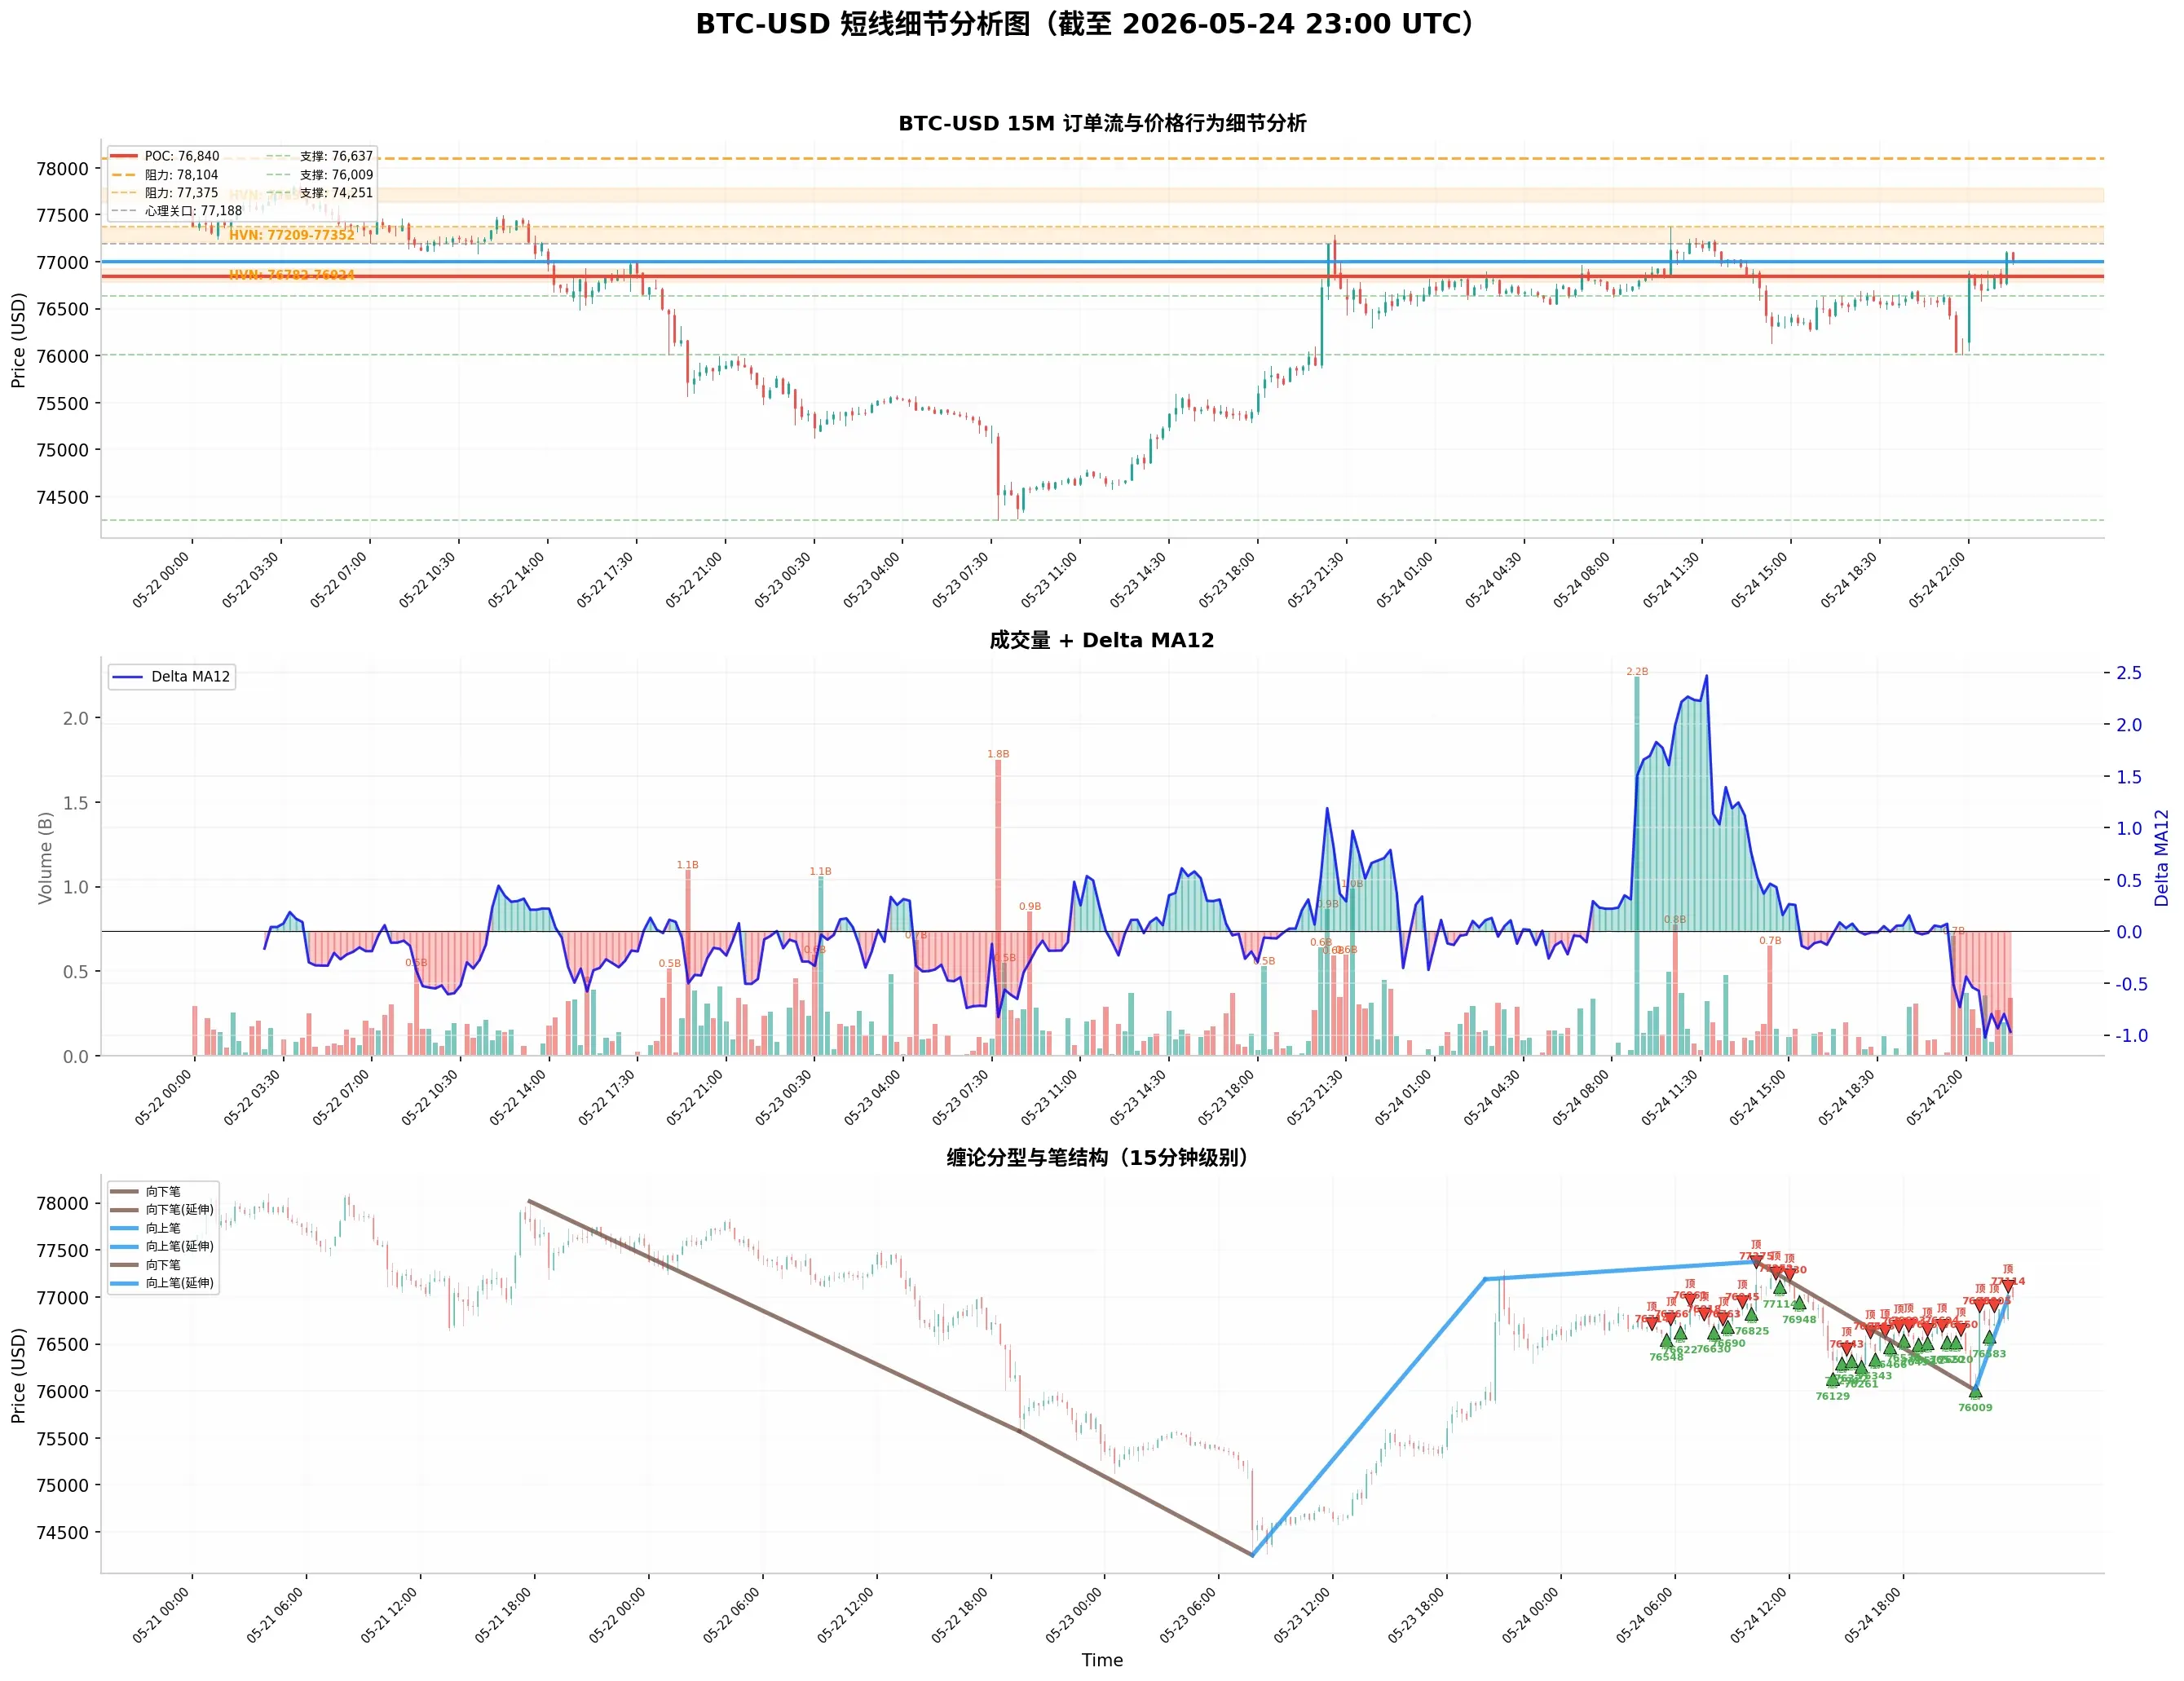
Main trend (1-hour level): The medium-term downtrend from the high point of 82,448 on May 10 is still ongoing. After making a new low of 74,251 on May 23, the market experienced a strong V-shaped reversal, surging from 74,251 to 77,188. However, from May 24–26, the movement was highly volatile, showing typical "rollercoaster" characteristics—on May 24, the early rebound to 77,375, then a sharp plunge to 76,009; on May 25, a rebound
BTC-0.15%
View Original
post-image
post-image
  • Reward
  • Comment
  • Repost
  • Share
Based on Dow Theory, Chan Theory, Wave Theory, Volume-Price Relationship, Order Flow, and Price Action Analysis of BTC Short-term Trends (Strategy Recommendations)
$BTC ‌Comprehensive Judgment
Dow Theory indicates a primary trend of decline with signs of acceleration, with the short-term trend being a steep decline, key levels at 77,188 (upper) and 75,658 (lower).
Chan Theory shows very strong downward strokes (-2,344) far exceeding upward strokes, currently in the early stage of a slight rebound after a downward stroke extension, with no sign of termination yet.
Wave Theory suggests that Wav
BTC-0.15%
View Original
post-image
post-image
  • Reward
  • Comment
  • Repost
  • Share
Based on Dow Theory, Chan Theory, Wave Theory, Volume-Price Relationship, Order Flow, and Price Action, an analysis of BTC short-term trend
$BTC ‌1. Dow Theory (Dow Theory)
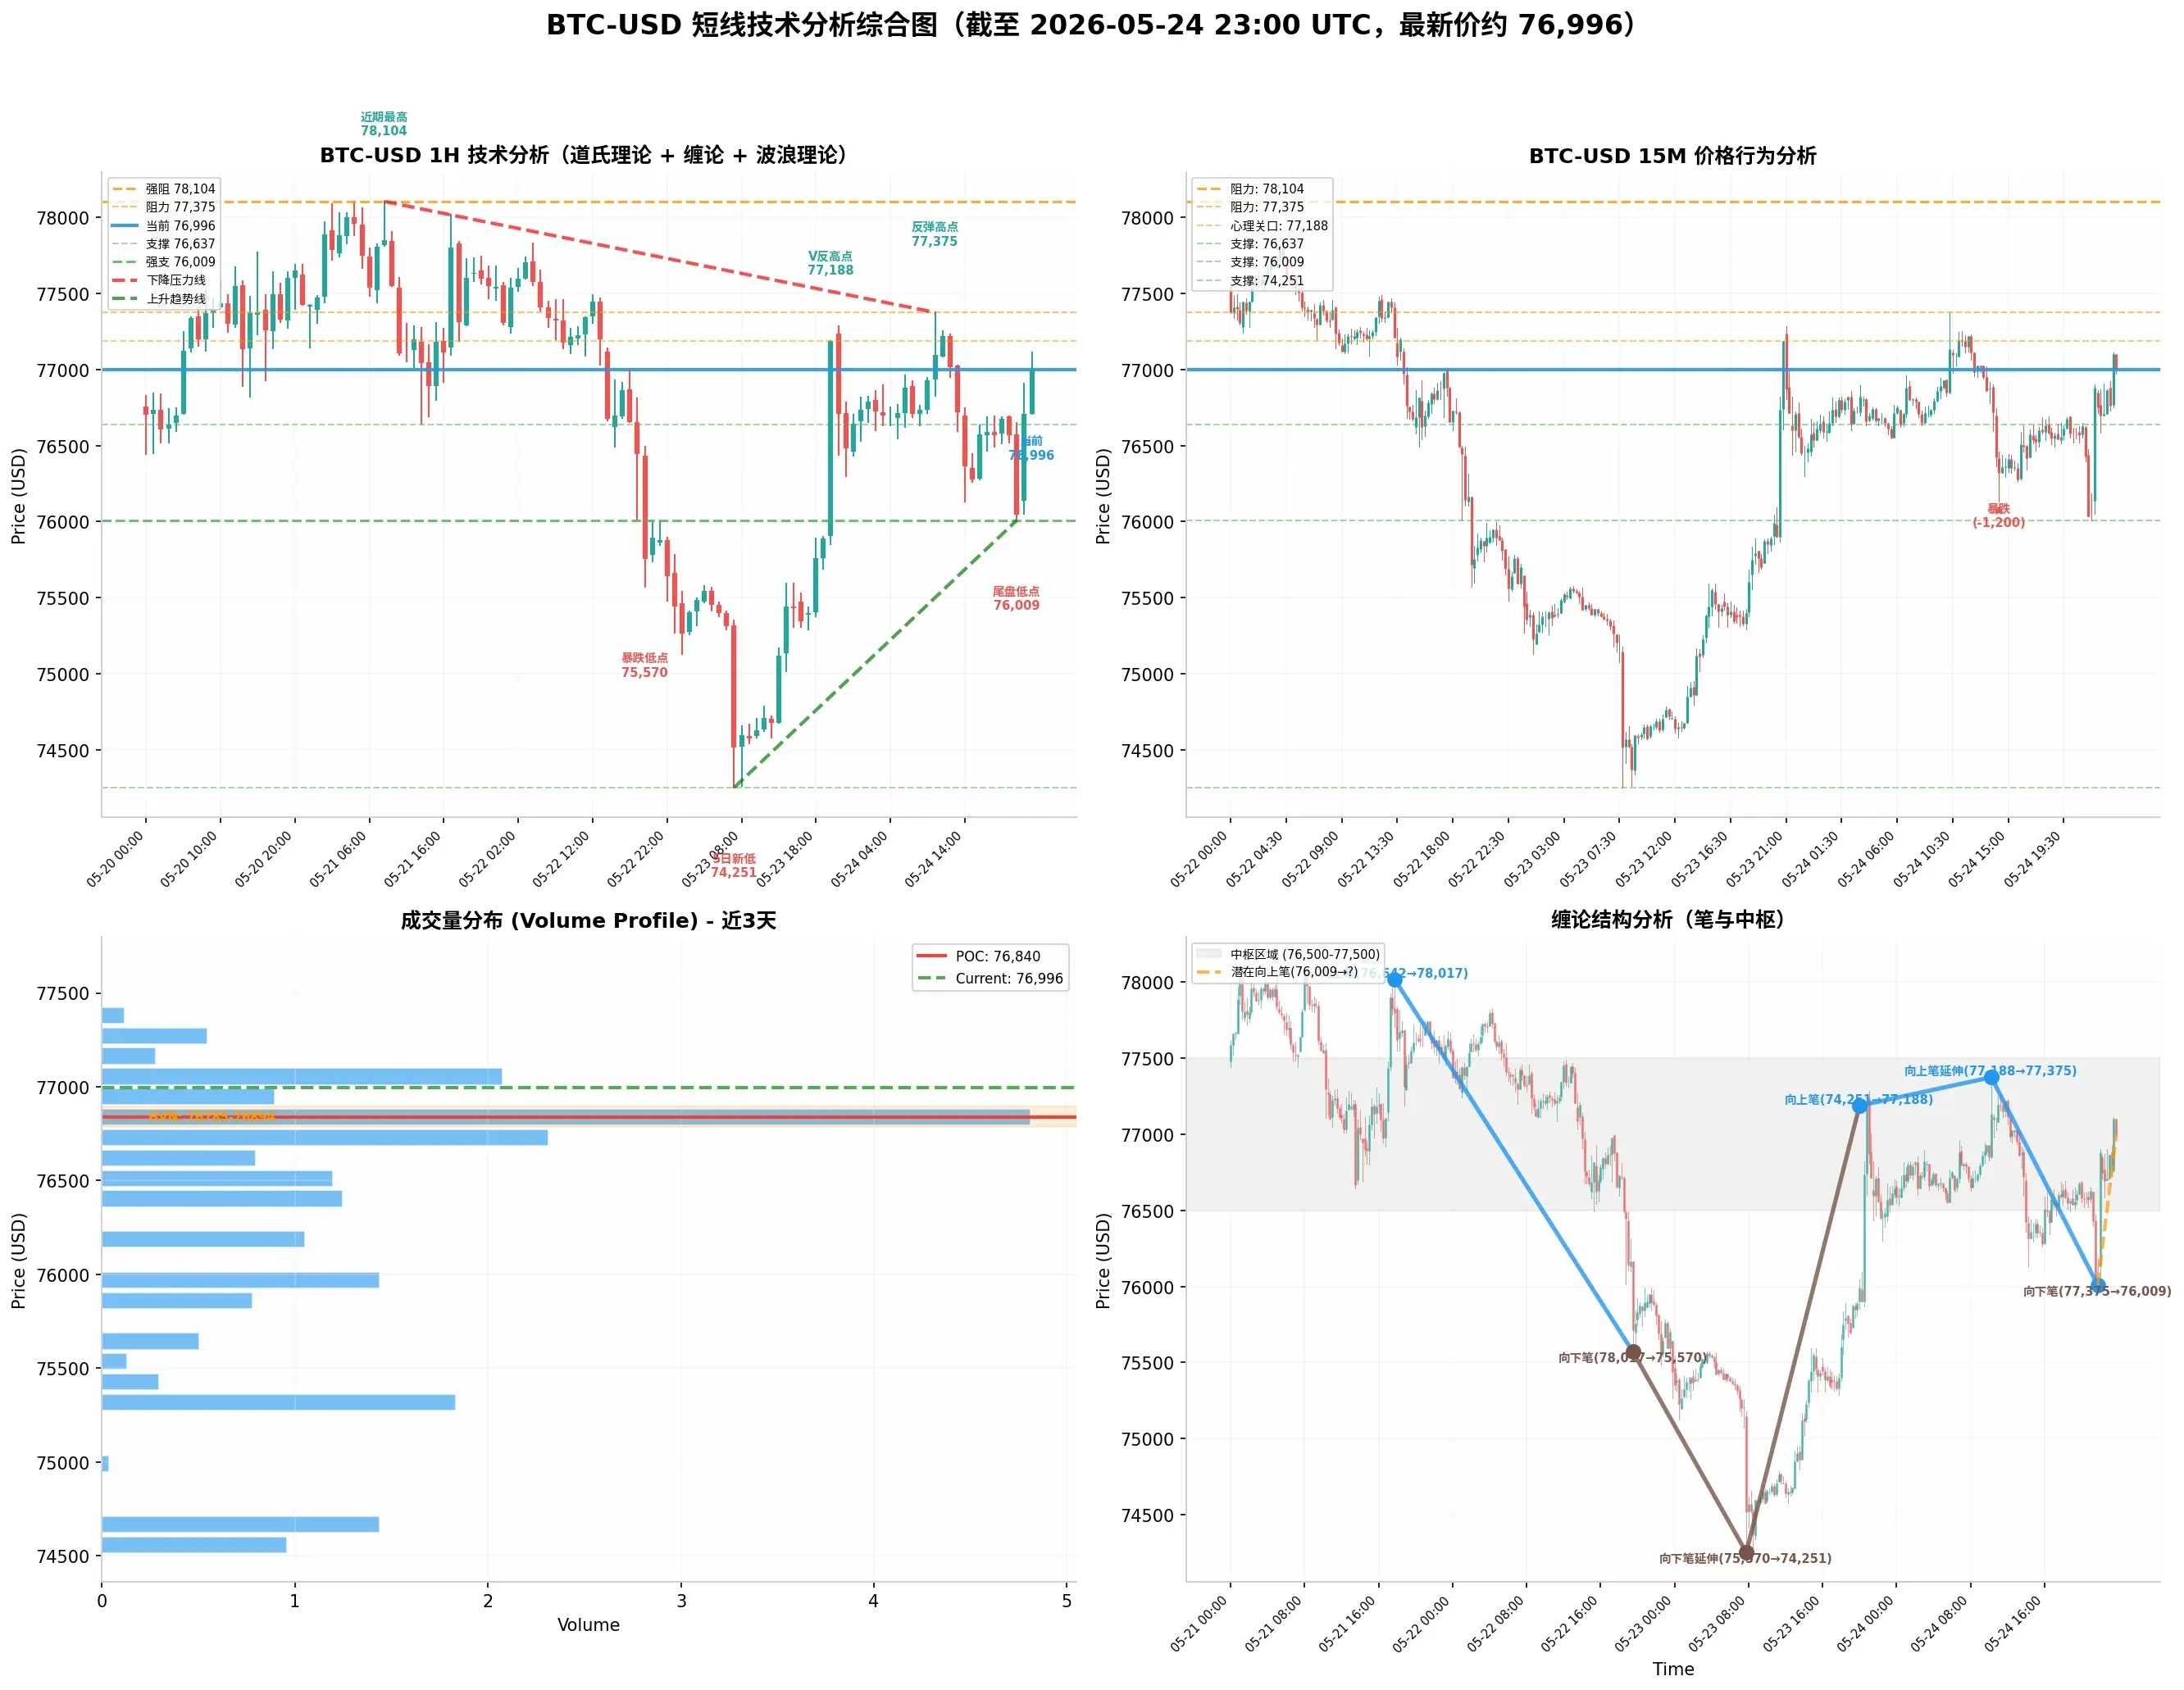
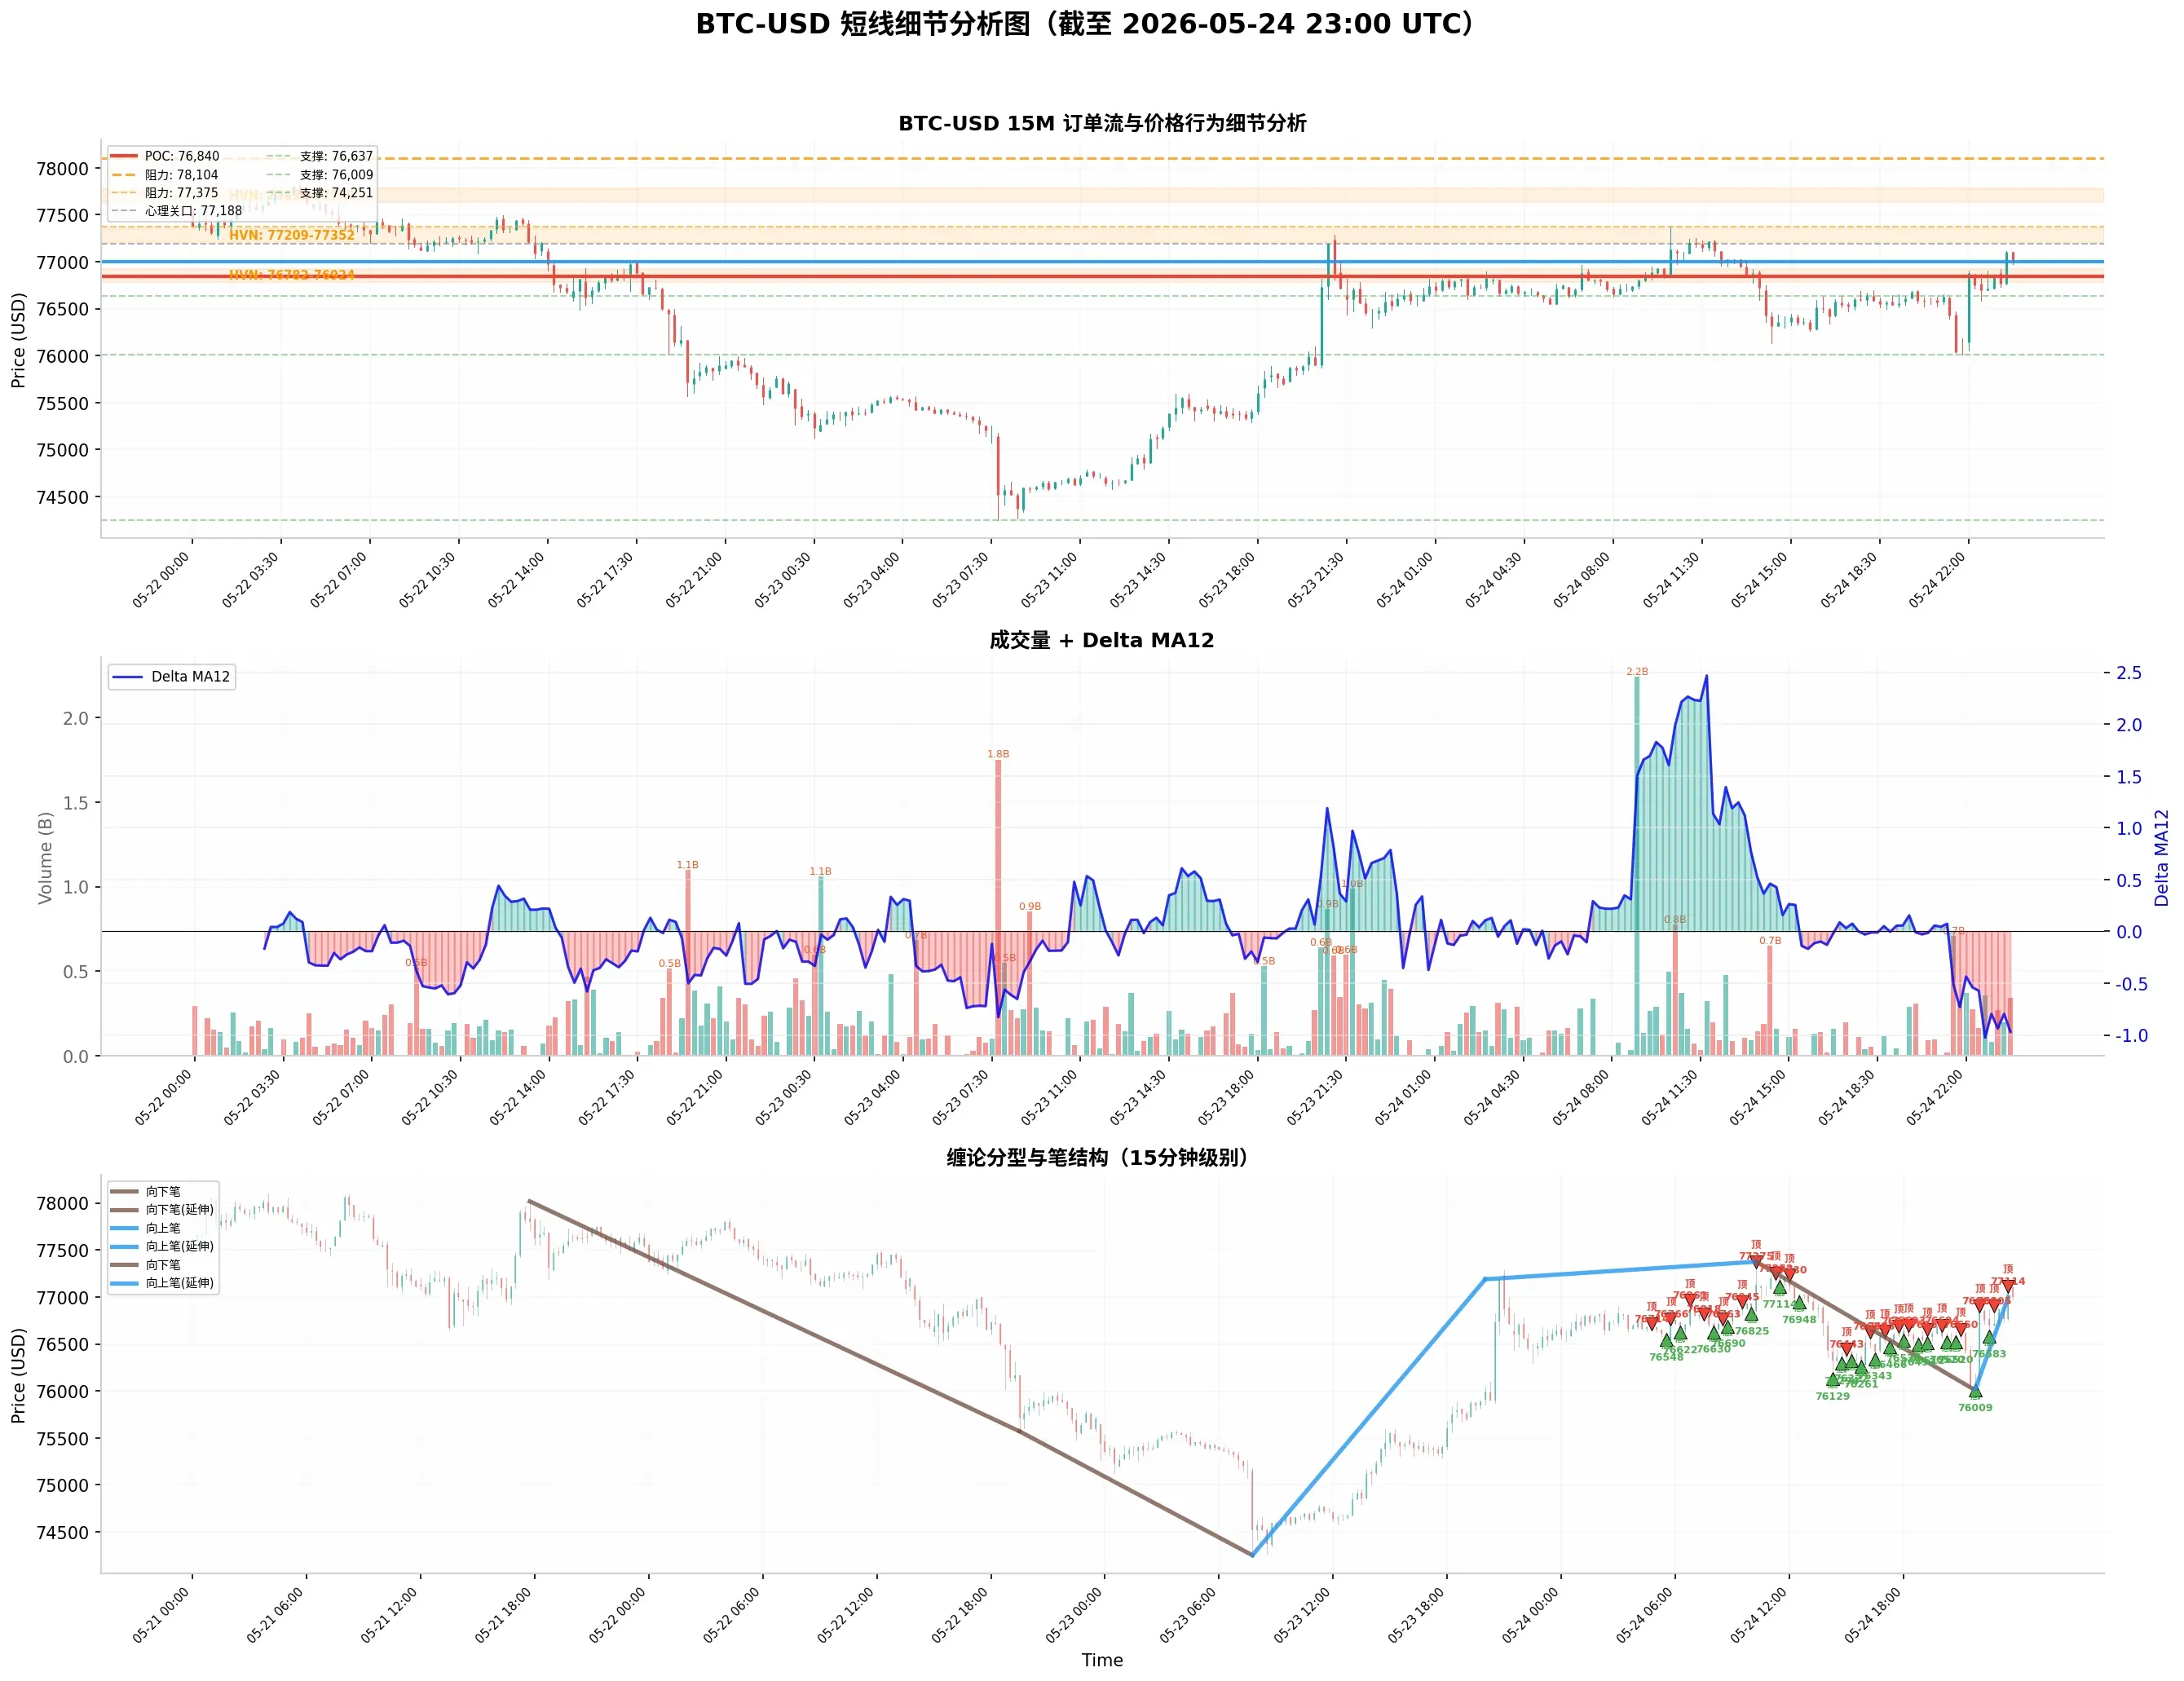
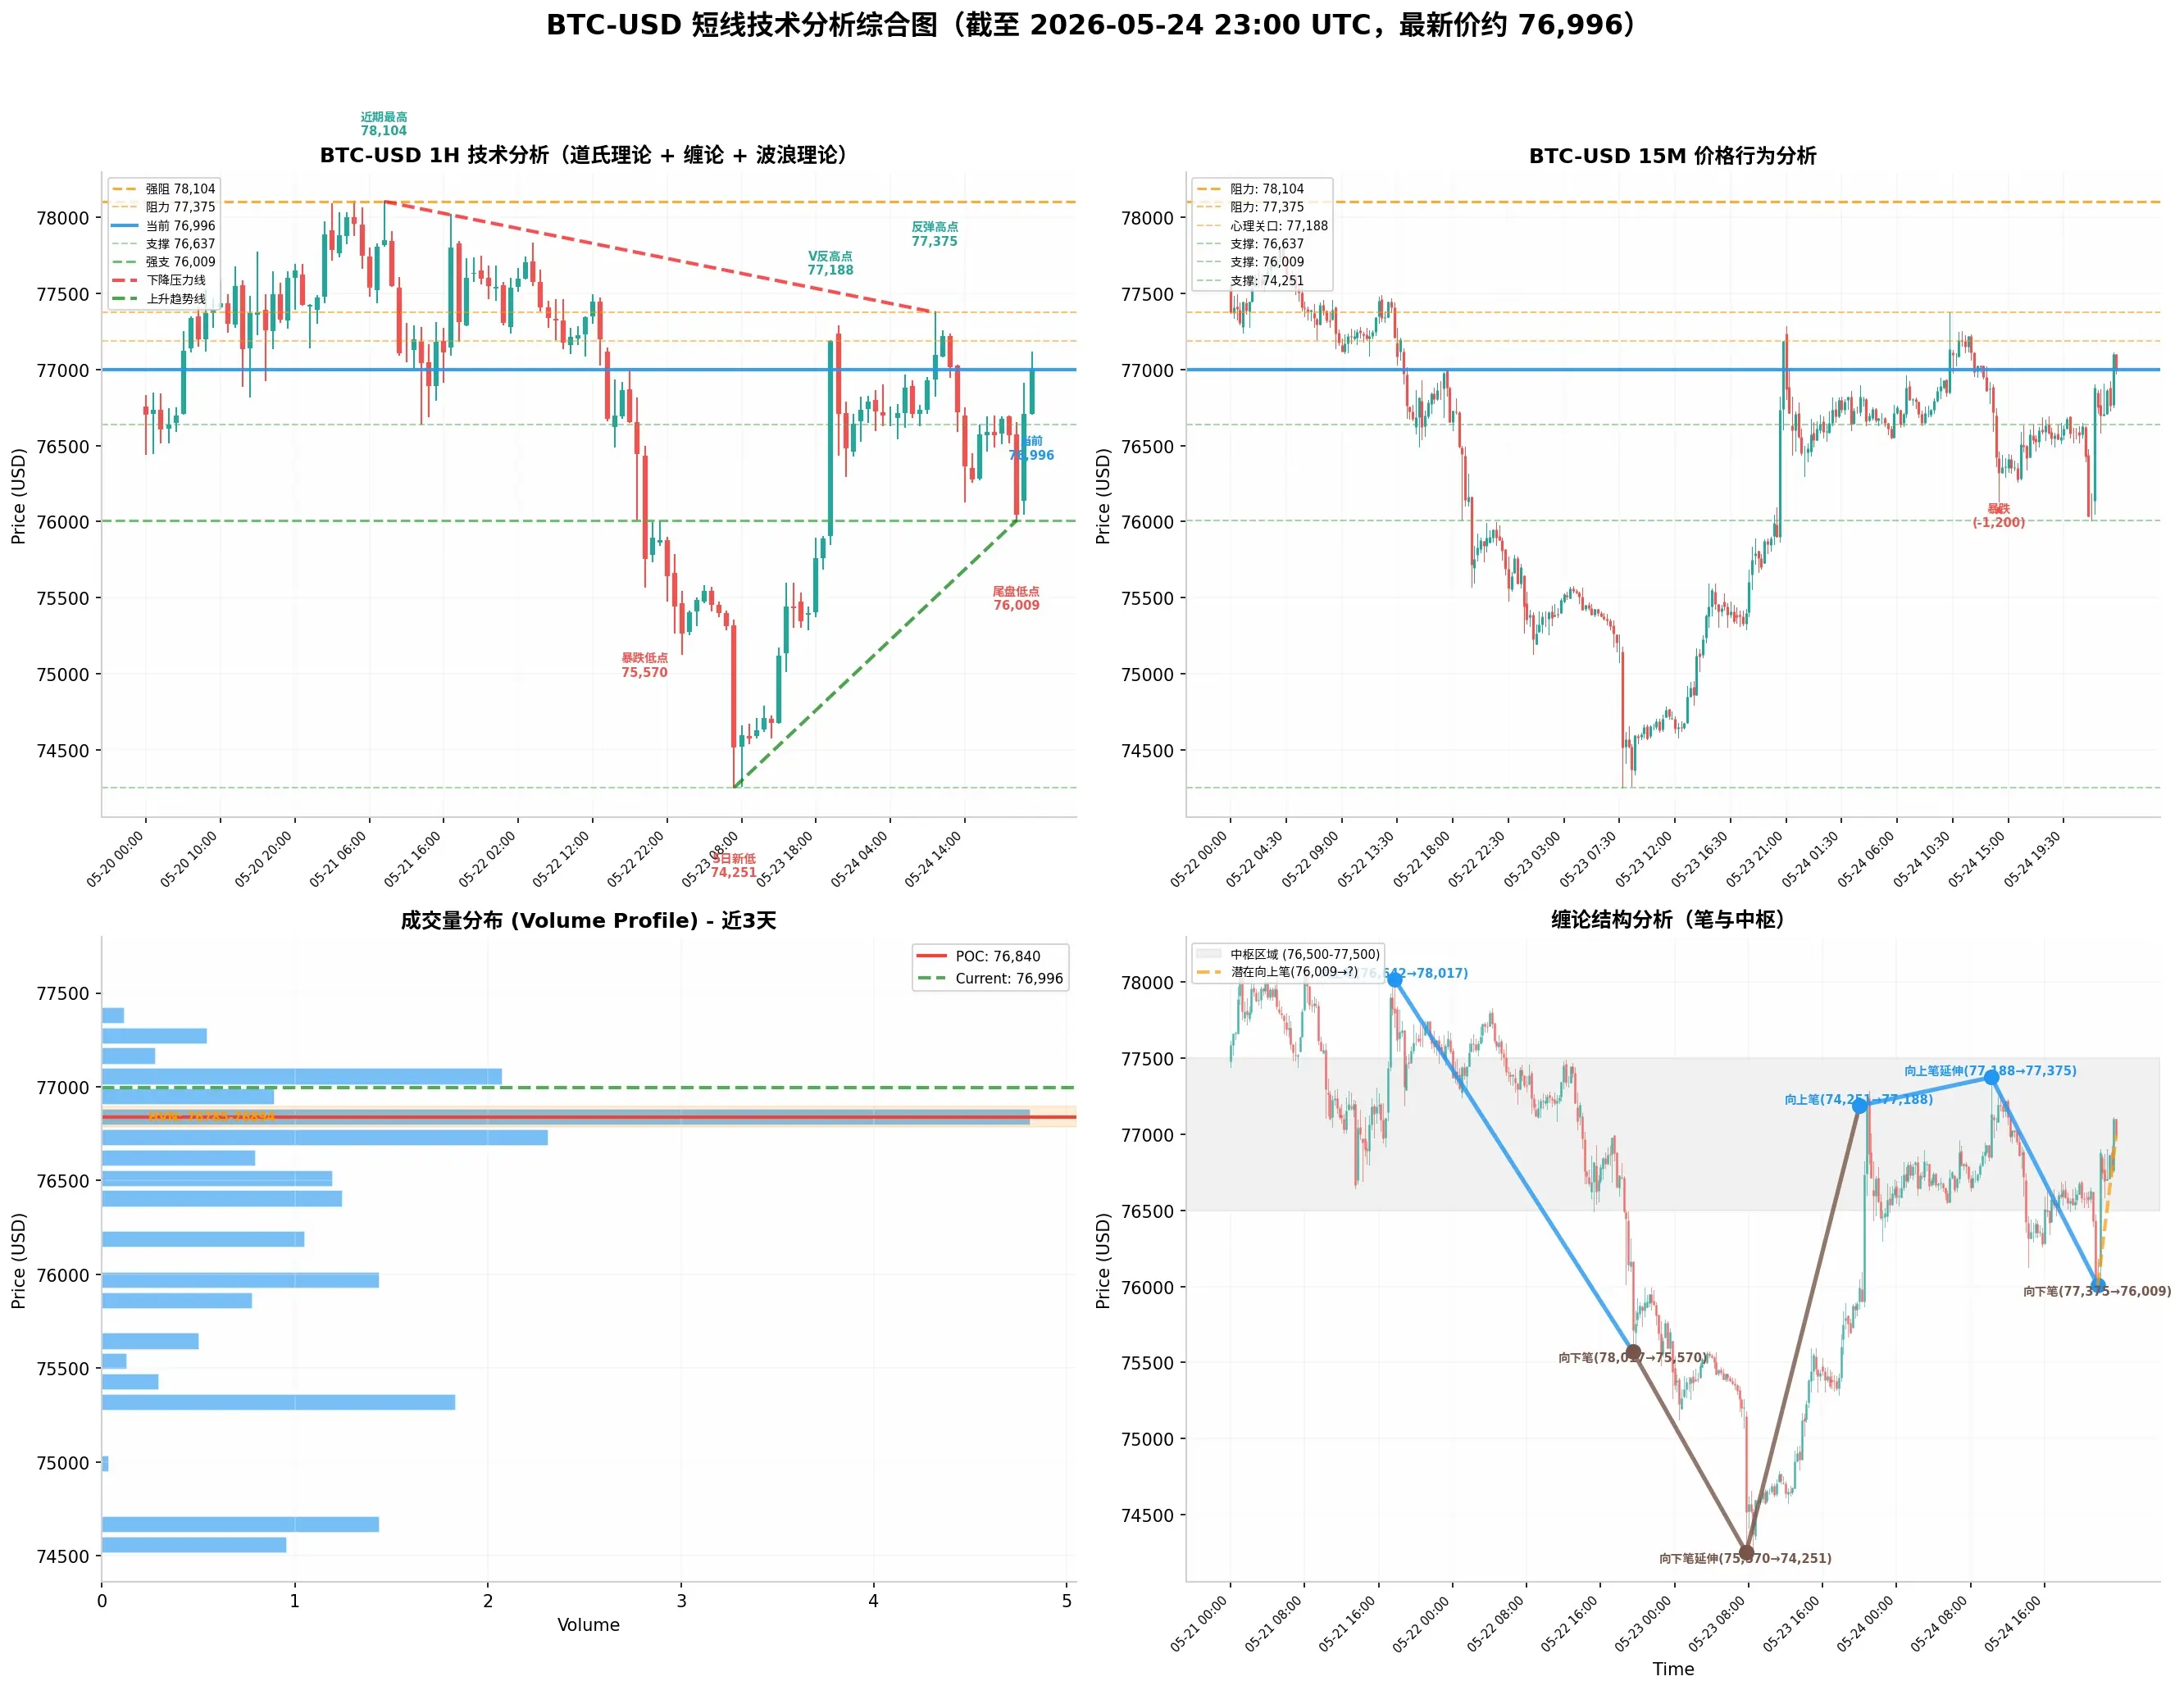
Main trend (1-hour level): The medium-term downtrend from the high point of 82,448 on May 10 is still ongoing. Continuous cliff-like crashes occurred on May 22–23, dropping from 77,829 to 74,251, creating a near 5-day new low. However, at 20:00 on May 23, a shocking V-shaped reversal appeared, surging from 74,251 to 77,188. Subsequently, May 24 showed highly volatile movement, with an early rebound to 77,375, an afternoon
BTC-0.15%
View Original
post-image
post-image
  • Reward
  • Comment
  • Repost
  • Share
Based on Dow Theory, Chan Theory, Wave Theory, Volume-Price Relationship, Order Flow, and Price Action Analysis of BTC Short-term Trends (Strategy Recommendations)
$BTC
Comprehensive Judgment
Dow Theory indicates that the main trend remains downward, but a short-term reversal to an upward trend has occurred, with key levels at 78,104 (upside) and 76,500 (downside).
Chan Theory shows that the downward wave has ended at 76,009, and the upward wave is very strong (+1,796), currently at the end of the upward wave and transitioning into the beginning of a new downward wave. Watch for confirmatio
BTC-0.15%
View Original
post-image
post-image
  • Reward
  • Comment
  • Repost
  • Share
From Dow Theory, Chan Theory, Elliott Wave Theory, Volume-Price Relationship, Order Flow, and Price Action Analysis, a浅析BTC短线走势
$BTC ‌1. Dow Theory
Main trend (1-hour level): The medium-term downtrend from the high point of 82,448 on May 10 is still ongoing. Continuous cliff-like crashes occurred on May 22–23, dropping from 77,829 to 74,251, creating a near 5-day low. However, at 20:00 on May 23, a stunning V-shaped reversal appeared, surging from 74,251 to 77,188, nearly a 3,000 rebound. On May 24, the movement was extremely volatile, with an early rebound to 77,375, then a sharp drop to 76,
BTC-0.14%
View Original
post-image
post-image
  • Reward
  • Comment
  • Repost
  • Share
Based on Dow Theory, Chan Theory, Wave Theory, Volume-Price Relationship, Order Flow, and Price Action Analysis of BTC Short-term Trends (Strategy Recommendations)
$BTC
Comprehensive Judgment
Dow Theory indicates that the main trend remains downward, but signals a short-term transition to consolidation, with key levels at 77,188 (upside) and 76,009 (downside).
Chan Theory shows that the downward wave has ended at 76,009, and the upward wave has decent momentum (+987) but is not yet confirmed, currently in the early stage of an upward wave.
Wave Theory suggests that after an ABC rebound, the m
BTC-0.15%
View Original
post-image
post-image
  • Reward
  • Comment
  • Repost
  • Share
From Dow Theory, Chan Theory, Wave Theory, Volume-Price Relationship, Order Flow, and Price Action Analysis of BTC Short-term Trends
$BTC ‌1. Dow Theory (Dow Theory)
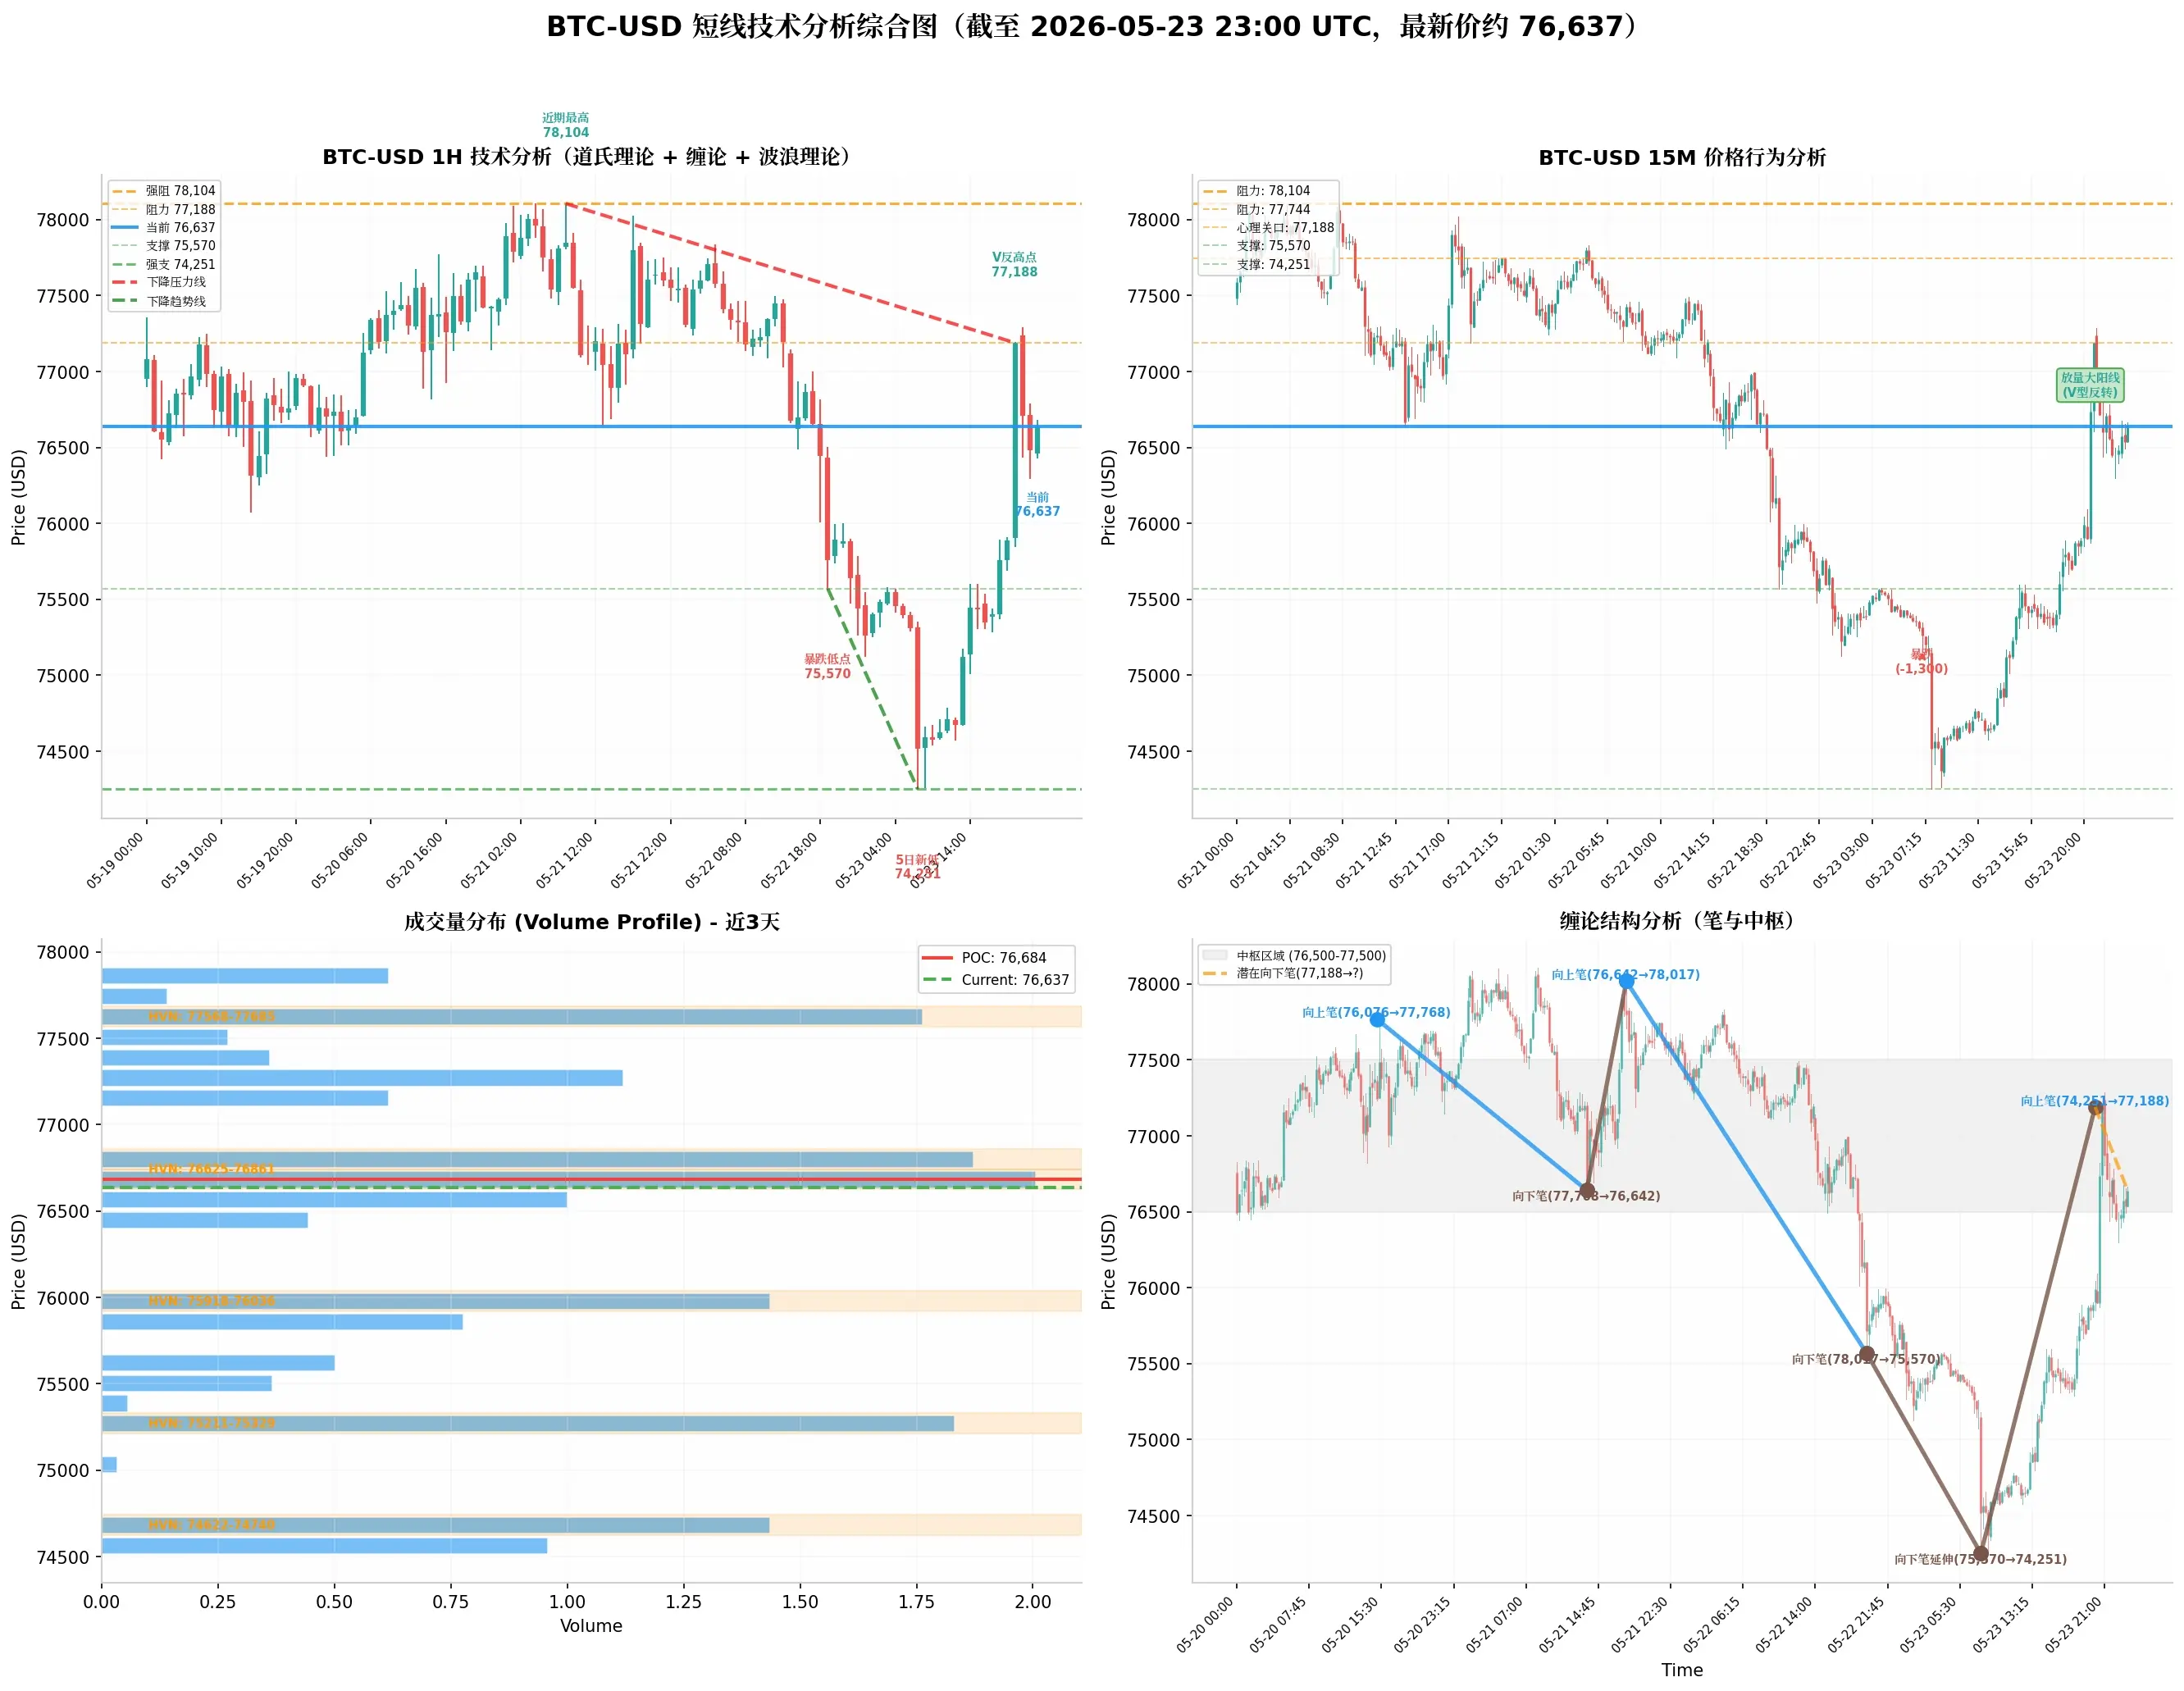
Main Trend (1-hour level): The medium-term downtrend from the high point of 82,448 on May 10 is still ongoing. On May 22, a cliff-like crash occurred, plummeting from 77,829 down to 75,570, completely breaking the bottom-raising structure since May 18 at 76,002. On May 23, the movement was even more extreme, with an early session continued plunge to a new low of 74,251, followed by a very strong V-shaped reversal, soaring fro
BTC-0.15%
View Original
post-image
post-image
  • Reward
  • Comment
  • Repost
  • Share
Based on Dow Theory, Chan Theory, Wave Theory, Volume-Price Relationship, Order Flow, and Price Action Analysis of BTC Short-term Trends (Strategy Recommendations)
$BTC ‌Comprehensive Judgment
Dow Theory indicates that the main trend remains downward but shows signs of a short-term reversal, with key levels at 77,188 (upside) and 75,500 (downside).
Chan Theory shows that the downward move has ended at 74,251, and the upward move is very strong (+2,937), currently at the end of an upward wave and transitioning into a new downward wave, watch for confirmation of the 76,297 bottom pattern.
Wave
BTC-0.15%
View Original
post-image
post-image
  • Reward
  • Comment
  • Repost
  • Share
Regarding the Settlement Agreement between Core Foundation and Maple Finance
$CORE ‌“Neither side admits fault, but time is running out”
1. Restoring the Event Timeline
In early 2025, Core Foundation and Maple Finance jointly launched lstBTC, allowing Bitcoin holders to earn yields through the Core chain. Core invested in technology, marketing, and substantial subsidies, causing Maple’s asset under management (AUM) to surge from less than $500 million to $2.8 billion. The lstBTC pilot project attracted over $150 million in Bitcoin deposits.
However, in mid-2025, Maple was accused of s
CORE3.93%
BTC-0.14%
SYRUP2.27%
View Original
  • Reward
  • 1
  • Repost
  • Share
GateUser-cb441f20:
Steadfast HODL💎
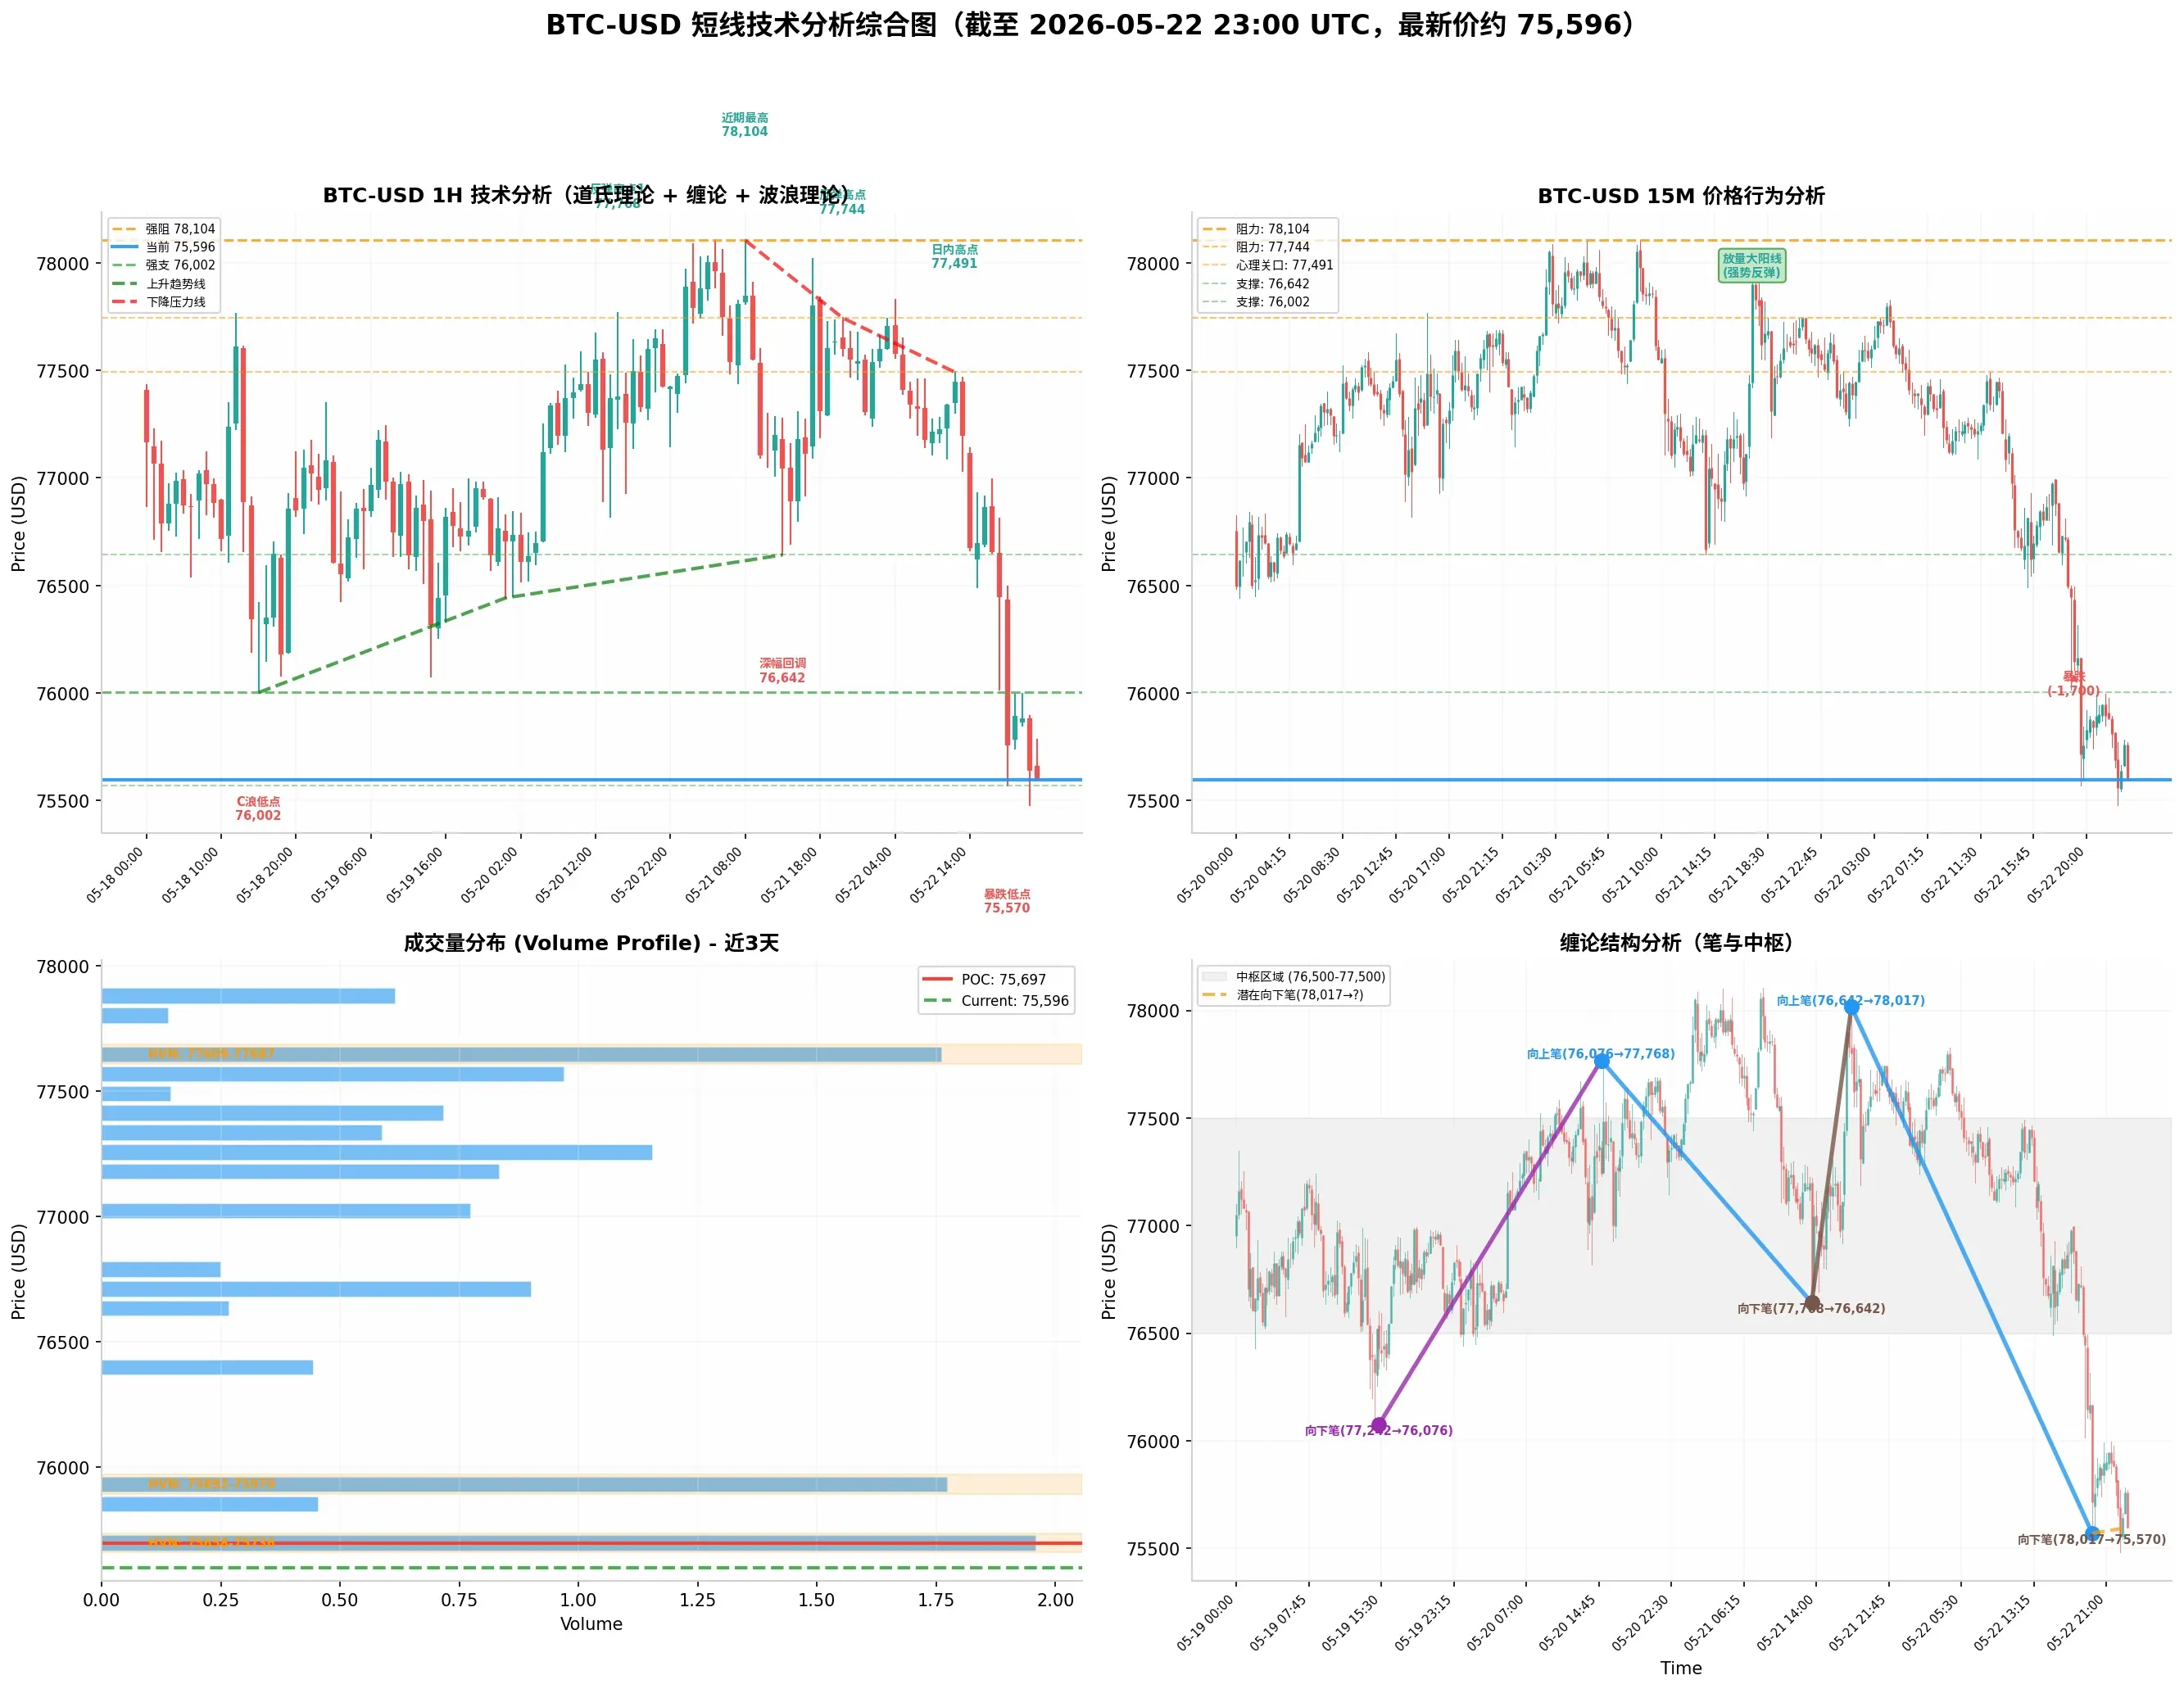
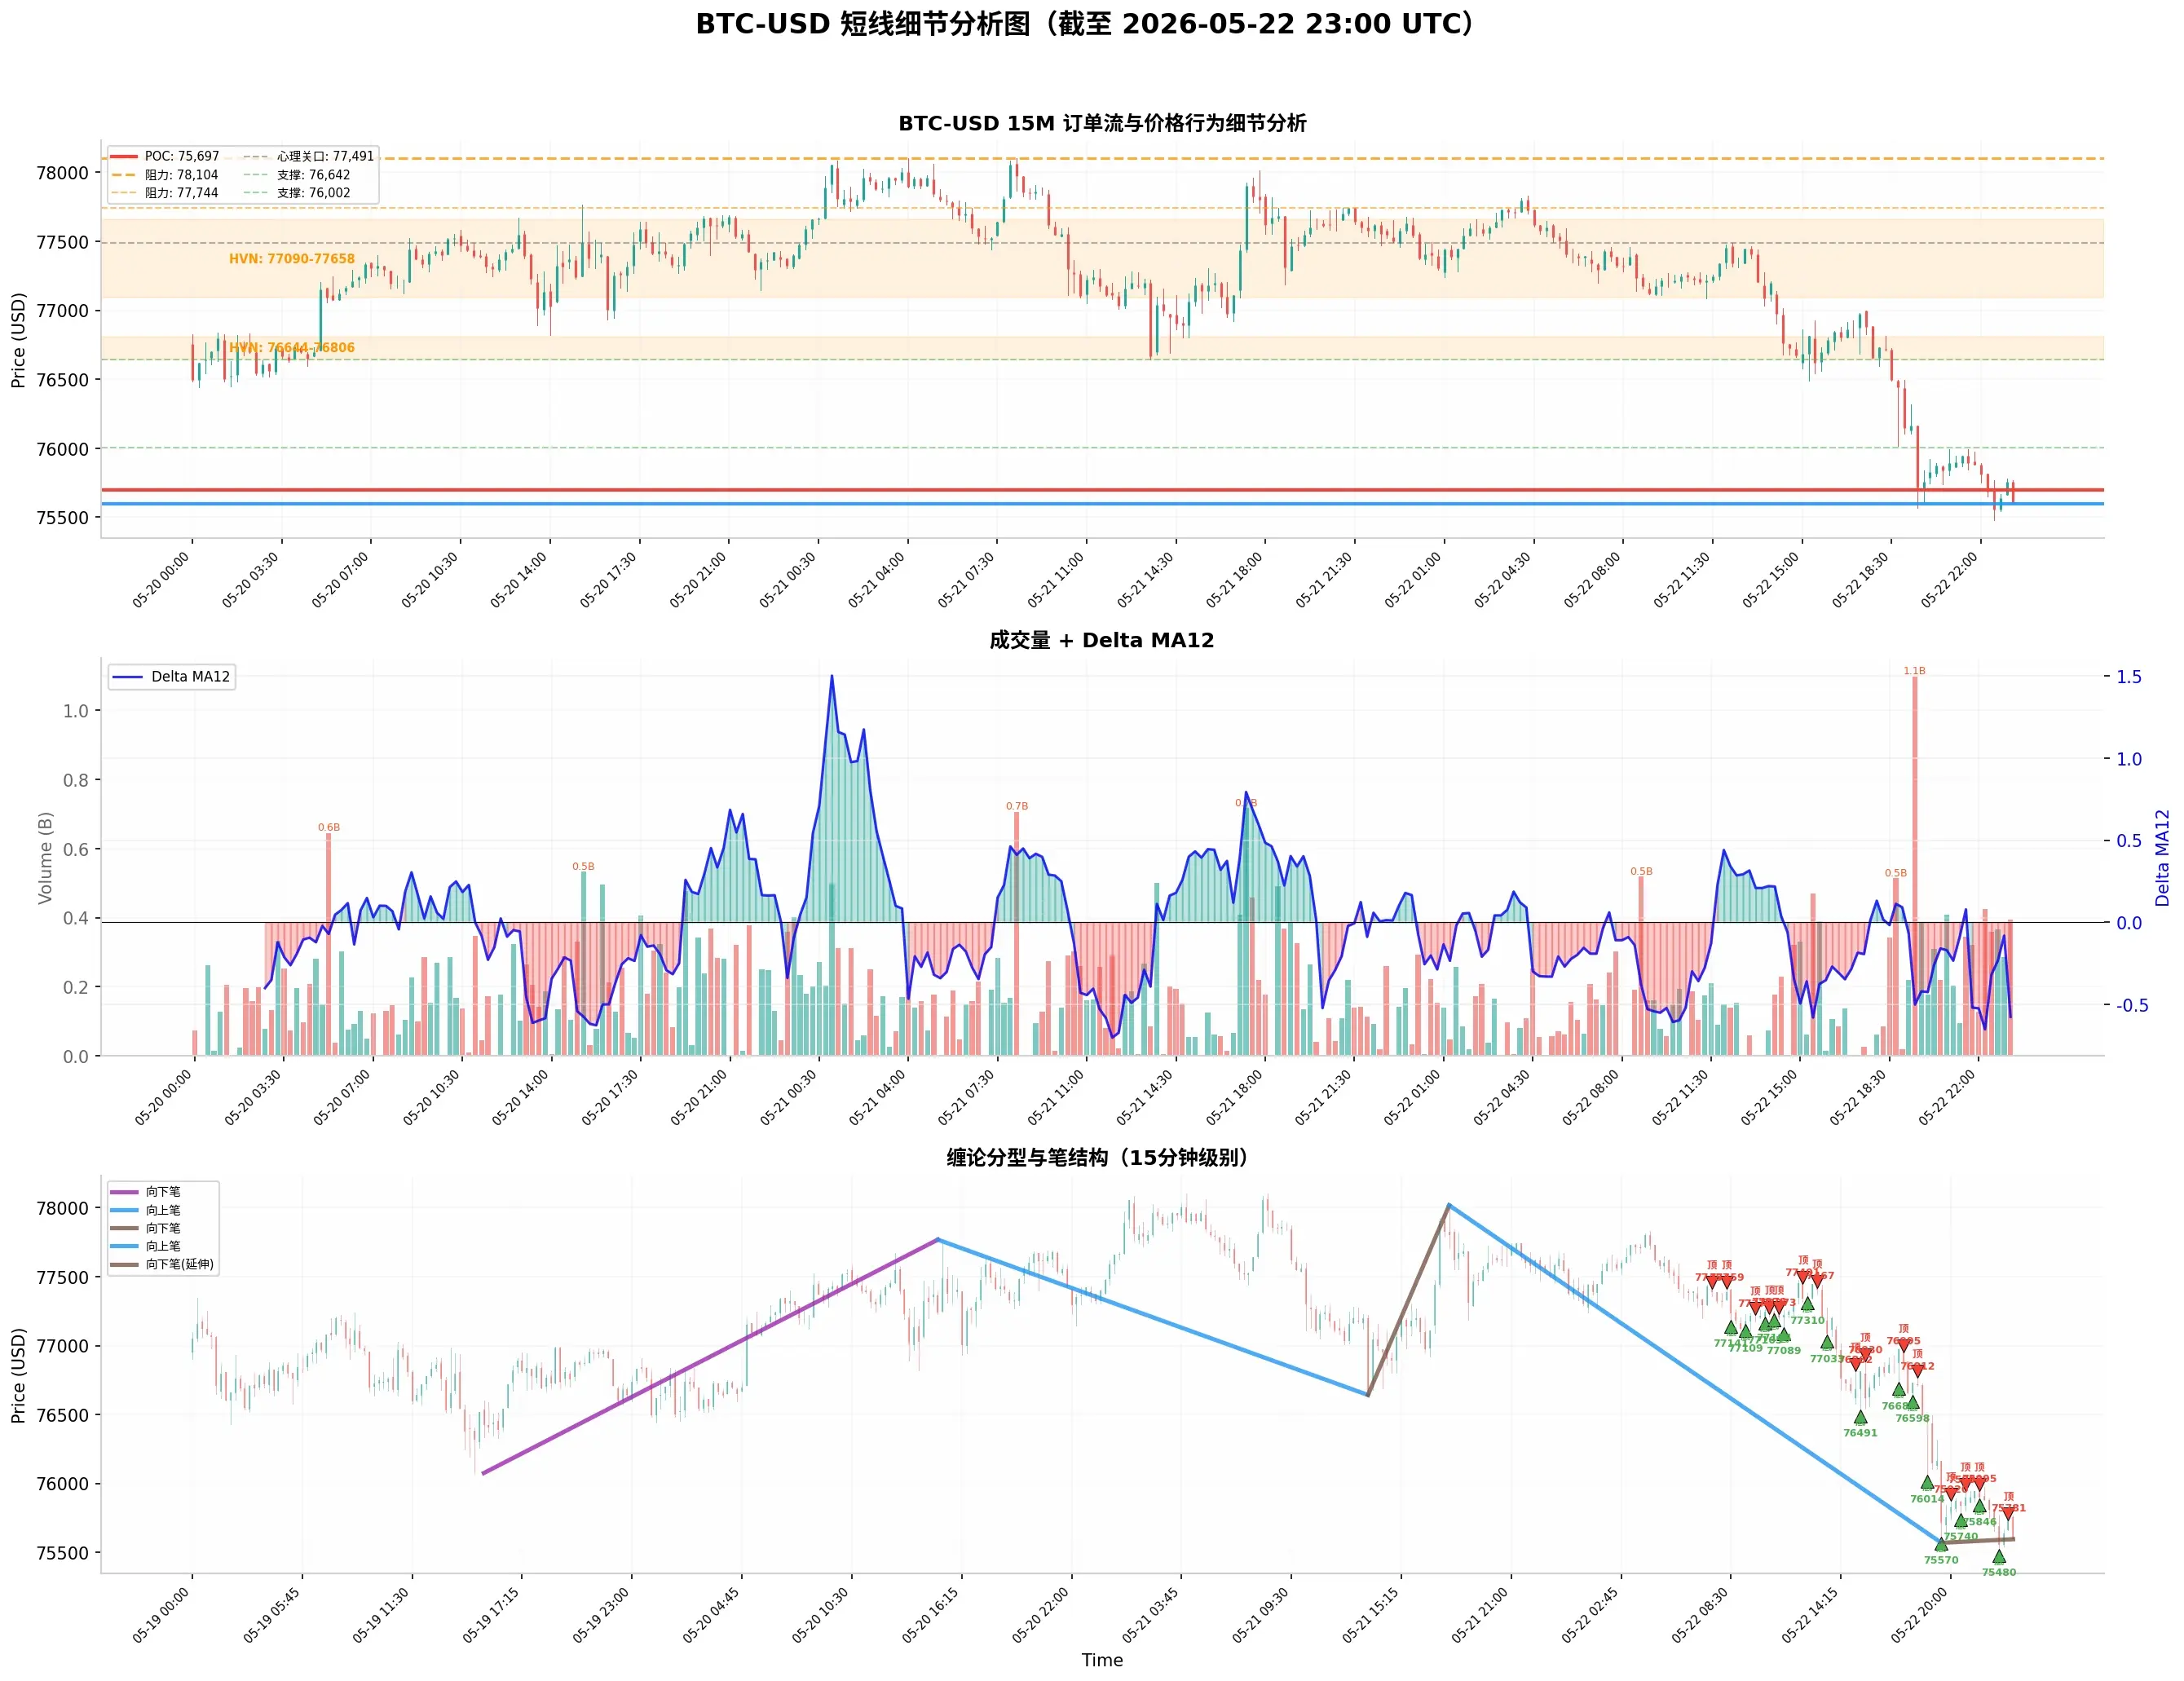
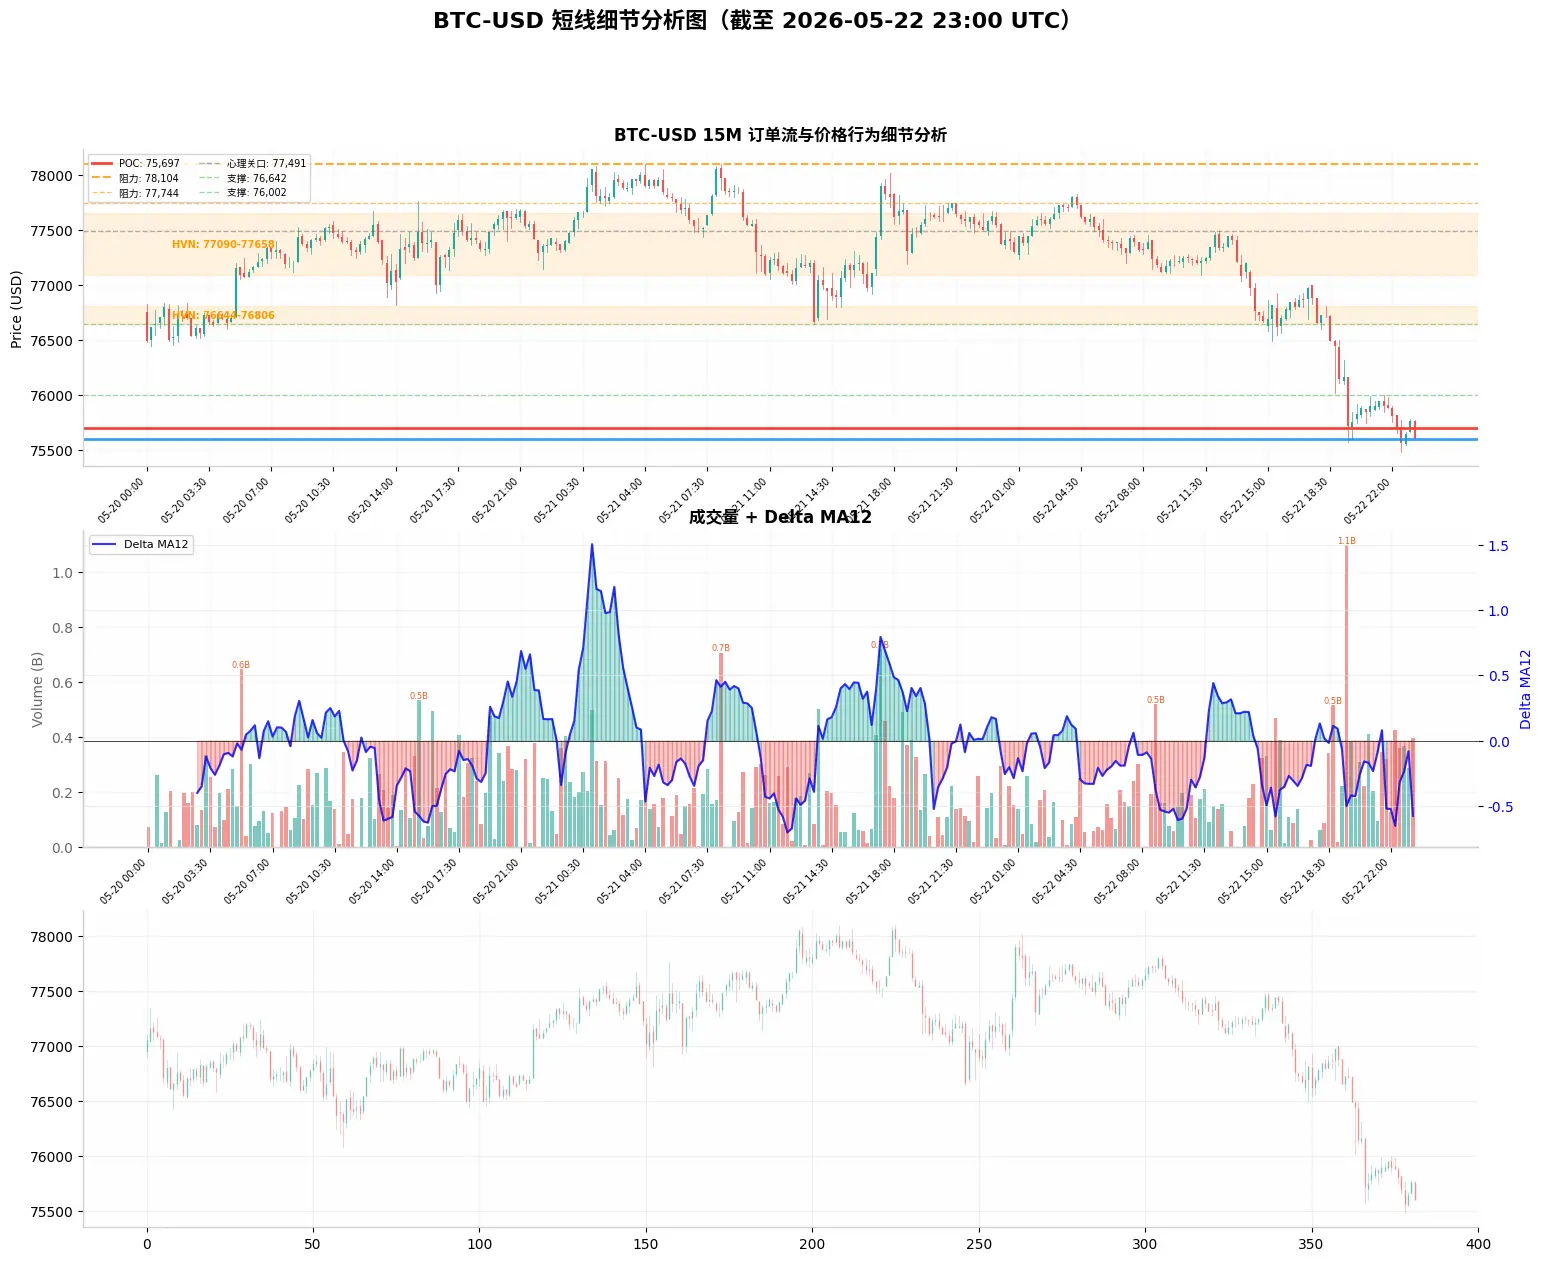
Based on Dow Theory, Chan Theory, Elliott Wave Theory, Volume-Price Relationship, Order Flow, and Price Action Analysis of BTC Short-term Trends
$BTC
1. Dow Theory
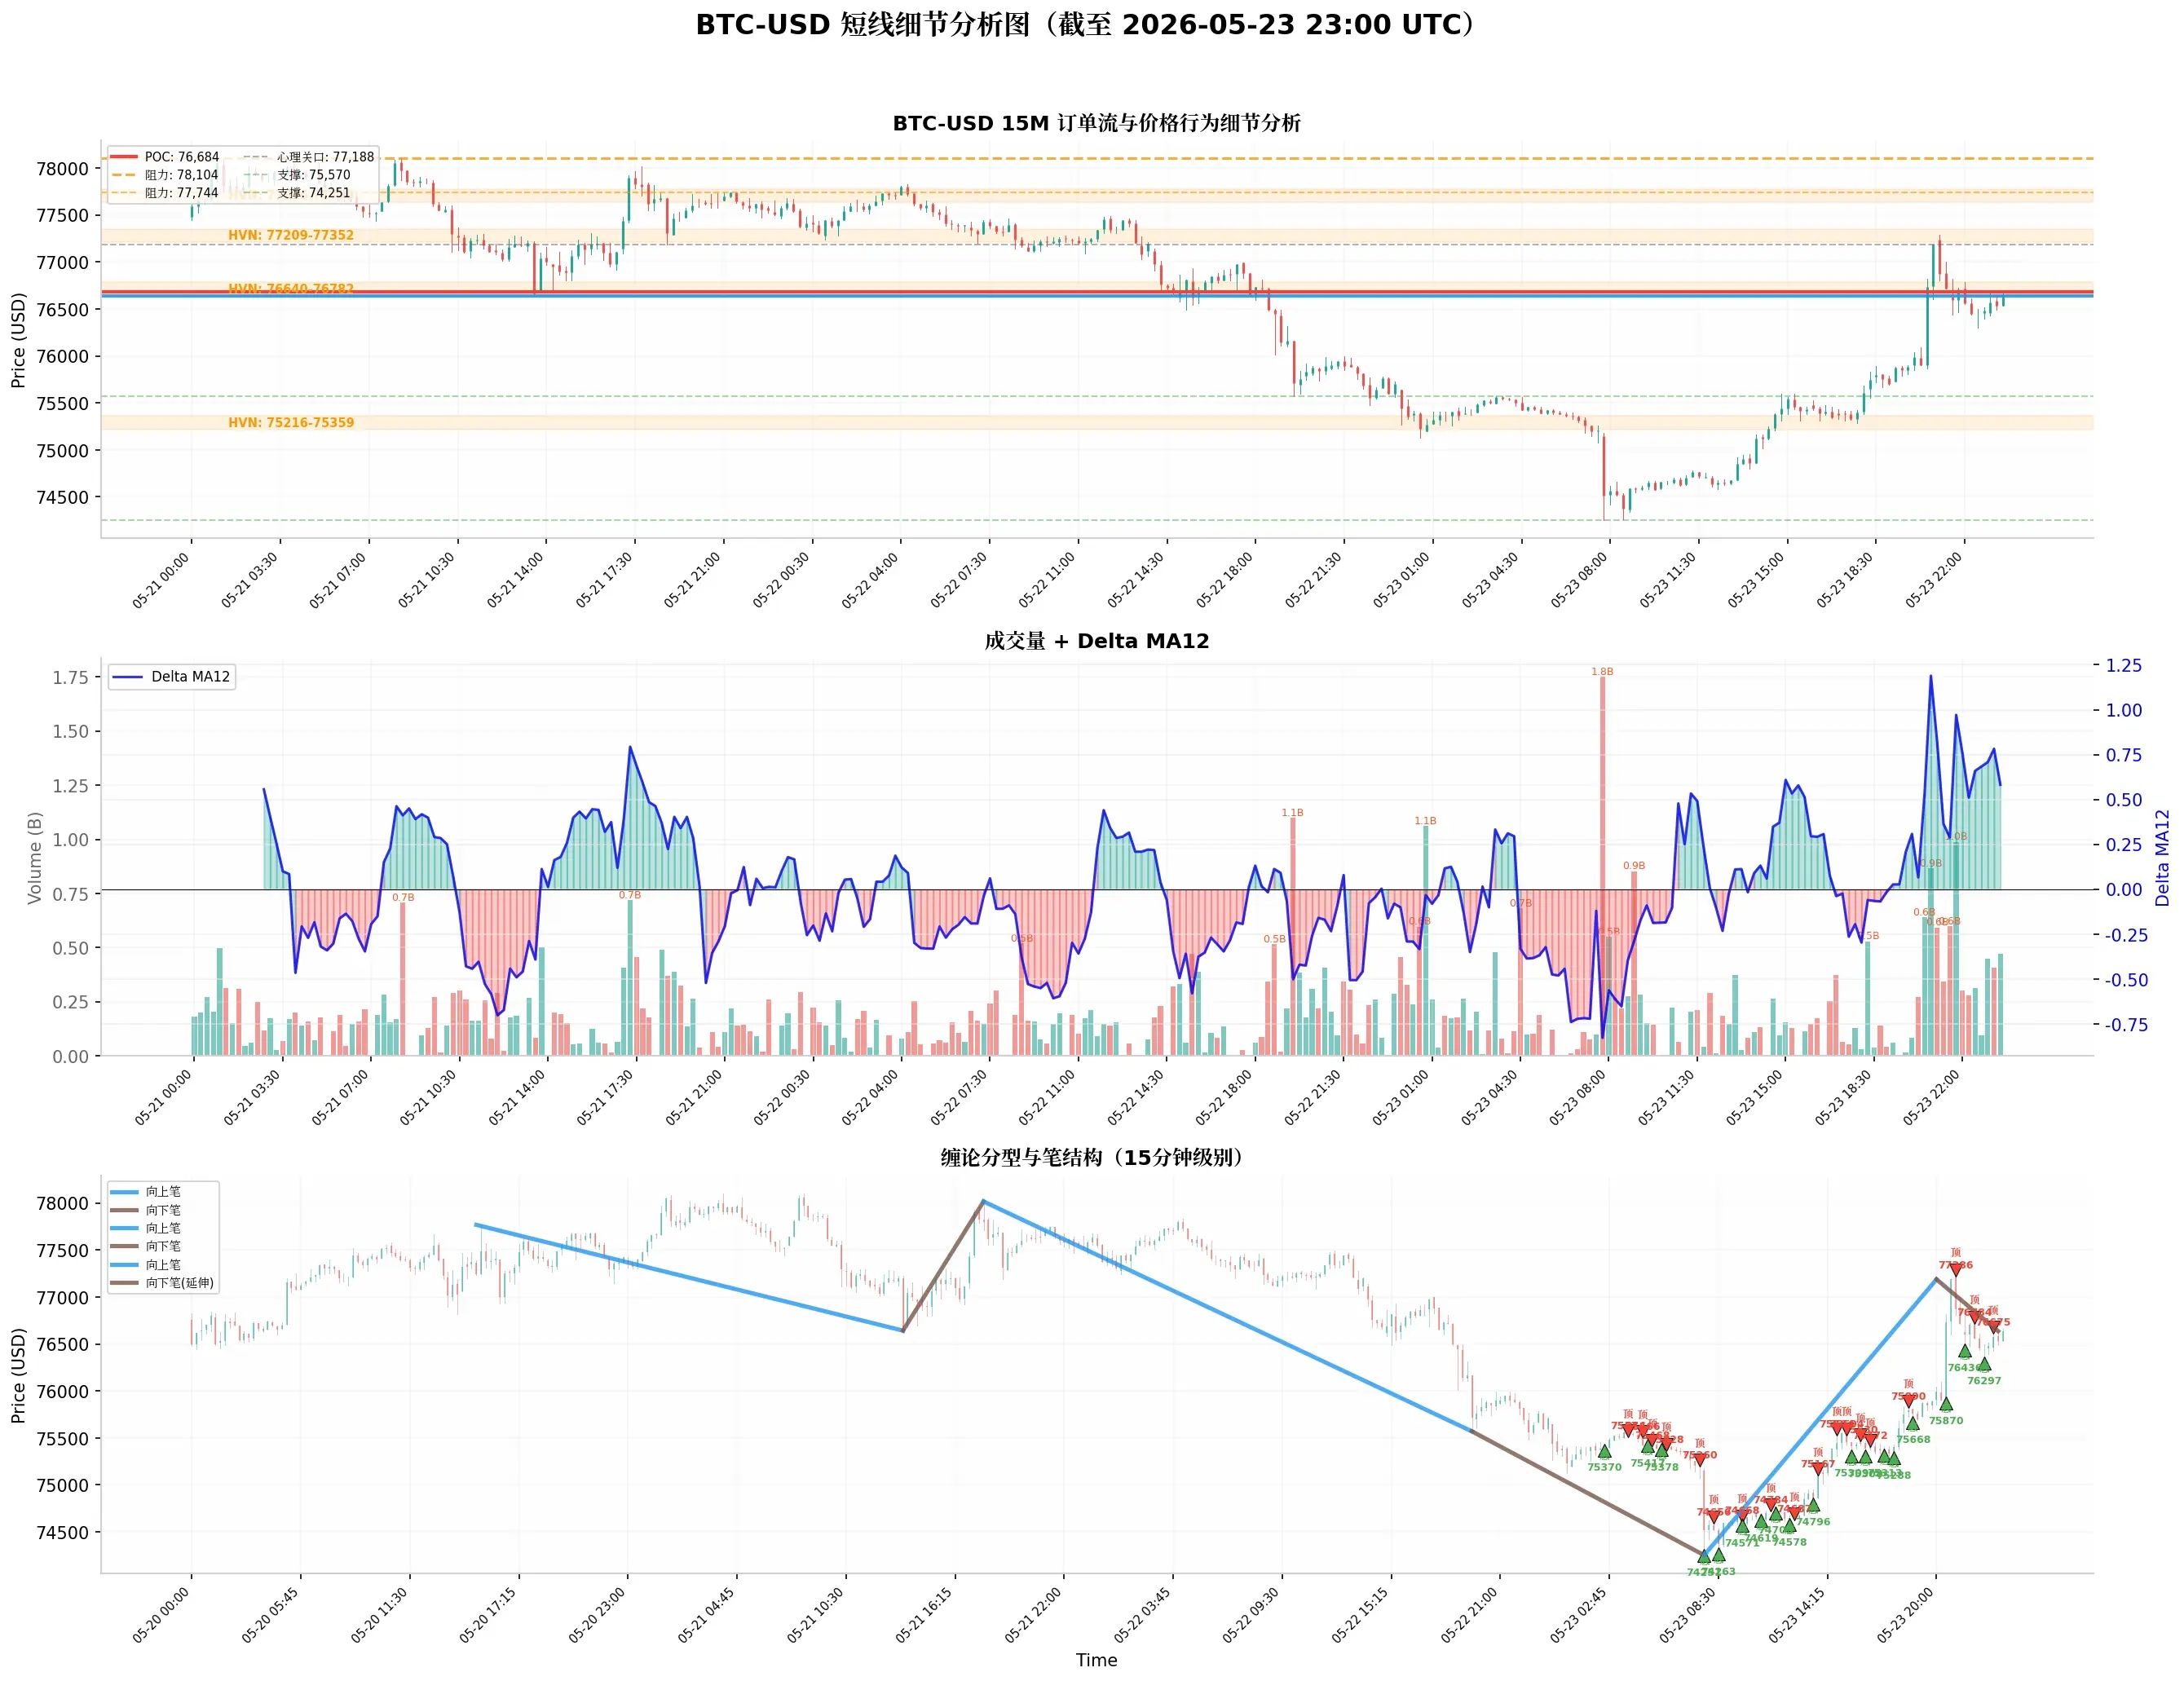
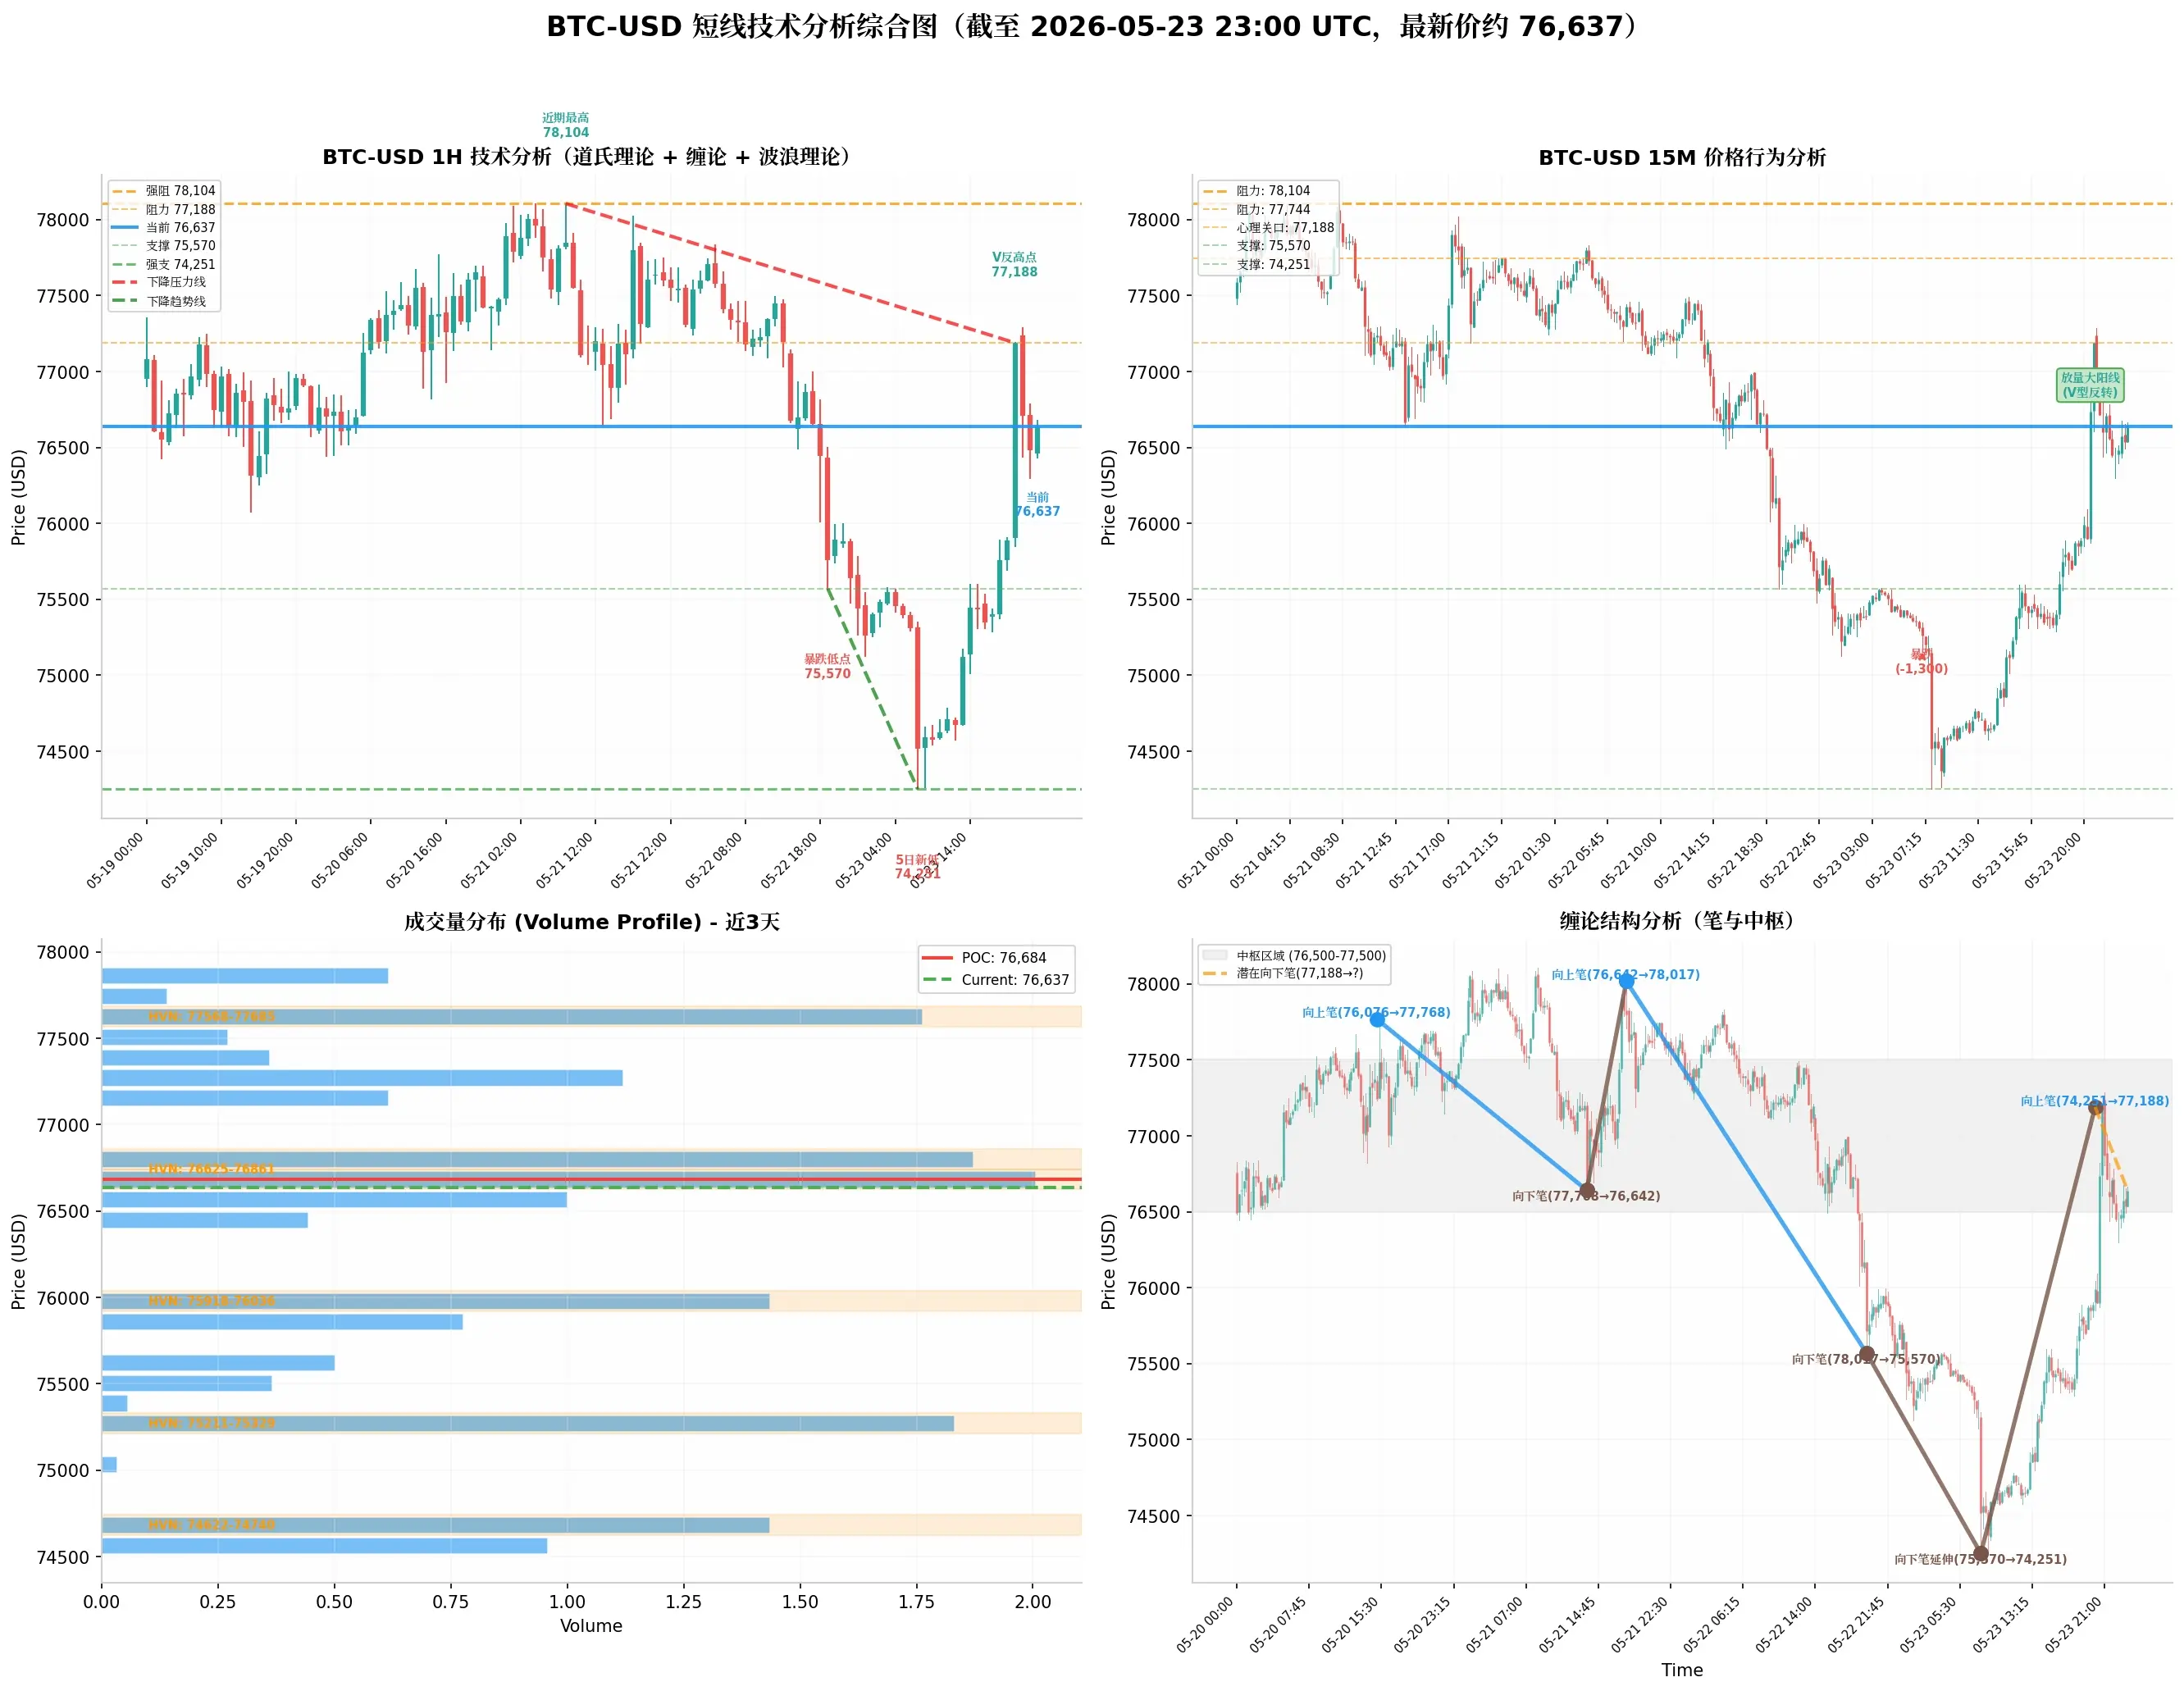
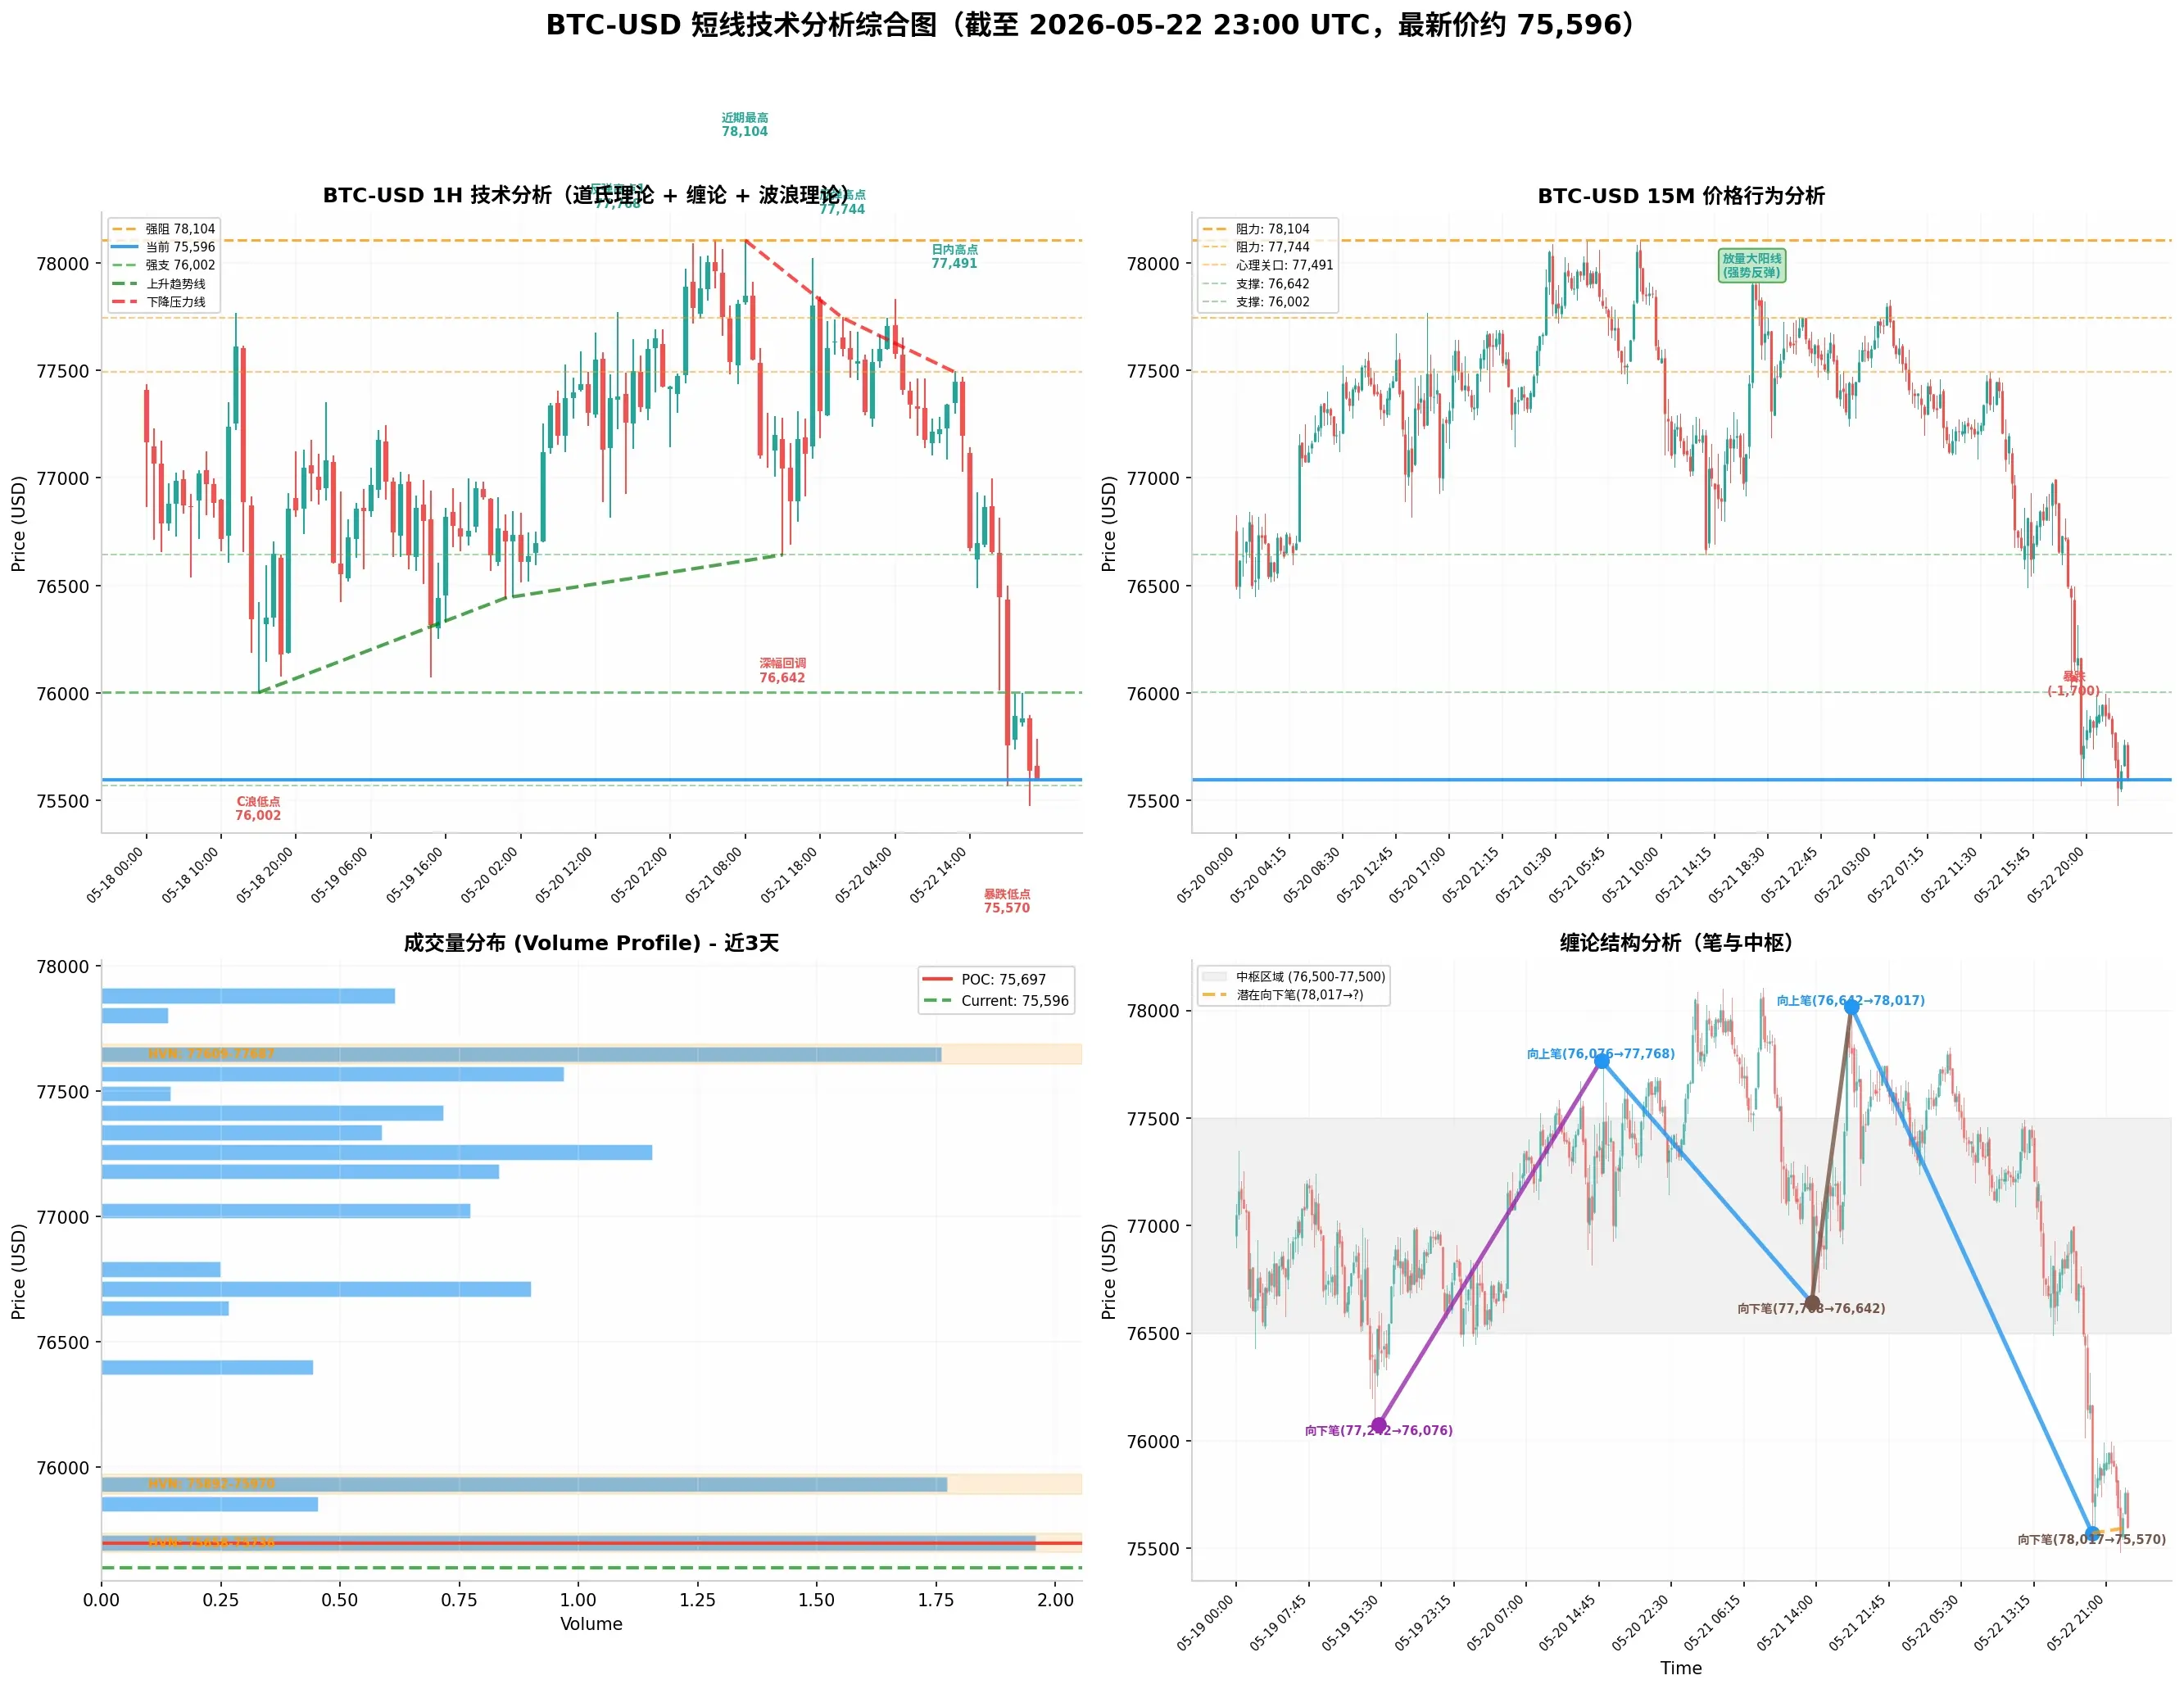
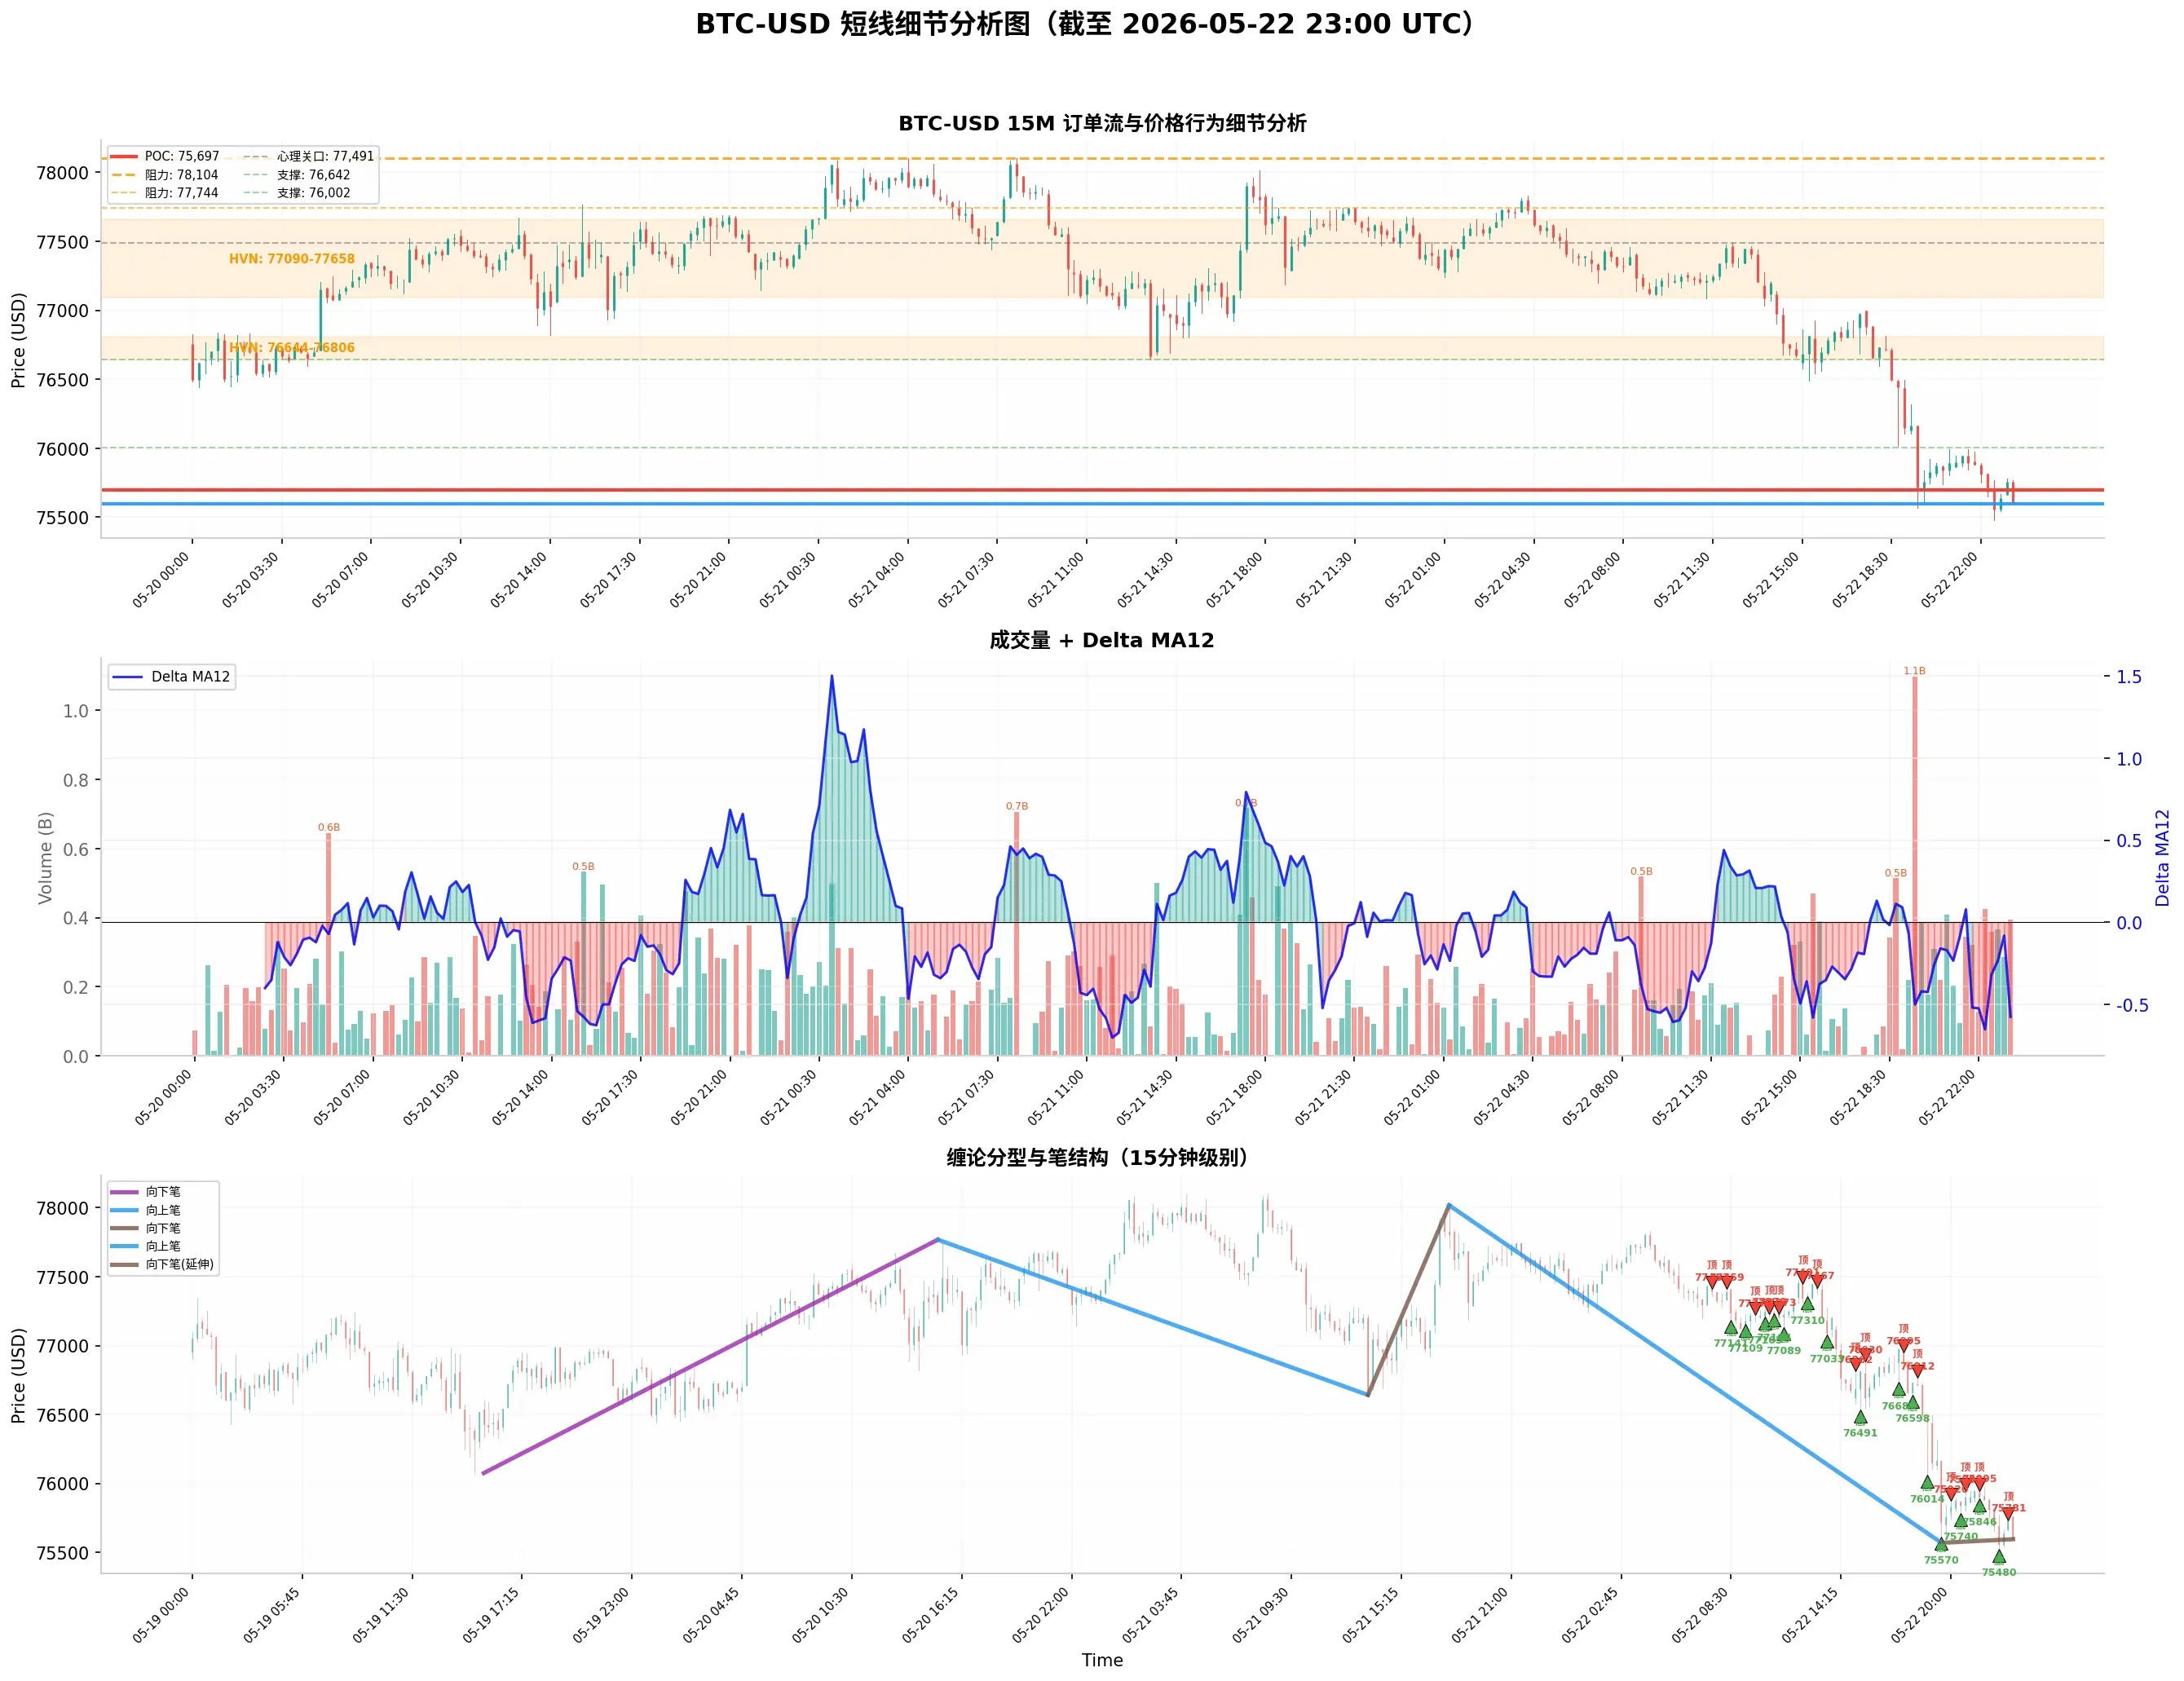
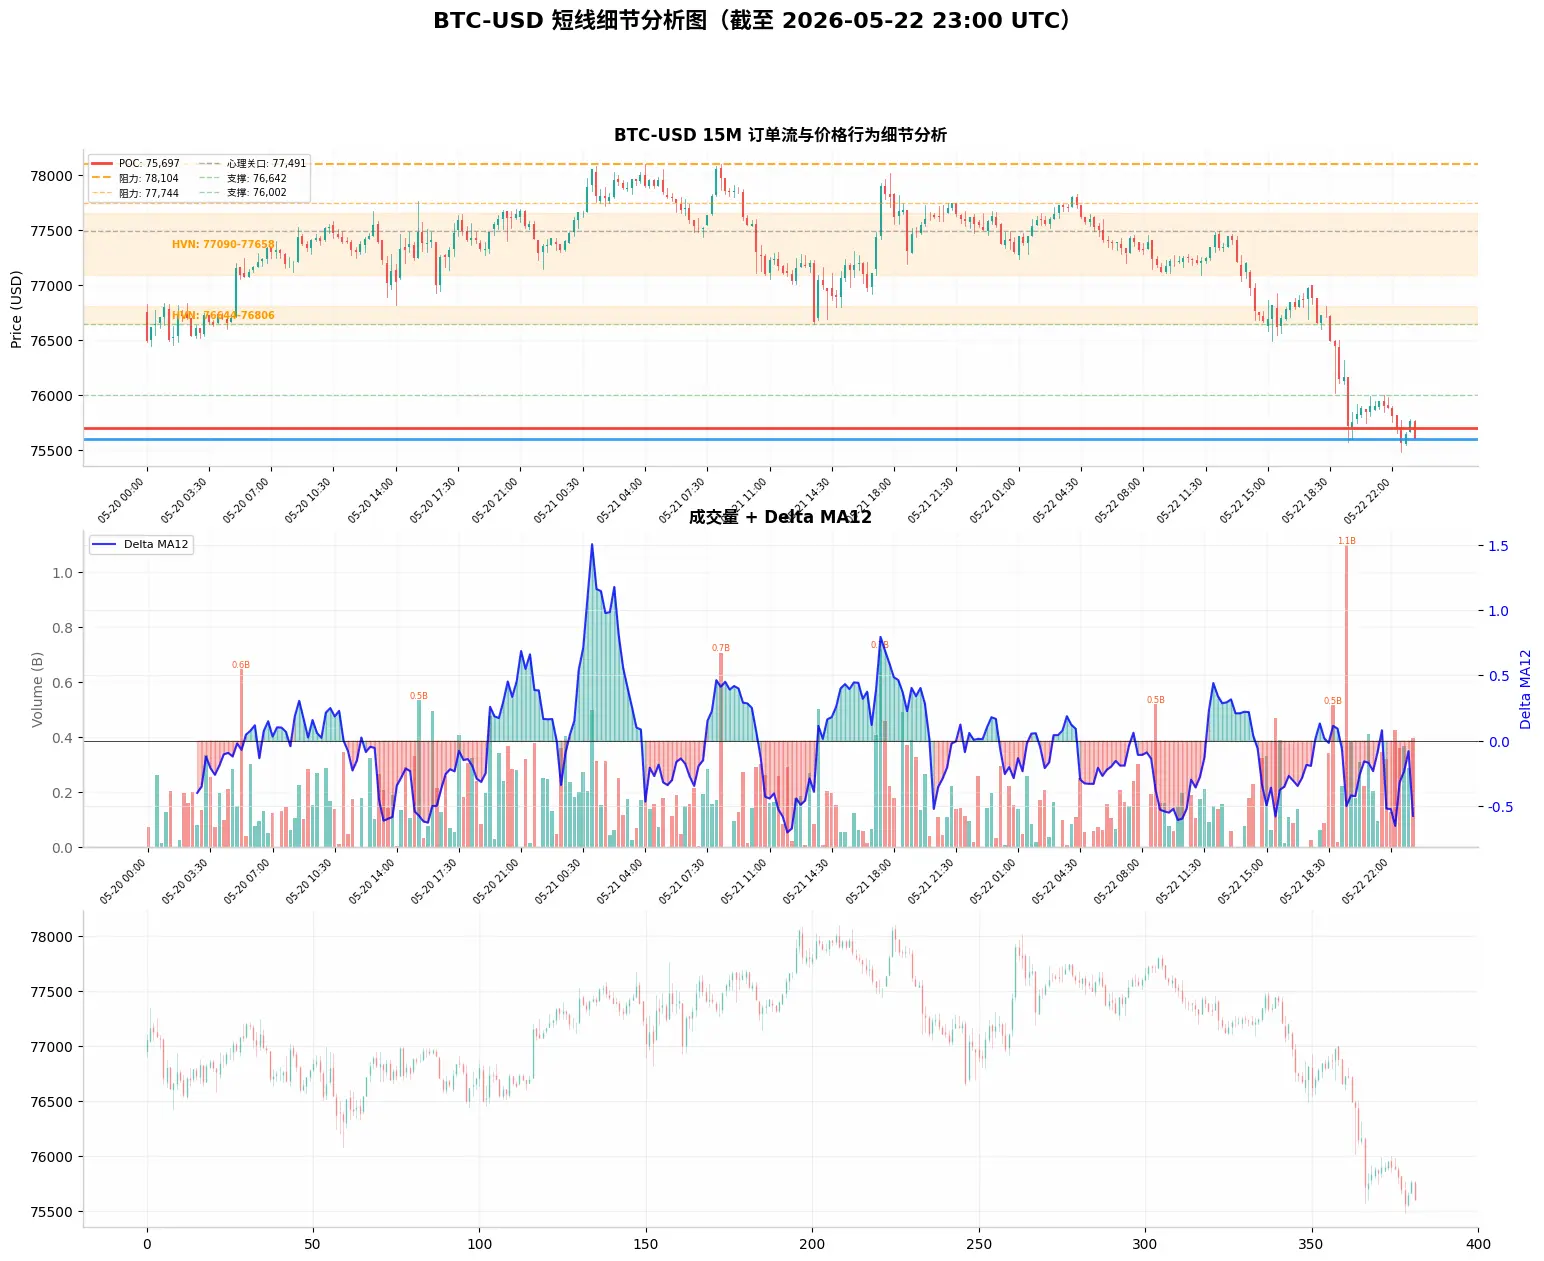
Main Trend (1-hour level): The medium-term downtrend from the high point of 82,448 on May 10 is still ongoing. After making a new low of 76,002 on May 18, the market experienced a strong rebound correction, with the swing low moving up from 76,002 to 76,440 (May 20) and then to 76,642 (May 21). The swing high also moved up from 77,768 to 78,104, briefly giving hope for a trend reversal. However, on May 22, a severe crash occu
BTC-0.15%
View Original
post-image
post-image
post-image
  • Reward
  • Comment
  • Repost
  • Share
Based on Dow Theory, Chan Theory, Wave Theory, Volume-Price Relationship, Order Flow, and Price Action Analysis of BTC Short-term Trends (Strategy Recommendations)
$BTC
Comprehensive Judgment
Dow Theory indicates a primary downward trend with signs of acceleration, with the short-term trend being steep decline, key levels at 76,000 (upper) and 75,480 (lower).
Chan Theory shows very strong downward stroke force (-2,447) far exceeding the upward strokes, currently in the downward stroke extension phase, with no end signal yet.
Wave Theory suggests that the rising structure of Wave 5 has compl
BTC-0.15%
View Original
post-image
post-image
post-image
  • Reward
  • Comment
  • Repost
  • Share
Based on Dow Theory, Chan Theory, Elliott Wave Theory, Volume-Price Relationship, Order Flow, and Price Action, a shallow analysis of BTC short-term trend
$BTC ‌1. Dow Theory (Dow Theory)
Main trend (1-hour level): Since the high point of 82,448 on May 10, the medium-term downtrend remains ongoing, but after making a new low of 76,006 on May 18, the downward momentum shows clear signs of exhaustion. The wave low points at the 1-hour level are beginning to shift upward—76,006 → 76,440 (May 20) → 76,632 (May 21)—which is an important early signal that the downtrend may be reversing. The wave hi
BTC-0.15%
View Original
post-image
  • Reward
  • Comment
  • Repost
  • Share
Based on Dow Theory, Chan Theory, Wave Theory, Volume-Price Relationship, Order Flow, and Price Action Analysis of BTC Short-term Trends (Strategy Recommendations)
$BTC ‌Comprehensive Judgment
Dow Theory indicates that the main trend remains downward but with a mid-term bottoming signal, and the short-term trend has shifted to sideways with a bearish bias, with key levels at 78,116 (upper) and 76,632 (lower).
Chan Theory shows that the strength of upward strokes has weakened from extremely strong to very weak, currently at the end of an upward stroke and transitioning into the beginning of a
BTC-0.15%
View Original
post-image
  • Reward
  • Comment
  • Repost
  • Share
  • Pinned