#Nikkei225RecordHigh
In February 2024, the Nikkei 225 index broke its historic high of 38,915.87 points—a record that had stood since the peak of Japan’s asset bubble on December 29, 1989 for more than 34 years. This milestone shocked global financial markets and marked a deep turning point for the Japanese stock market.
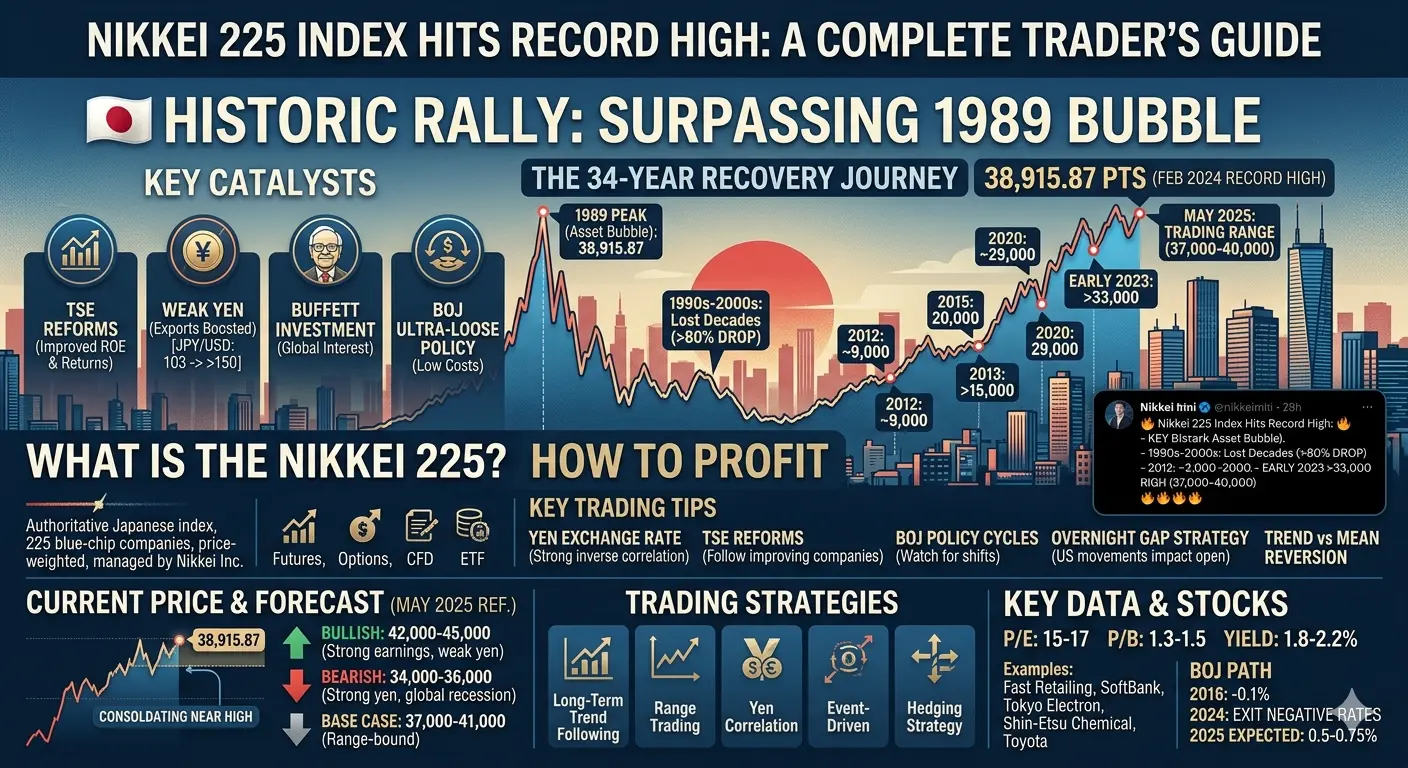
This recovery journey was not overnight. During the 1990s and 2000s, the Nikkei 225 index fell to lows below 7,600 points, losing more than 80% of its value compared to its 1989 peak. This period is known as Japan’s “Lost Decades,” which saw prolonged deflation, stagnant corporate earnings, and deep-rooted pessimism. The index slowly climbed: around 9,000 in 2012, breaking 15,000 in 2013, reaching 20,000 in 2015, trading around 29,000 in 2020, breaking 33,000 in early 2023, and finally closing at 38,915.87 on February 22, 2024, officially surpassing the legendary 1989 record.
Key catalysts behind this historic high include Tokyo Stock Exchange corporate governance reforms aimed at improving capital efficiency, forcing listed companies to increase return on equity and shareholder returns; a sharp depreciation of the Japanese yen (from around 103 JPY/USD in 2021 to above 150 JPY/USD in 2024), which significantly boosted export-driven corporate profits; Warren Buffett’s large investments in Japan’s five major trading houses (Itochu, Marubeni, Mitsubishi, Mitsui, and Sumitomo) between 2020–2023, which reignited global investor interest in Japanese markets; and the Bank of Japan’s ultra-loose monetary policy maintaining low borrowing costs.
Recently, the Nikkei 225 has remained near its historic highs. As of May 2025, the index is fluctuating in the 37,000–40,000 range, with market sentiment still optimistic but cautious amid ongoing global macroeconomic uncertainty.
2. What is the Nikkei 225 — How Traders Profit: Tips, Plans, and Strategies
The Nikkei 225 is Japan’s most authoritative stock market index, composed of 225 blue-chip companies listed on the Tokyo Stock Exchange. It is calculated and managed by Nikkei Inc. and uses a price-weighted method—meaning higher-priced stocks have a greater impact on index movement, unlike market-cap-weighted indices such as the S&P 500. The Nikkei 225 includes major companies ranging from Toyota and Sony to SoftBank and Mitsubishi, making it a comprehensive indicator of Japan’s economic health.
For traders, the Nikkei 225 offers multiple ways to profit:
Futures Trading (Futures and Options): Osaka Exchange Nikkei 225 futures are among the most actively traded index futures globally. Futures contracts allow traders to control large positions with relatively small margin, amplifying gains (and risks). Mini futures contracts (100 yen per point compared to 1,000 yen per point for standard contracts) provide easier access for smaller traders.
CFD (Contracts for Difference): Many online brokers offer Nikkei 225 CFD trading, allowing traders to speculate on rising or falling prices without owning actual futures contracts. CFDs provide flexible position sizing, high leverage, and 24-hour trading capability.
ETF (Exchange-Traded Funds): For investors preferring traditional exposure, Nikkei 225 ETFs (such as MAXIS Nikkei 225 ETF in Japan or international tracking ETFs) provide direct exposure without active trading.
Key Trading Tips and Plans
Tip 1 — Monitor the Yen Exchange Rate: The Nikkei 225 has a strong inverse correlation with the Japanese yen. A weaker yen usually boosts the index (export profits surge), while a stronger yen can pressure the index. During the 2024 record high, yen depreciation was a key driver. Traders must monitor USD/JPY as an essential indicator.
Tip 2 — Track Corporate Governance Reforms: Tokyo Stock Exchange reforms are still ongoing. Companies showing improved ROE, dividend growth, and share buybacks often outperform the index.
Tip 3 — Understand Bank of Japan Policy Cycles: Policy shifts directly impact markets. In March 2024, the Bank of Japan ended negative interest rates—a historic move—but tightening remains gradual. Volatility often increases around BOJ meetings.
Tip 4 — Use Overnight Gap Strategy: The Nikkei trades during Tokyo hours, while US markets continue after Japan closes. US market movements often create gaps at Tokyo open, providing trading opportunities.
Tip 5 — Trend vs Mean Reversion: After breaking historical highs, the Nikkei enters price discovery with no resistance levels. Trend-following strategies perform better, while range trading works during consolidation zones.
3. Current Price, Forecast, and Trading Strategy
Current Price Levels (May 2025 Reference)
The Nikkei 225 is trading around 37,500–39,500, consolidating near its all-time high of 38,915. After breaking the 1989 record, the index repeatedly tested the 39,000–40,000 zone, but global risks (US tariff uncertainty, geopolitical tensions, and intermittent yen strength) create resistance.
Key reference levels:
1989 all-time high: 38,915.87
2024 breakout high: 38,915.87
2024 intraday high: ~40,000 zone
2023 low: ~27,000
Support: 36,000–37,000
Resistance: 39,500–40,000
Forecast Scenarios
Bullish scenarios suggest that if the yen remains weak, corporate earnings grow, and global risk sentiment improves, the Nikkei 225 could reach 42,000–45,000 by 2025, with some aggressive forecasts targeting 50,000 in 2026–2027 due to valuation re-rating from governance reforms.
Bearish scenarios suggest that if the yen strengthens sharply (e.g., below 130), global recession risk rises, or the Bank of Japan tightens faster than expected, the index could fall back to 34,000–36,000.
Base case expectations suggest a 37,000–41,000 range-bound market in 2025, gradually absorbing profit-taking pressure after record highs.
Trading Strategies
Strategy 1 — Long-Term Trend Following:
Hold long positions above 36,000 support. Entry after bounce from 36,500–37,000 zone with daily close above 37,500. Stop-loss below 35,500. Targets: 39,500 → 41,000 → 42,500.
Strategy 2 — Range Trading:
Buy near 37,000–37,500 support and sell near 39,000–39,500 resistance. Stop-loss below 36,000 or above 40,500 depending on direction.
Strategy 3 — Yen Correlation Strategy:
Go long Nikkei when USD/JPY strengthens from key support (145). Reduce exposure or hedge when USD/JPY reaches resistance (155+) and shows reversal.
Strategy 4 — Event-Driven Strategy:
Trade around BOJ meetings, corporate earnings, TSE reforms, and US macro data releases.
Strategy 5 — Hedging Strategy:
Use puts or short futures as protection near all-time highs when volatility is low.
4. Key Data Explanation (Text Form)
The Nikkei 225 fell from 38,915 in 1989 to a low of 7,054 in 2009, a drop of nearly 80%. Recovery milestones include: 2012 (~9,400), 2013 (~15,000), 2015 (~20,000), 2020 (~27,000), 2023 (~33,000), and 2024 breakout above 38,915.
Valuation metrics:
P/E ratio: ~15–17
P/B ratio: ~1.3–1.5
Dividend yield: ~1.8–2.2%
The Japanese yen moved from 103 (2021) to around 155 (2025), with depreciation strongly supporting exporters.
Key stocks include: Fast Retailing (7751), SoftBank (9984), Tokyo Electron (8035), Shin-Etsu Chemical (4063), and Toyota (7203). Because the index is price-weighted, high-priced stocks like Tokyo Electron have more influence than larger companies like Toyota.
BOJ policy path:
2016: -0.1% negative rates
2024: exit from negative rates
2025 expectations: 0.5–0.75%
Social Media Post
🔥 Japan’s Nikkei 225 has made history by surpassing its 1989 peak after 34 years—one of the greatest recoveries in financial history.
Corporate reforms, yen depreciation, Buffett effect, and BOJ policy created this powerful rally.
The index is now consolidating near all-time highs with strong support at 36,000 and resistance near 40,000.
Mid-term targets point toward 42,000–45,000, with long-term upside even higher under favorable conditions.
The key insight: USD/JPY drives the Nikkei. Understanding the yen is half the trading edge.
What is your strategy—trend following or range trading? 🚀
@Gate_Square @Gate广场_Official #TradfiTradingChallenge #DailyPolymarketHotspot
In February 2024, the Nikkei 225 index broke its historic high of 38,915.87 points—a record that had stood since the peak of Japan’s asset bubble on December 29, 1989 for more than 34 years. This milestone shocked global financial markets and marked a deep turning point for the Japanese stock market.
This recovery journey was not overnight. During the 1990s and 2000s, the Nikkei 225 index fell to lows below 7,600 points, losing more than 80% of its value compared to its 1989 peak. This period is known as Japan’s “Lost Decades,” which saw prolonged deflation, stagnant corporate earnings, and deep-rooted pessimism. The index slowly climbed: around 9,000 in 2012, breaking 15,000 in 2013, reaching 20,000 in 2015, trading around 29,000 in 2020, breaking 33,000 in early 2023, and finally closing at 38,915.87 on February 22, 2024, officially surpassing the legendary 1989 record.
Key catalysts behind this historic high include Tokyo Stock Exchange corporate governance reforms aimed at improving capital efficiency, forcing listed companies to increase return on equity and shareholder returns; a sharp depreciation of the Japanese yen (from around 103 JPY/USD in 2021 to above 150 JPY/USD in 2024), which significantly boosted export-driven corporate profits; Warren Buffett’s large investments in Japan’s five major trading houses (Itochu, Marubeni, Mitsubishi, Mitsui, and Sumitomo) between 2020–2023, which reignited global investor interest in Japanese markets; and the Bank of Japan’s ultra-loose monetary policy maintaining low borrowing costs.
Recently, the Nikkei 225 has remained near its historic highs. As of May 2025, the index is fluctuating in the 37,000–40,000 range, with market sentiment still optimistic but cautious amid ongoing global macroeconomic uncertainty.
2. What is the Nikkei 225 — How Traders Profit: Tips, Plans, and Strategies
The Nikkei 225 is Japan’s most authoritative stock market index, composed of 225 blue-chip companies listed on the Tokyo Stock Exchange. It is calculated and managed by Nikkei Inc. and uses a price-weighted method—meaning higher-priced stocks have a greater impact on index movement, unlike market-cap-weighted indices such as the S&P 500. The Nikkei 225 includes major companies ranging from Toyota and Sony to SoftBank and Mitsubishi, making it a comprehensive indicator of Japan’s economic health.
For traders, the Nikkei 225 offers multiple ways to profit:
Futures Trading (Futures and Options): Osaka Exchange Nikkei 225 futures are among the most actively traded index futures globally. Futures contracts allow traders to control large positions with relatively small margin, amplifying gains (and risks). Mini futures contracts (100 yen per point compared to 1,000 yen per point for standard contracts) provide easier access for smaller traders.
CFD (Contracts for Difference): Many online brokers offer Nikkei 225 CFD trading, allowing traders to speculate on rising or falling prices without owning actual futures contracts. CFDs provide flexible position sizing, high leverage, and 24-hour trading capability.
ETF (Exchange-Traded Funds): For investors preferring traditional exposure, Nikkei 225 ETFs (such as MAXIS Nikkei 225 ETF in Japan or international tracking ETFs) provide direct exposure without active trading.
Key Trading Tips and Plans
Tip 1 — Monitor the Yen Exchange Rate: The Nikkei 225 has a strong inverse correlation with the Japanese yen. A weaker yen usually boosts the index (export profits surge), while a stronger yen can pressure the index. During the 2024 record high, yen depreciation was a key driver. Traders must monitor USD/JPY as an essential indicator.
Tip 2 — Track Corporate Governance Reforms: Tokyo Stock Exchange reforms are still ongoing. Companies showing improved ROE, dividend growth, and share buybacks often outperform the index.
Tip 3 — Understand Bank of Japan Policy Cycles: Policy shifts directly impact markets. In March 2024, the Bank of Japan ended negative interest rates—a historic move—but tightening remains gradual. Volatility often increases around BOJ meetings.
Tip 4 — Use Overnight Gap Strategy: The Nikkei trades during Tokyo hours, while US markets continue after Japan closes. US market movements often create gaps at Tokyo open, providing trading opportunities.
Tip 5 — Trend vs Mean Reversion: After breaking historical highs, the Nikkei enters price discovery with no resistance levels. Trend-following strategies perform better, while range trading works during consolidation zones.
3. Current Price, Forecast, and Trading Strategy
Current Price Levels (May 2025 Reference)
The Nikkei 225 is trading around 37,500–39,500, consolidating near its all-time high of 38,915. After breaking the 1989 record, the index repeatedly tested the 39,000–40,000 zone, but global risks (US tariff uncertainty, geopolitical tensions, and intermittent yen strength) create resistance.
Key reference levels:
1989 all-time high: 38,915.87
2024 breakout high: 38,915.87
2024 intraday high: ~40,000 zone
2023 low: ~27,000
Support: 36,000–37,000
Resistance: 39,500–40,000
Forecast Scenarios
Bullish scenarios suggest that if the yen remains weak, corporate earnings grow, and global risk sentiment improves, the Nikkei 225 could reach 42,000–45,000 by 2025, with some aggressive forecasts targeting 50,000 in 2026–2027 due to valuation re-rating from governance reforms.
Bearish scenarios suggest that if the yen strengthens sharply (e.g., below 130), global recession risk rises, or the Bank of Japan tightens faster than expected, the index could fall back to 34,000–36,000.
Base case expectations suggest a 37,000–41,000 range-bound market in 2025, gradually absorbing profit-taking pressure after record highs.
Trading Strategies
Strategy 1 — Long-Term Trend Following:
Hold long positions above 36,000 support. Entry after bounce from 36,500–37,000 zone with daily close above 37,500. Stop-loss below 35,500. Targets: 39,500 → 41,000 → 42,500.
Strategy 2 — Range Trading:
Buy near 37,000–37,500 support and sell near 39,000–39,500 resistance. Stop-loss below 36,000 or above 40,500 depending on direction.
Strategy 3 — Yen Correlation Strategy:
Go long Nikkei when USD/JPY strengthens from key support (145). Reduce exposure or hedge when USD/JPY reaches resistance (155+) and shows reversal.
Strategy 4 — Event-Driven Strategy:
Trade around BOJ meetings, corporate earnings, TSE reforms, and US macro data releases.
Strategy 5 — Hedging Strategy:
Use puts or short futures as protection near all-time highs when volatility is low.
4. Key Data Explanation (Text Form)
The Nikkei 225 fell from 38,915 in 1989 to a low of 7,054 in 2009, a drop of nearly 80%. Recovery milestones include: 2012 (~9,400), 2013 (~15,000), 2015 (~20,000), 2020 (~27,000), 2023 (~33,000), and 2024 breakout above 38,915.
Valuation metrics:
P/E ratio: ~15–17
P/B ratio: ~1.3–1.5
Dividend yield: ~1.8–2.2%
The Japanese yen moved from 103 (2021) to around 155 (2025), with depreciation strongly supporting exporters.
Key stocks include: Fast Retailing (7751), SoftBank (9984), Tokyo Electron (8035), Shin-Etsu Chemical (4063), and Toyota (7203). Because the index is price-weighted, high-priced stocks like Tokyo Electron have more influence than larger companies like Toyota.
BOJ policy path:
2016: -0.1% negative rates
2024: exit from negative rates
2025 expectations: 0.5–0.75%
Social Media Post
🔥 Japan’s Nikkei 225 has made history by surpassing its 1989 peak after 34 years—one of the greatest recoveries in financial history.
Corporate reforms, yen depreciation, Buffett effect, and BOJ policy created this powerful rally.
The index is now consolidating near all-time highs with strong support at 36,000 and resistance near 40,000.
Mid-term targets point toward 42,000–45,000, with long-term upside even higher under favorable conditions.
The key insight: USD/JPY drives the Nikkei. Understanding the yen is half the trading edge.
What is your strategy—trend following or range trading? 🚀
@Gate_Square @Gate广场_Official #TradfiTradingChallenge #DailyPolymarketHotspot