TRON (TRX) is establishing itself as one of the leading stablecoin payment platforms, thanks to its high practical application value and increasing widespread usage. According to the latest report from Coin Photon, USDT transactions currently make up the majority of weekly transactions on the TRON network, highlighting the platform’s central role in the stablecoin payment ecosystem.
Moreover, an efficient fee-burning mechanism combined with increasingly active staking activities has helped reinforce and increase the protocol’s value. Notably, the digital payment platform Wirex has also announced the deployment of a fully on-chain payment layer on TRON, opening new approaches for daily spending activities and significantly promoting the network’s real-world application.
Is TRON about to resume an uptrend?
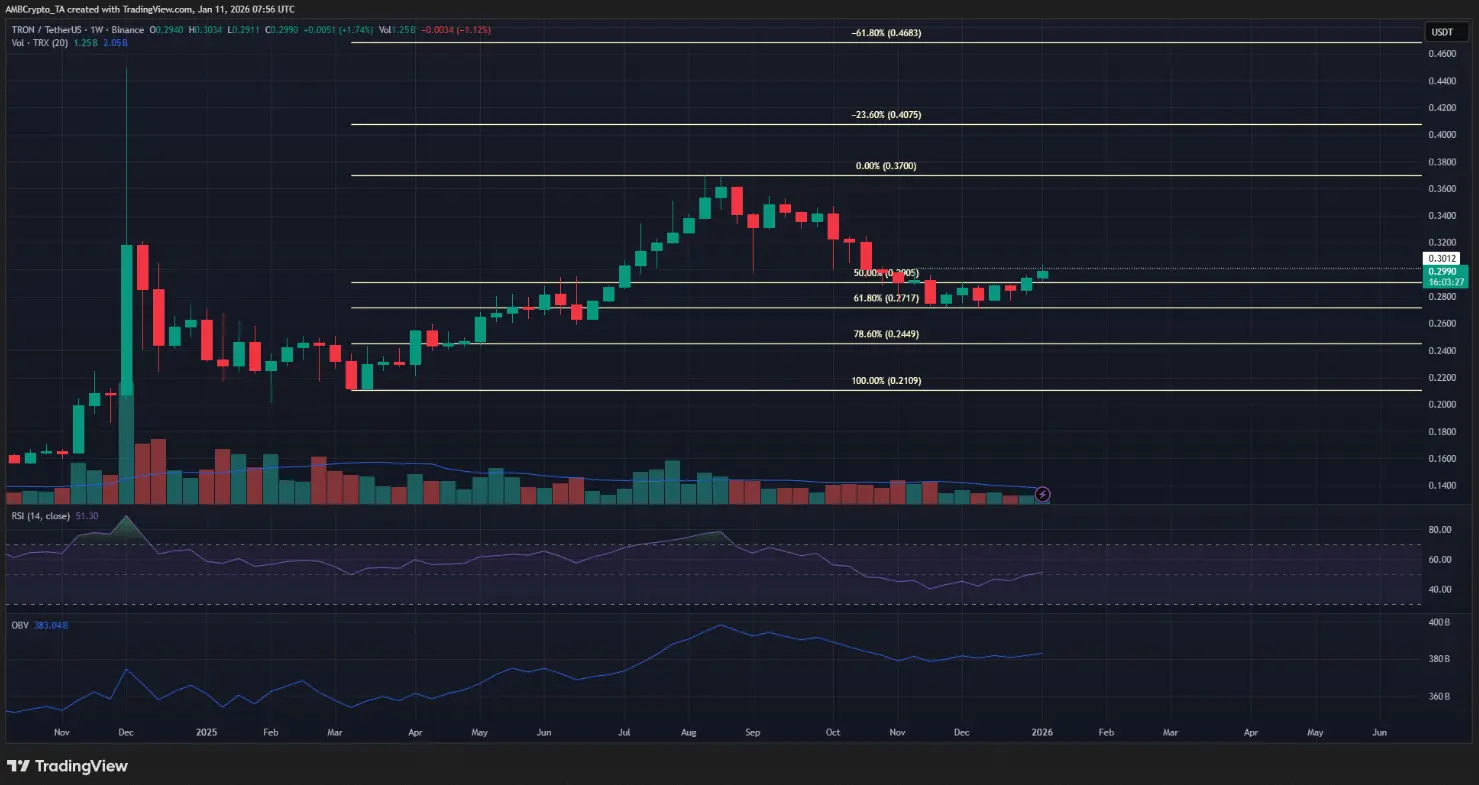 Weekly TRX/USDT Chart | Source: TradingViewThe weekly chart shows that TRX is still moving within a solid bullish structure. The strong rally from March to August pushed the price from $0.21 to $0.37. By the end of the year, the market entered a correction phase, pulling the price back to test the 61.8% Fibonacci level around $0.272 — an important technical support zone.
After completing the test, TRX quickly rebounded, further strengthening the long-term growth outlook. This development opens opportunities for medium-term traders to consider a (Long) strategy in the near future.
Regarding indicators, OBV has shown a slow but steady increase since November, indicating that buying volume remains stable. Meanwhile, the weekly RSI has risen to the 51 zone, reflecting a gradually forming and spreading bullish momentum across larger timeframes.
Why might TRON still be unprepared for a strong breakout?
This is a scenario traders need to be especially cautious about. The $0.30 level is not only a psychologically significant resistance but also served as a notable supply zone in the first two weeks of November.
At the time of writing, TRX was already rejected on lower timeframes on Saturday (January 10). Although the price briefly reached $0.3025, buying pressure quickly weakened, causing TRX to reverse and decline 1.19% to around $0.2990.
More notably, Bitcoin (BTC) momentum has shown signs of stalling in recent days. In a scenario where BTC corrects and loses the $89,000 support zone, the market is likely to see increased selling pressure, which could lead to downside risks for the TRON token.
Trader strategy: Wait for a breakout to buy
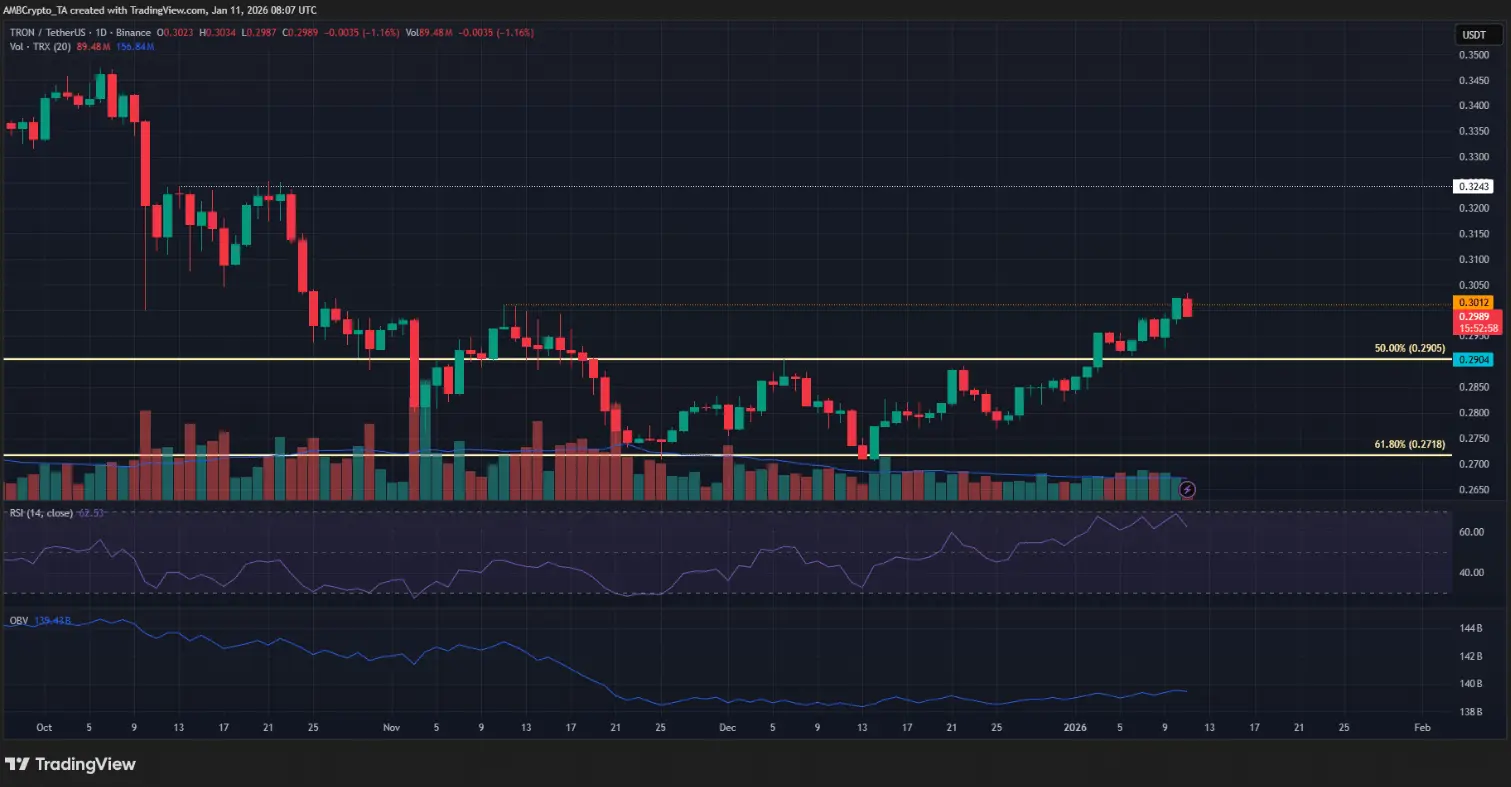 Daily TRX/USDT Chart | Source: TradingViewThe $0.3012 level marks an important oscillation peak formed in early November on the daily chart.
Given that the bullish structure remains intact on the weekly chart and a breakout appears increasingly likely, traders can patiently wait for the price to surpass and reclaim the $0.3012 level, confirming this zone as a solid support before considering opening long positions.
If the positive scenario unfolds, the next price targets are $0.324 and $0.347 respectively. Conversely, losing the $0.29 level would break the bullish outlook, forcing the market to reassess the current trend.
Disclaimer: The information on this page may come from third parties and does not represent the views or opinions of Gate. The content displayed on this page is for reference only and does not constitute any financial, investment, or legal advice. Gate does not guarantee the accuracy or completeness of the information and shall not be liable for any losses arising from the use of this information. Virtual asset investments carry high risks and are subject to significant price volatility. You may lose all of your invested principal. Please fully understand the relevant risks and make prudent decisions based on your own financial situation and risk tolerance. For details, please refer to
Disclaimer.
Related Articles
SHIB Derivatives See 1,549% Jump in Netflows: Is Short Squeeze Brewing? - U.Today
Shiba Inu (SHIB) experienced a 1,549% increase in futures netflows as traders adjusted their positions, with inflows surpassing outflows. Despite a recent price drop, positive on-chain indicators suggest potential for a market rebound if buyers return.
UToday1h ago
鏈上熱到爆、以太幣卻漲不動?專家揭「致命死穴」:恐下探 1,500 美元
CryptoQuant 報告指出,以太坊面臨「採用悖論」,雖然網路活躍度創新高,但幣價卻下滑。若熊市持續,到第三季末以太幣可能跌至 1,500 美元。智能合約活躍度上升與以太幣價格脫鉤,交易所流入量更能反映價格動態。投資需求疲軟,資金持續流失是主要隱憂。
区块客1h ago
英國前首相喊:比特幣是龐氏騙局,川普次子 Eric Trump、Michael Saylor 強力反駁
前英國首相波里斯·強森在《每日郵報》指控比特幣為「龐氏騙局」,引發加密界人士如Eric Trump和Michael Saylor的反擊,強調比特幣的去中心化特性及其正當性。比特幣近期交易價格也突破7.1萬美元。
動區BlockTempo1h ago
彭博社:比特币接近历史级熊市底部,4.5万至5.5万美元或为最终底部区间
彭博社分析认为,比特币接近历史熊市底部,预计4.5万至5.5万美元为最终底部。分析指出,长期技术指标显示比特币低估,市场流动性和成熟度的提升使历史熊市的跌幅逐渐缩小。
GateNews2h ago
今日加密货币恐慌与贪婪指数降至15,市场处于极度恐慌状态
Gate News 消息,3月15日,据 Alternative.me 数据显示,今日加密货币恐慌与贪婪指数降至15,较昨日的16进一步下滑,市场持续处于「极度恐慌状态」。
GateNews4h ago
Bitcoin Treasury Firms on Track to Absorb 10x Daily Mined Bitcoin Supply, Industry Leaders Say
Corporate demand for bitcoin is accelerating as publicly traded companies tap stock and preferred-share financing to accumulate supply, a trend some industry leaders say could significantly increase corporate demand for newly mined coins and potentially influence market dynamics.
Wall Street
Coinpedia5h ago