Bitcoin traded at $70,795 on March 14, 2026, with a market capitalization of $1.41 trillion and 24-hour trading volume of $49.48 billion. The cryptocurrency moved within an intraday range between $70,416 and $73,838 while technical indicators across major timeframes reflected a neutral market structure.
Bitcoin Chart Outlook
On the daily chart, bitcoin continues to trade inside a consolidation range following a rejection near the $74,000 resistance zone. Current price levels around $70,467 on Bitstamp place the asset in the middle of a broader visible trading band between approximately $63,000 and $77,500.
Market structure reflects sideways movement with declining volatility after the rejection near recent highs. Key resistance remains between $73,800 and $74,000, while mid-range resistance sits near $71,200. Support is identified around $69,500, with stronger structural support near $66,000. As long as the price remains above the $69,500 level, the broader bias remains neutral to slightly upward within the existing range.
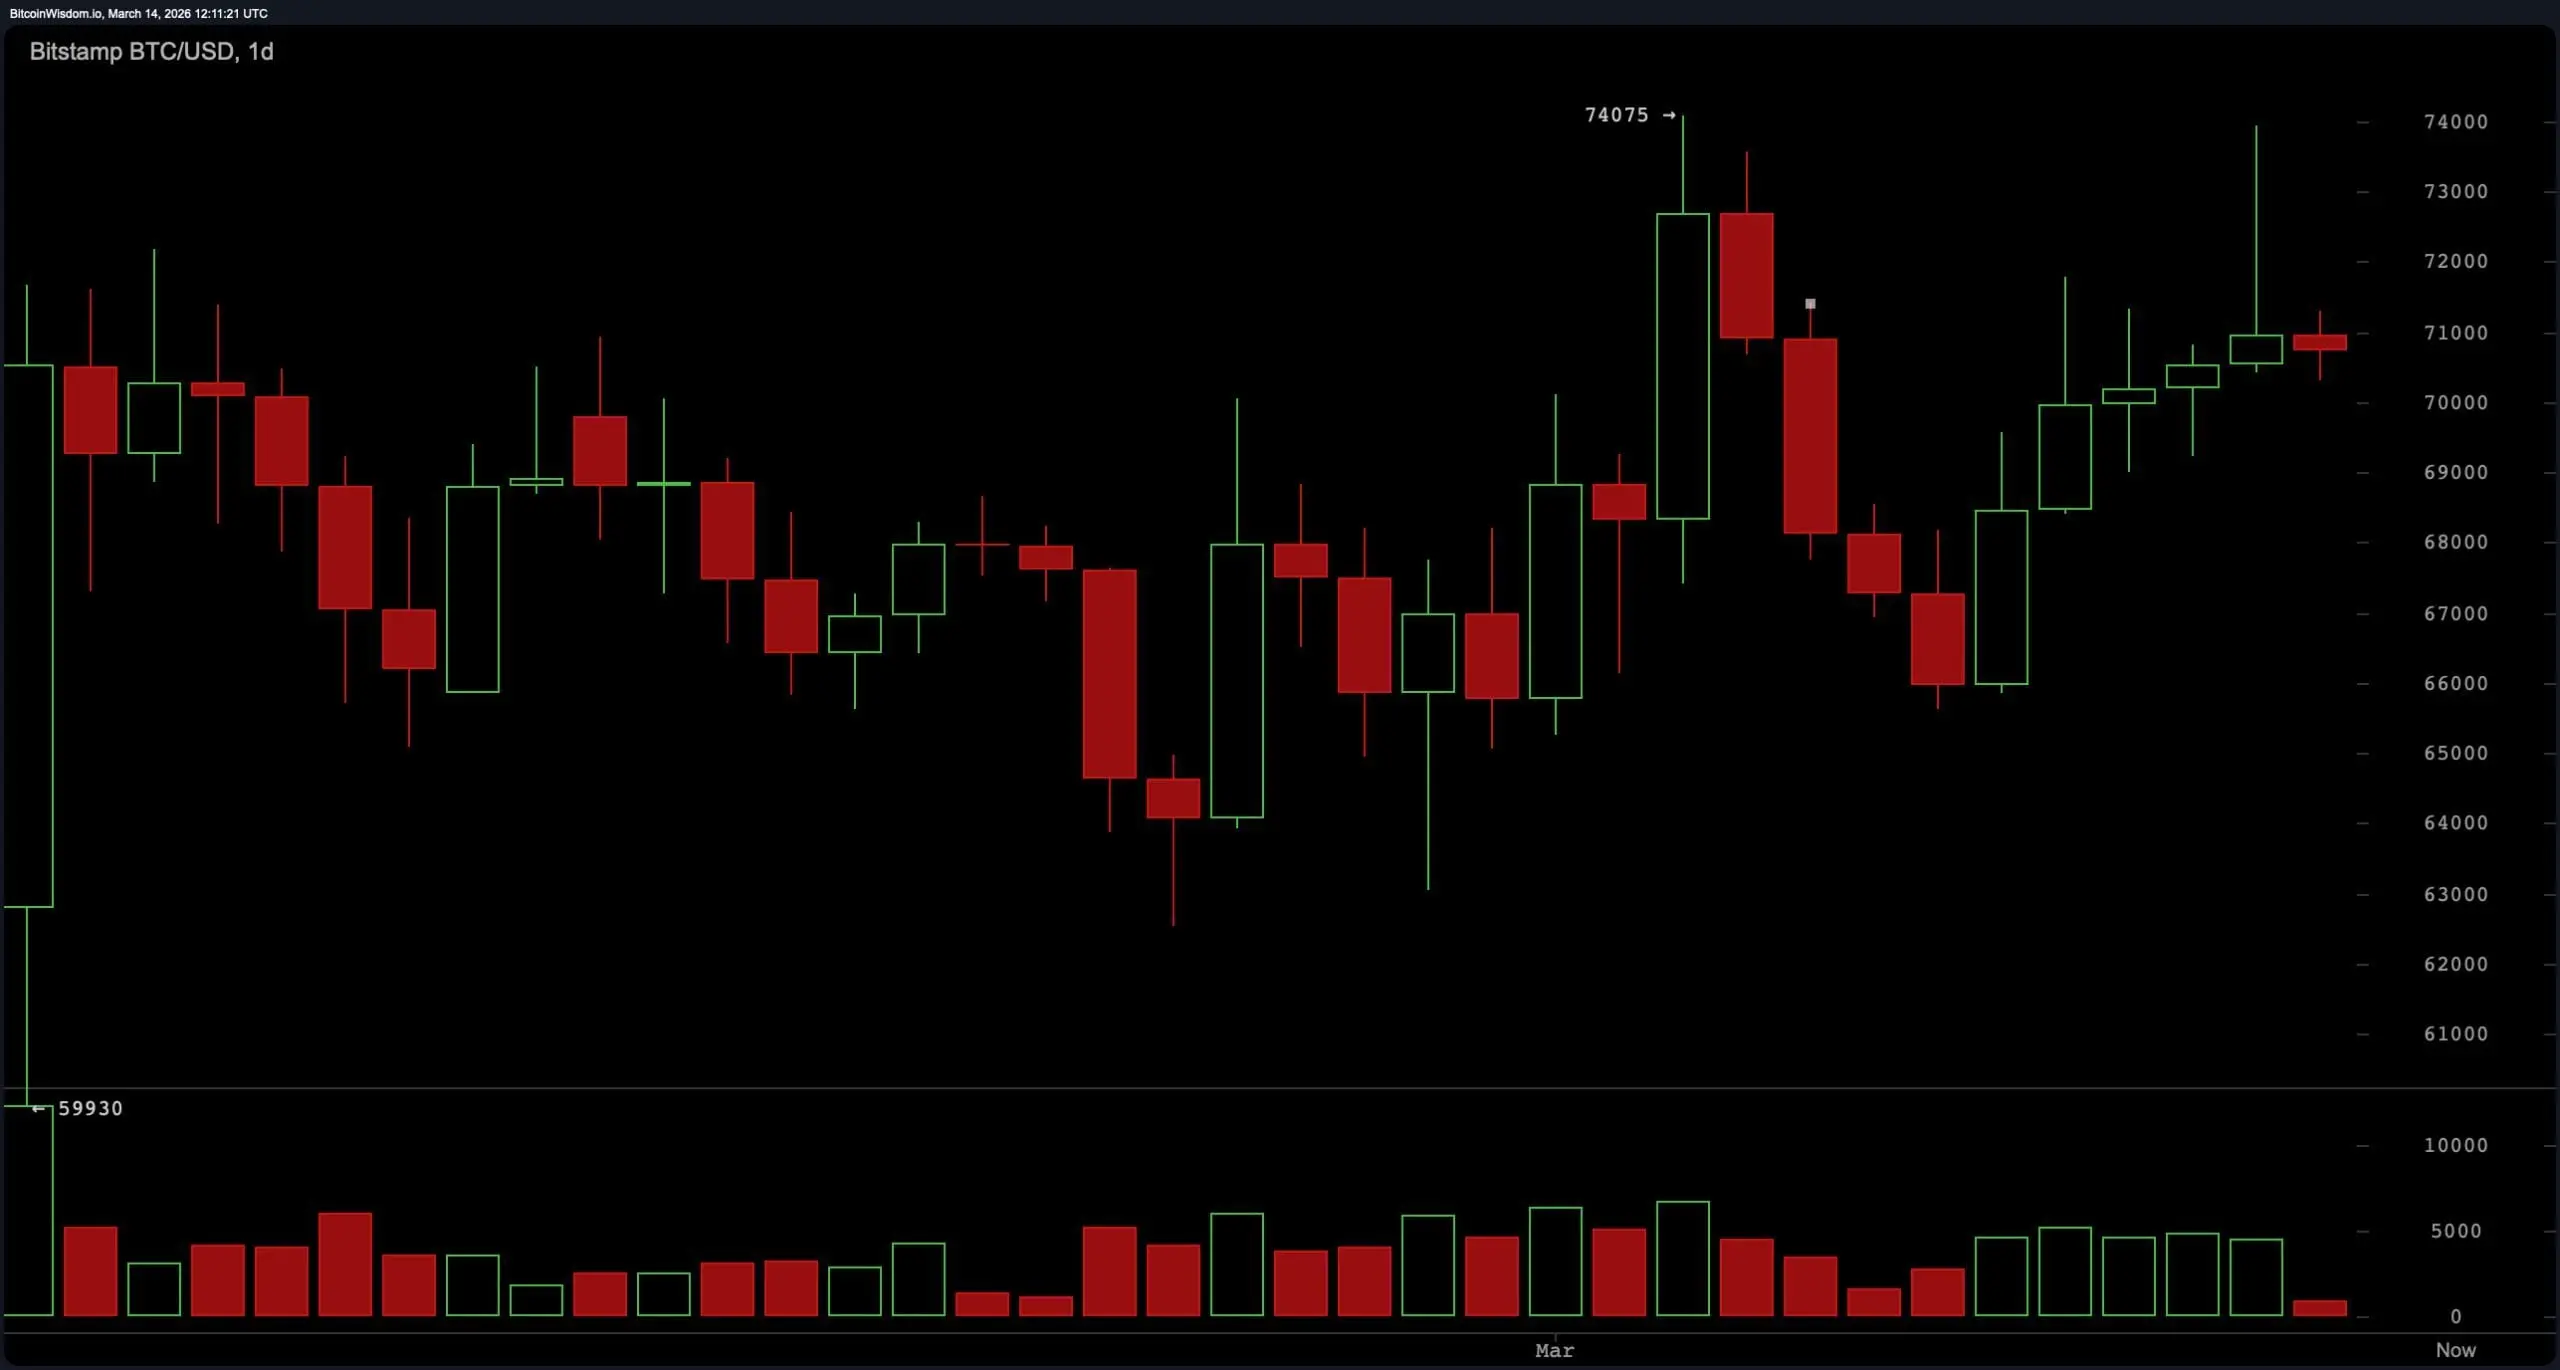 BTC/USD 1-day chart via Bitstamp on March 14, 2026.
The four-hour bitcoin chart shows continued sideways consolidation supported by a sequence of higher lows. Previous swing levels progressed from approximately $65,600 to $69,000 and then to near $70,000, suggesting gradual upward pressure beneath resistance. Price has repeatedly encountered resistance between $71,500 and $72,000, creating a compression pattern as volatility narrows. This type of price structure often precedes expansion once resistance or support is decisively breached. The current compression below resistance indicates that a move beyond this zone could determine the next directional move of roughly $3,000 to $5,000.
BTC/USD 1-day chart via Bitstamp on March 14, 2026.
The four-hour bitcoin chart shows continued sideways consolidation supported by a sequence of higher lows. Previous swing levels progressed from approximately $65,600 to $69,000 and then to near $70,000, suggesting gradual upward pressure beneath resistance. Price has repeatedly encountered resistance between $71,500 and $72,000, creating a compression pattern as volatility narrows. This type of price structure often precedes expansion once resistance or support is decisively breached. The current compression below resistance indicates that a move beyond this zone could determine the next directional move of roughly $3,000 to $5,000.
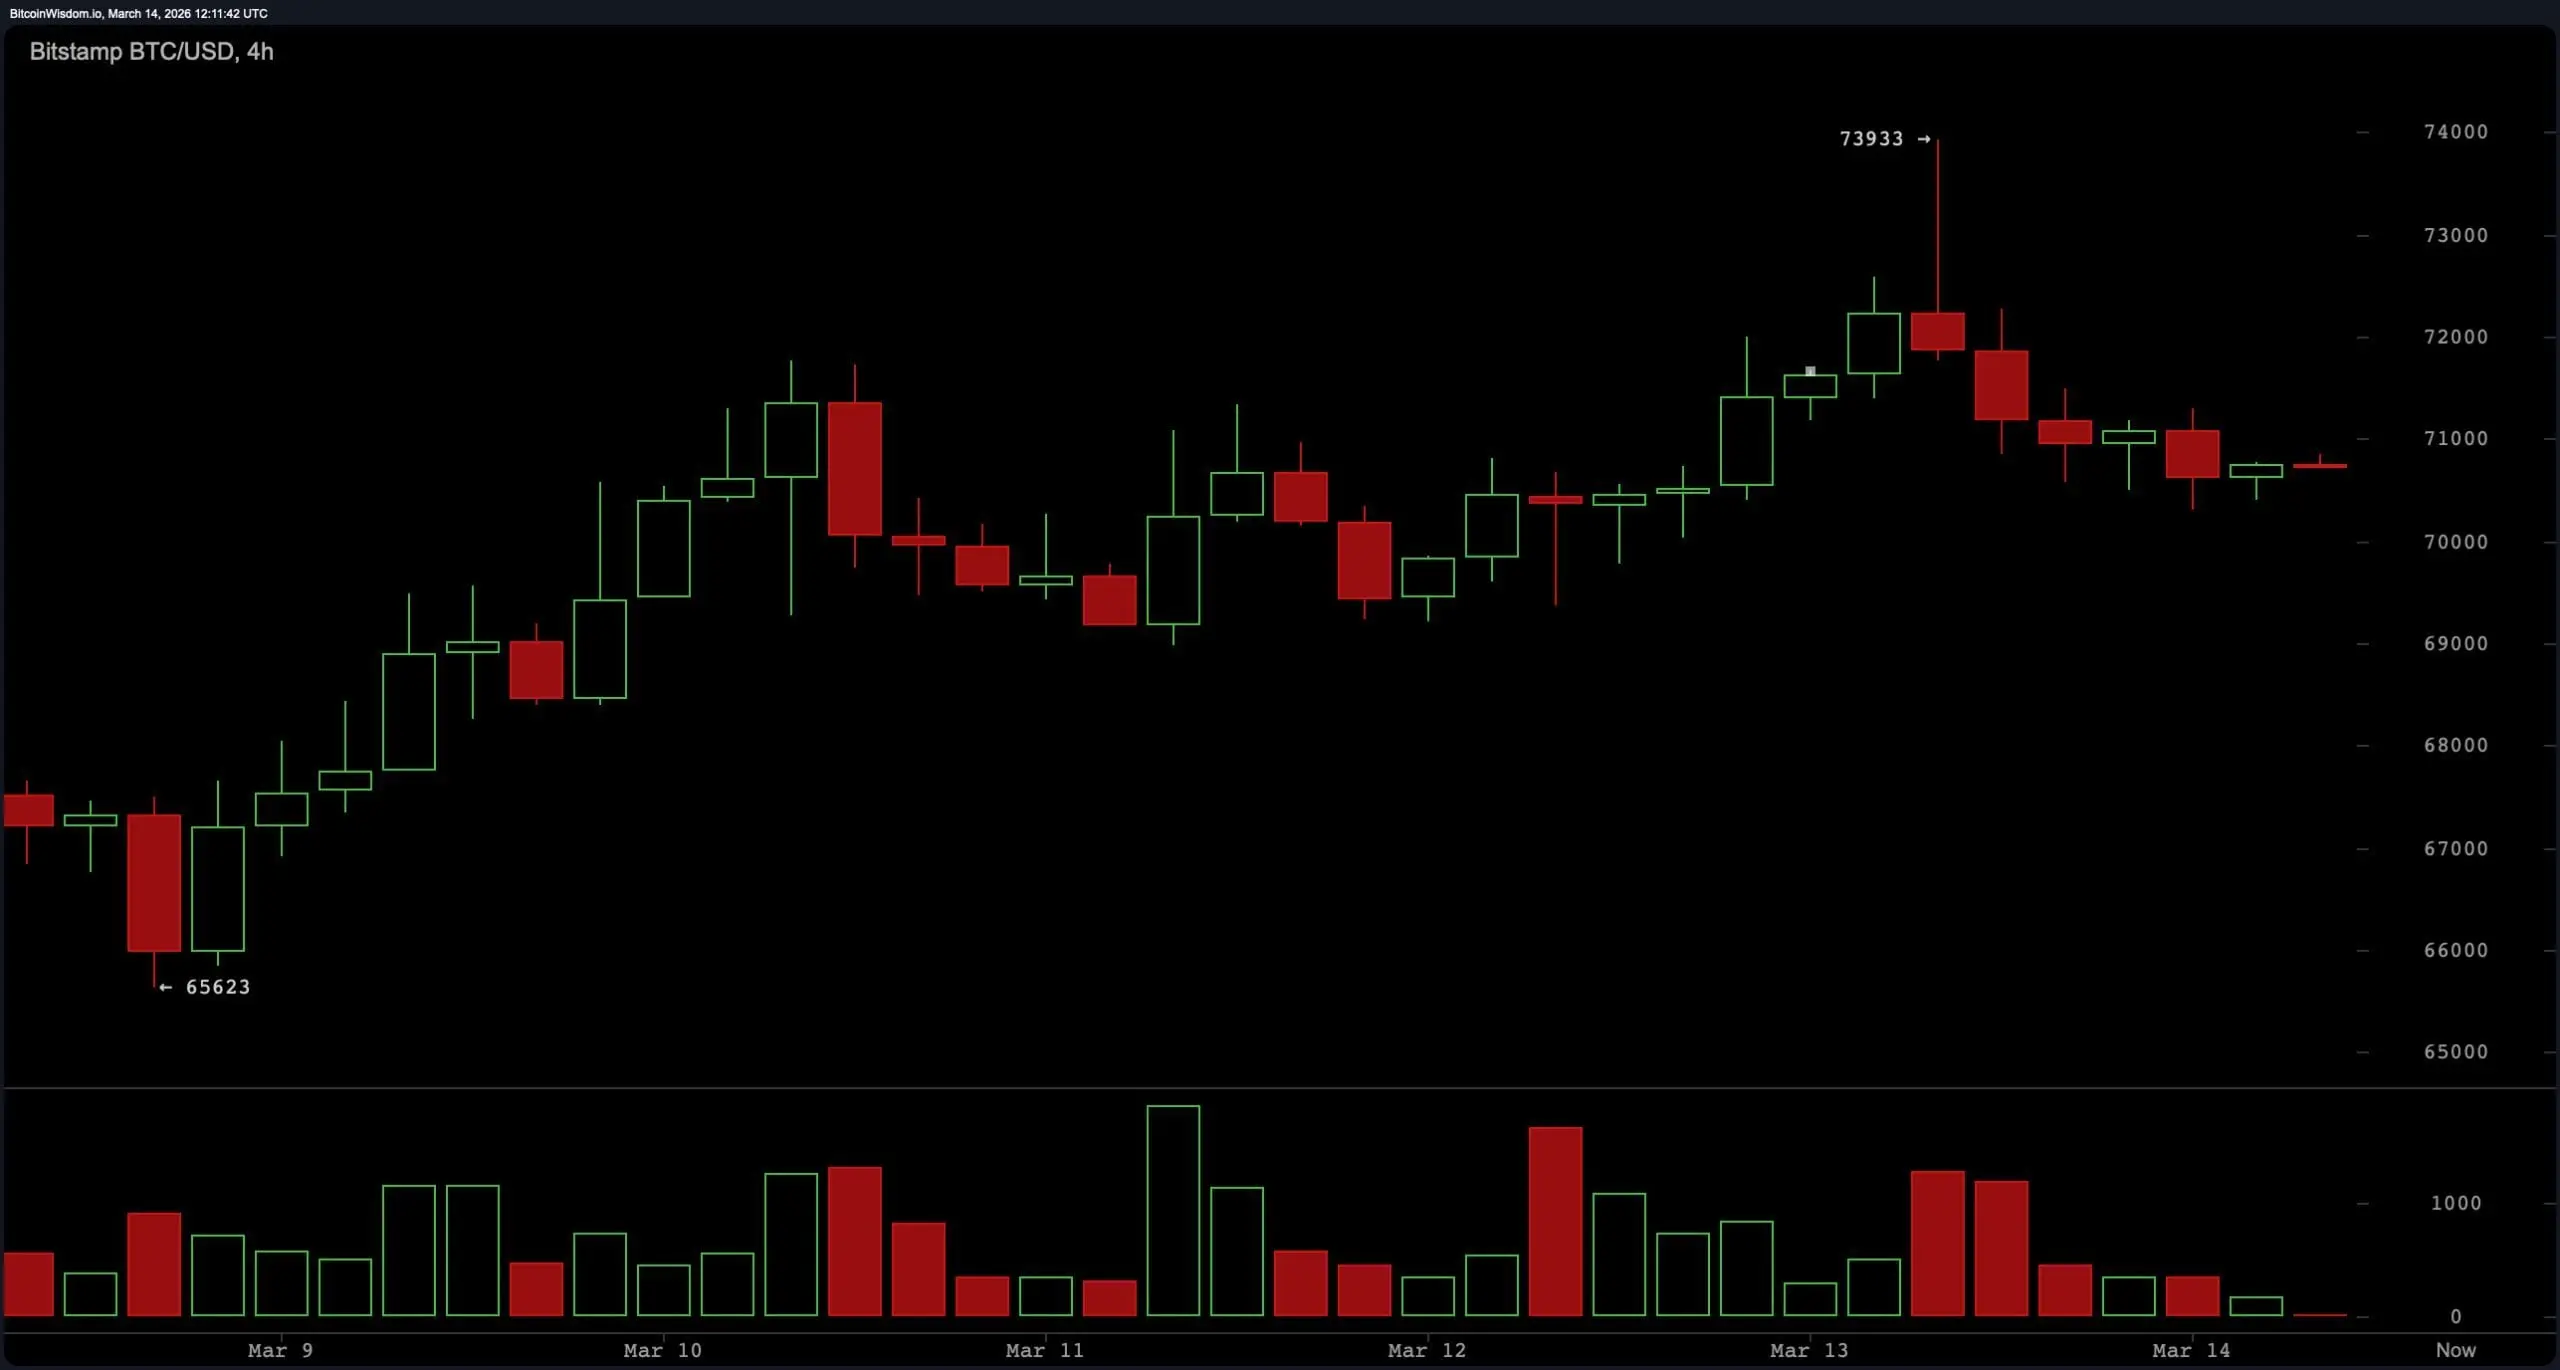 BTC/USD 4-hour chart via Bitstamp on March 14, 2026.
On the one-hour chart, bitcoin is trading within a tight intraday range between $70,300 support and approximately $71,100 resistance. Price movement has remained contained inside this narrow band while trading volume gradually declines, reflecting short-term equilibrium between buyers and sellers. Intraday consolidation within this range suggests the market is awaiting a catalyst for a breakout. Sustained movement above the $71,200 level would place the price near the upper resistance band around $72,800 and $74,000, while a breakdown below $69,500 would expose lower support areas near $67,800 and $66,000.
BTC/USD 4-hour chart via Bitstamp on March 14, 2026.
On the one-hour chart, bitcoin is trading within a tight intraday range between $70,300 support and approximately $71,100 resistance. Price movement has remained contained inside this narrow band while trading volume gradually declines, reflecting short-term equilibrium between buyers and sellers. Intraday consolidation within this range suggests the market is awaiting a catalyst for a breakout. Sustained movement above the $71,200 level would place the price near the upper resistance band around $72,800 and $74,000, while a breakdown below $69,500 would expose lower support areas near $67,800 and $66,000.
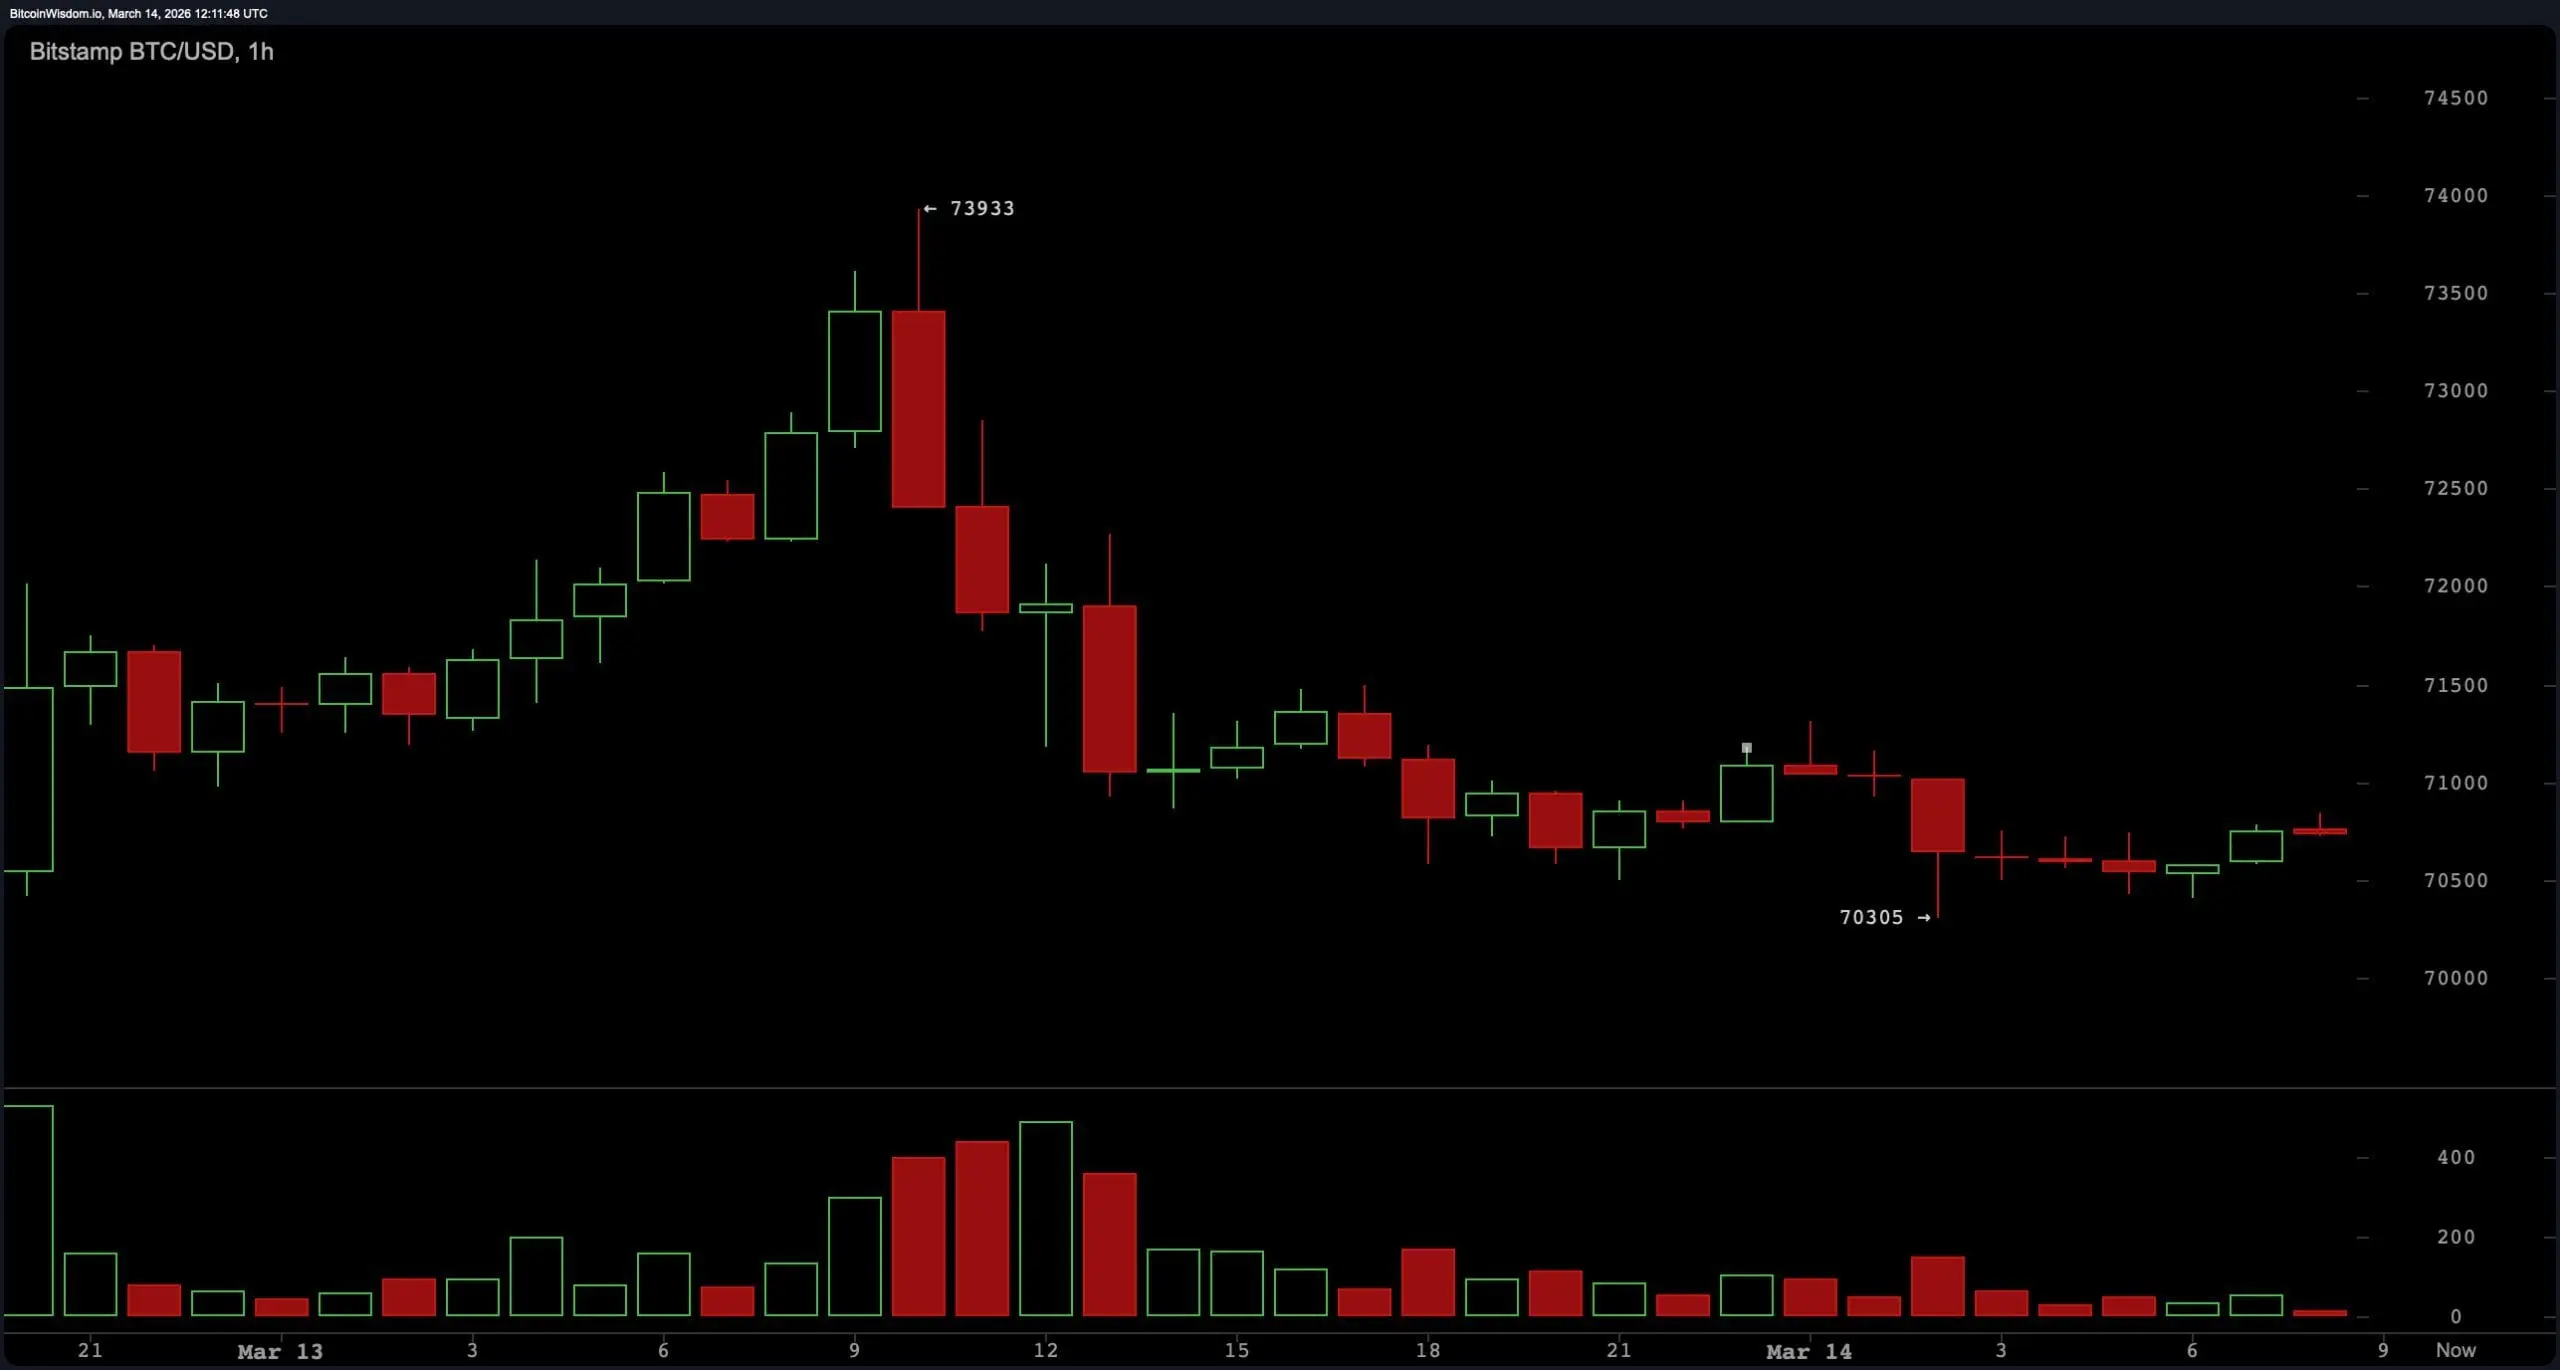 BTC/USD 1-hour chart via Bitstamp on March 14, 2026.
Oscillator readings reflect a neutral technical environment. The relative strength index ( RSI) is positioned at 53, indicating balanced momentum conditions. Stochastic reads 68, while the commodity channel index (CCI) is measured at 89, both also categorized as neutral signals.
BTC/USD 1-hour chart via Bitstamp on March 14, 2026.
Oscillator readings reflect a neutral technical environment. The relative strength index ( RSI) is positioned at 53, indicating balanced momentum conditions. Stochastic reads 68, while the commodity channel index (CCI) is measured at 89, both also categorized as neutral signals.
The average directional index (ADX) stands at 25, showing limited trend strength across the market. The Awesome oscillator records 2,432 and remains neutral. Momentum shows −1,891, signaling short-term downward pressure, while the moving average convergence divergence ( MACD) level registers −186 and signals upward momentum in the indicator summary.
Moving averages (MAs) present a split structure between short-term support and longer-term resistance levels. The exponential moving average (EMA) 10 sits at $69,648 and the simple moving average (SMA) 10 at $69,310, both signaling upward momentum relative to the current price. The EMA 20 at $69,305 and SMA 20 at $68,287 also remain supportive of the current range, along with the EMA 30 at $70,053 and SMA 30 at $68,215.
Longer-term averages reflect downward pressure, with the EMA 50 at $72,764 and the SMA 50 at $71,703 positioned above the price. Higher-period averages remain significantly elevated, including the EMA 100 at $79,665, SMA 100 at $80,935, EMA 200 at $87,978, and SMA 200 at $94,125. This distribution results in an overall neutral technical summary as short-term averages support current levels while longer-term averages remain above the market.
Bull Verdict:
If bitcoin maintains support above $69,500 and breaks decisively above the $71,200 resistance level, the current compression pattern could resolve to the upside. A sustained move through this level would clear short-term resistance and open the path toward $72,800 and a potential retest of the $73,800–$74,000 resistance zone seen on the daily chart. The sequence of higher lows on the four-hour timeframe and supportive short-term moving averages suggests underlying strength remains intact as long as price holds above the mid-range support area.
Bear Verdict:
A breakdown below the $69,500 support level would weaken the current consolidation structure and shift short-term momentum downward. Losing this level would place bitcoin below key range support and expose lower targets around $67,800, with a deeper support zone near $66,000 visible on the daily timeframe. Longer-term moving averages remaining above current price levels continue to signal overhead resistance, meaning sustained weakness below support could accelerate downside pressure if bearish momentum increases.
FAQ 🧭
- What is the bitcoin price on March 14, 2026?
Bitcoin is trading around $70,795, consolidating near the $70,000 level after rejecting resistance near $74,000.
- What are the key bitcoin resistance levels right now?
The main resistance levels for bitcoin are $71,200 in the short term and the major resistance zone between $73,800 and $74,000.
- What are the key bitcoin support levels to watch?
Key bitcoin support sits near $70,300 intraday, with stronger structural support at $69,500 and major support near $66,000.
- Is bitcoin trending up or down right now?
Bitcoin’s current technical trend is neutral as indicators and moving averages show consolidation between roughly $69,500 and $72,000.
Artikel Terkait
Utang negara Amerika Serikat melampaui 3,9 triliun dolar, akankah investor mempertaruhkan pada aset haven seperti Bitcoin?
Pada 18 Maret, total utang negara Amerika Serikat melampaui 39 triliun dolar, memicu perhatian pasar. Defisit jangka panjang dan beban bunga yang meningkat mendorong kenaikan utang, dengan meningkatnya minat investor terhadap aset terdesentralisasi seperti Bitcoin. Pembuat kebijakan menghadapi trade-off antara pembayaran utang dan pendanaan proyek baru, kenaikan utang dapat mempengaruhi investasi dasar dan pertumbuhan ekonomi jangka panjang, pasar perlu memperhatikan dampak perkembangan utang terhadap strategi investasi.
GateNews21menit yang lalu
Sebuah CEX telah mencapai volume perdagangan $1,443 juta dalam 24 jam terakhir, dengan XRP, BTC, dan ETH menempati posisi tiga teratas.
Menurut Gate News, volume perdagangan di salah satu CEX pada 18 Maret mencapai 1.443 miliar dolar, turun 42.67%. Lima token teratas adalah XRP, BTC, ETH, POLYX, dan BTT, dengan proporsi volume perdagangan masing-masing sebesar 12.90%, 7.95%, 6.91%, 6.10%, dan 4.90%.
GateNews36menit yang lalu
Keputusan suku bunga Federal Reserve Maret 2026 akan segera diumumkan, pernyataan Powell akan mempengaruhi tren Bitcoin dan pasar
The Federal Reserve will maintain interest rates at 3.5%-3.75% on March 18, with markets focusing on Powell's statements regarding inflation and future policy. Rising core PCE and oil price pressure limit rate cut space, with only a 30% probability of rate cuts expected this year. Political factors affecting Powell's tenure have clear market reactions, with risk assets and cryptocurrency prices set to be impacted.
GateNews37menit yang lalu
Paus Beli Bitcoin Senilai 2 Miliar Dolar, Pasar Fokus pada Pidato Powell untuk Mendorong Harga BTC Melampaui 75.000 Dolar
Harga Bitcoin kembali turun ke $74.000, pasar memantau pidato Ketua Federal Reserve Powell. Pembelian besar oleh paus dan aliran dana ETF menunjukkan permintaan jangka panjang, tetapi dalam jangka pendek harus waspada terhadap tekanan jual. Sentimen pasar membaik, volatilitas mungkin meningkat.
GateNews40menit yang lalu
Aliran Dana Institusional Kembali, Bitcoin ETF Menciptakan Rekor Aliran Bersih Positif Terpanjang dalam Lima Bulan
Pada 18 Maret, ETF Bitcoin Amerika mengalami aliran dana yang berkelanjutan, menciptakan rekor terpanjang dalam lima bulan, dengan aliran masuk bersih mencapai 199,4 juta dolar, menunjukkan kepercayaan investor institusional terhadap Bitcoin kembali. ETF Ethereum spot juga terus mengalami aliran masuk bersih. Regulator Amerika merilis dokumen panduan untuk meningkatkan transparansi pasar, mendorong pengembangan ETF cryptocurrency, dan meningkatkan aktivitas pasar secara keseluruhan.
GateNews43menit yang lalu
Analis rantai: Fenomena kepanasan pasar Bitcoin telah menghilang, tetapi tekanan penjual masih belum berkurang
Pada 18 Maret, analis data on-chain Axel merilis laporan yang menunjukkan bahwa pasar Bitcoin telah terbebas dari fenomena overheating, namun tekanan dari penjual masih ada, dan belum terlihat adanya sinyal pembalikan. Indikator MVRV Z-Score telah turun ke 0,674, menandakan bahwa gelembung telah menghilang; sementara indikator aSOPR yang terus berada di bawah 1,0 menunjukkan bahwa pasar masih dalam kondisi penjualan dengan kerugian, dan rebound berpotensi menghadapi risiko tekanan jual.
GateNews43menit yang lalu
