$H /USDT сигнал на коротку позицію на таймфреймі 4 години, 95% ймовірність перемоги — ти наважишся?
$H /USDT - SHORT — відкрити шорт
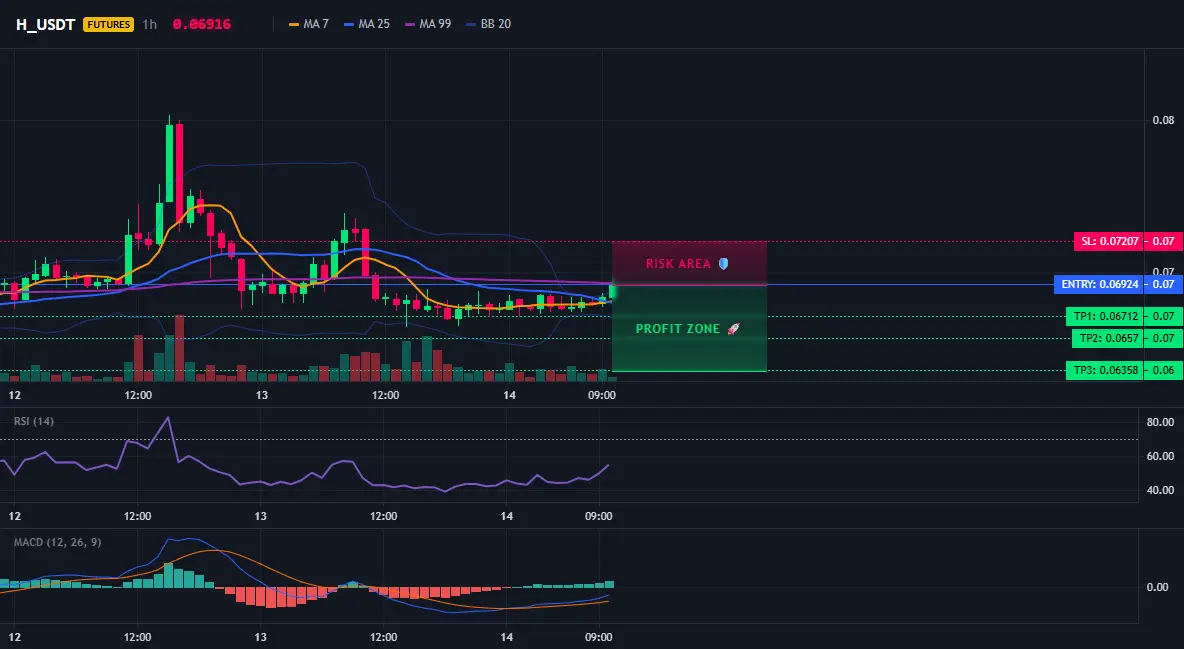
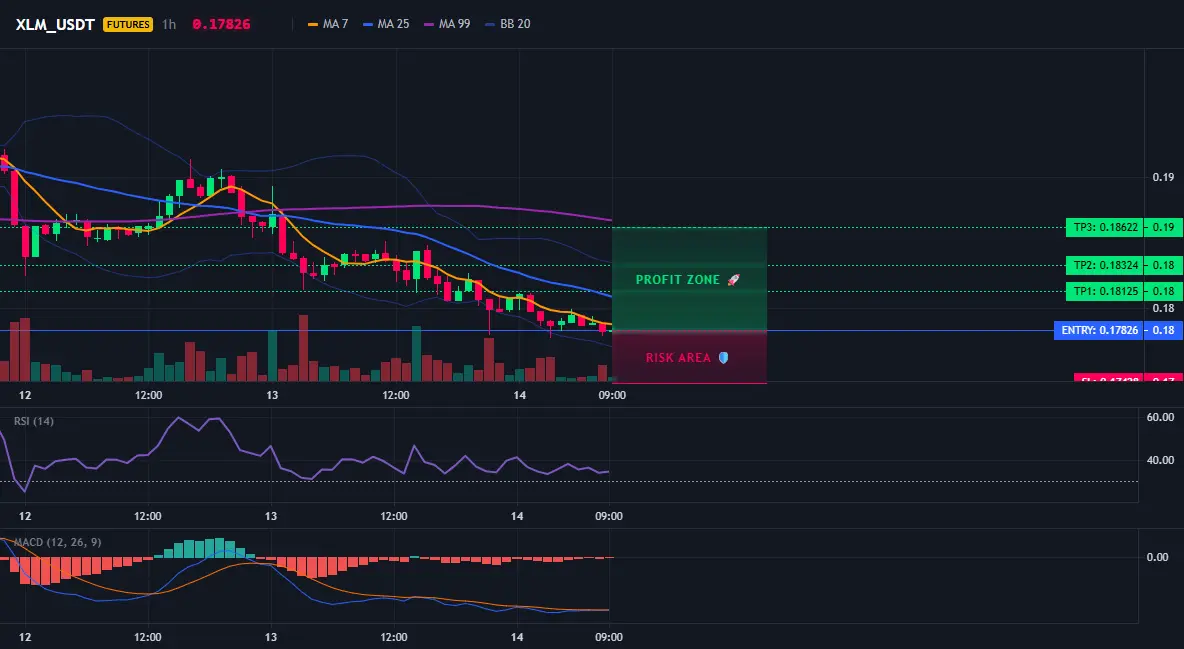
План торгівлі:
Вхід: 0.06895 – 0.06953
SL: 0.07207
TP1: 0.06712
TP2: 0.06570
TP3: 0.06358
Чому варто звернути увагу на цю структуру?
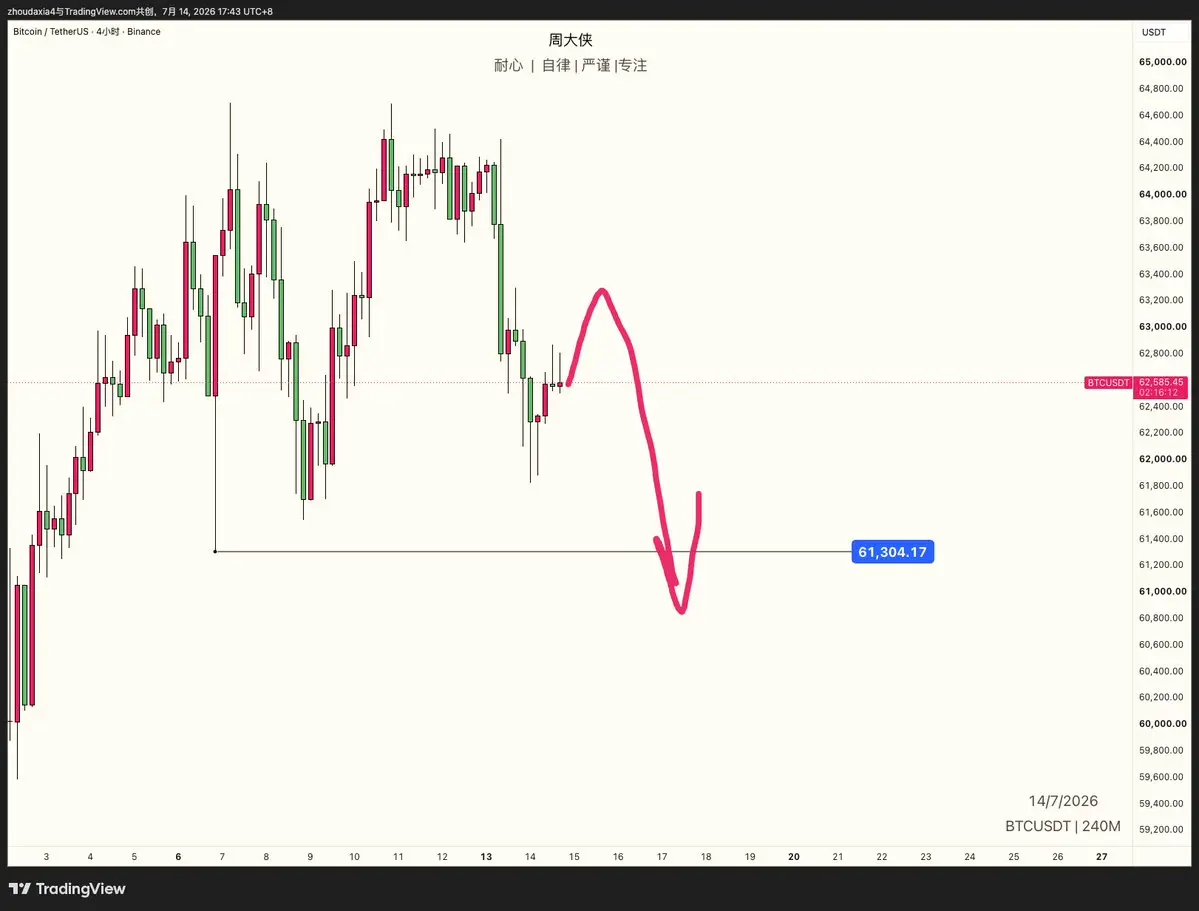
- Тренд: 1D ведмежий ринок, на 4H напрям на шорт чіткий, EMA чітко тисне.
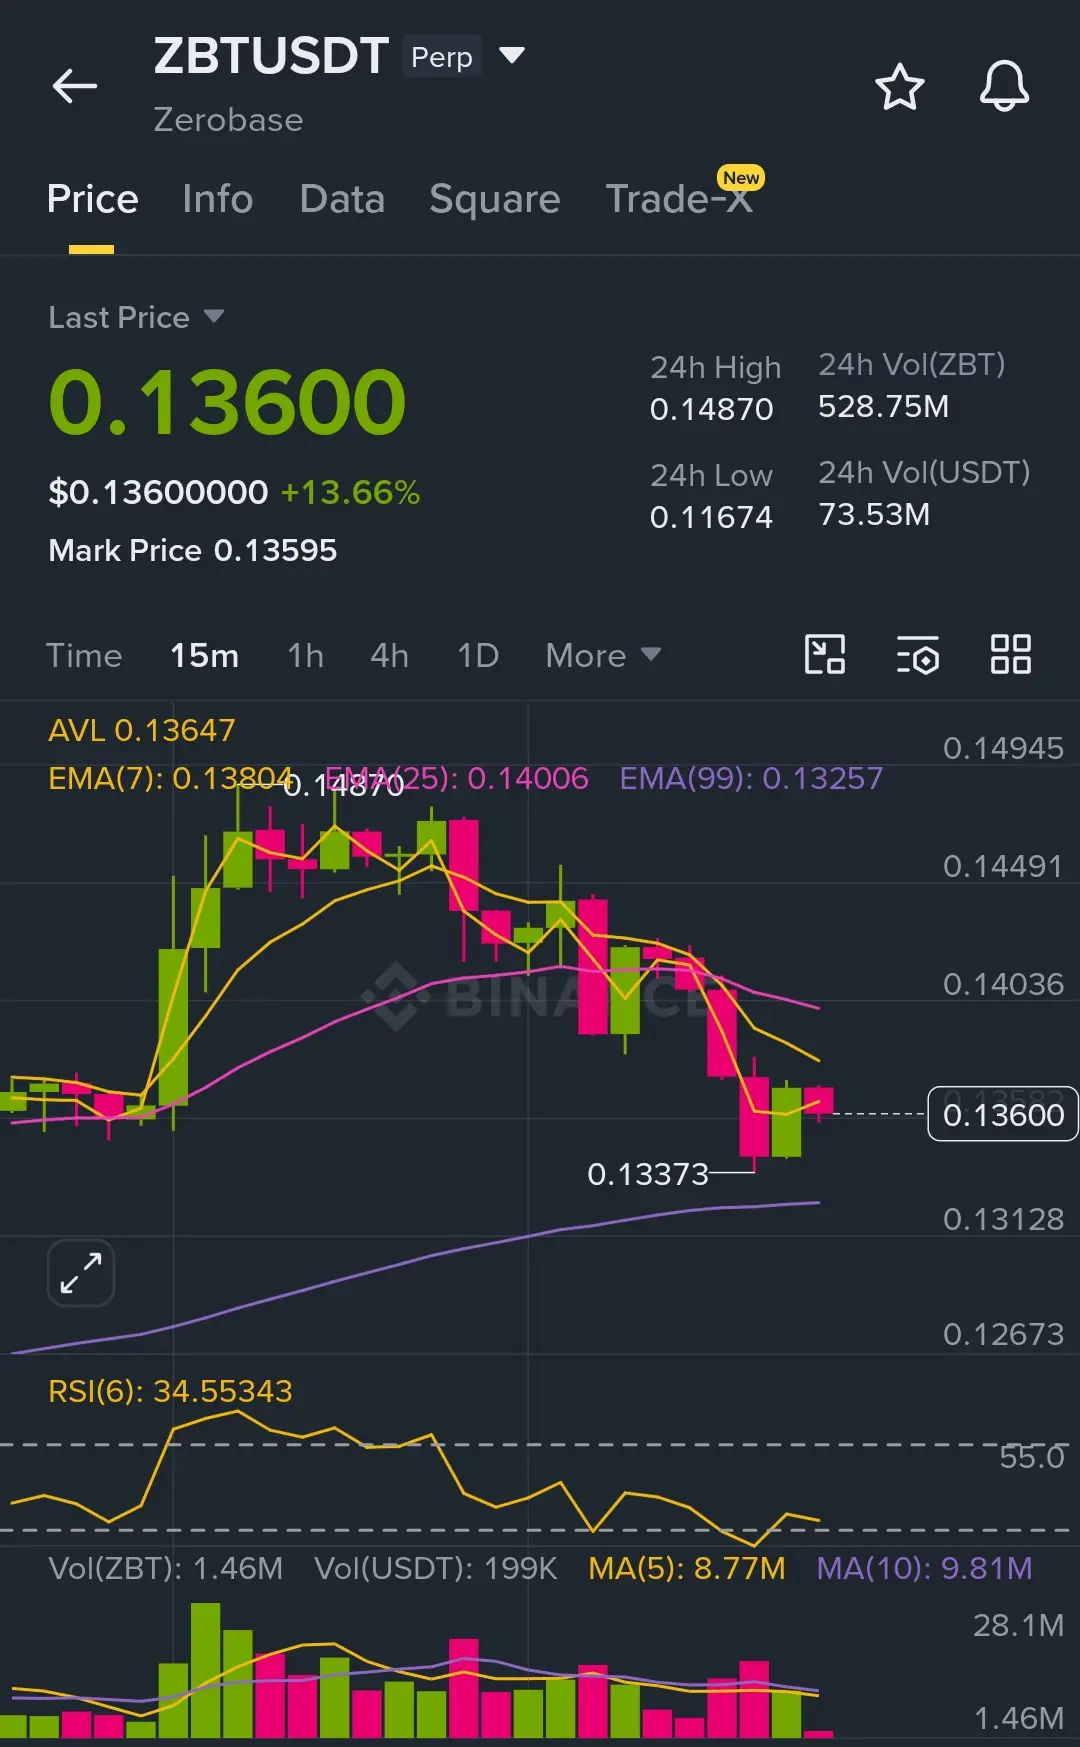
- RSI на 15 хвилинах 68.06, близько до перекупленості, тиск від короткострокової корекції великий.
- Вхід 0.06924, TP1 0.06712, TP2 0.06570, SL 0.07207, співвідношення прибуток/ризик 2.5:1.
- Чому саме зараз? Після пробою на денному графіку, на 4H відско