Date: Thu, Dec 18, 2025 | 06:20 AM GMT
The broader cryptocurrency market has seen choppy and uncertain price action over the past several weeks, following a sharp sell-off that began on October 10. That correction pushed** Ethereum (ETH) **down nearly 22% over the past 60 days, keeping pressure firmly on major altcoins.
Among them, Sei (SEI) has been particularly weak, sliding more than 21% in just the past week and extending its 60-day decline to over 42%. Notably, the latest technical structure indicates that SEI may be setting up for a deeper downside move in the near term.
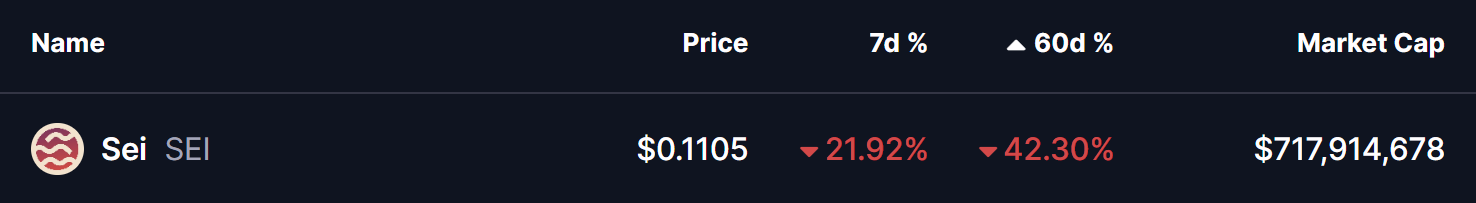
Source: Coinmarketcap
Fractal Setup Hints at Further Downside
On the weekly timeframe, SEI continues to trade within a large falling wedge that has defined its trend since early 2024. Historically, this structure has acted as a distribution zone, with price repeatedly rallying toward the upper resistance trendline before facing strong rejection.
What makes the current setup particularly concerning is the repeating fractal pattern visible on the chart. In April 2024 and again in February 2025, SEI was rejected from the wedge’s upper boundary, lost key horizontal support zones, and went on to record steep corrections of roughly 82%. In both cases, price eventually gravitated back toward the lower boundary of the wedge before attempting a short-lived recovery.
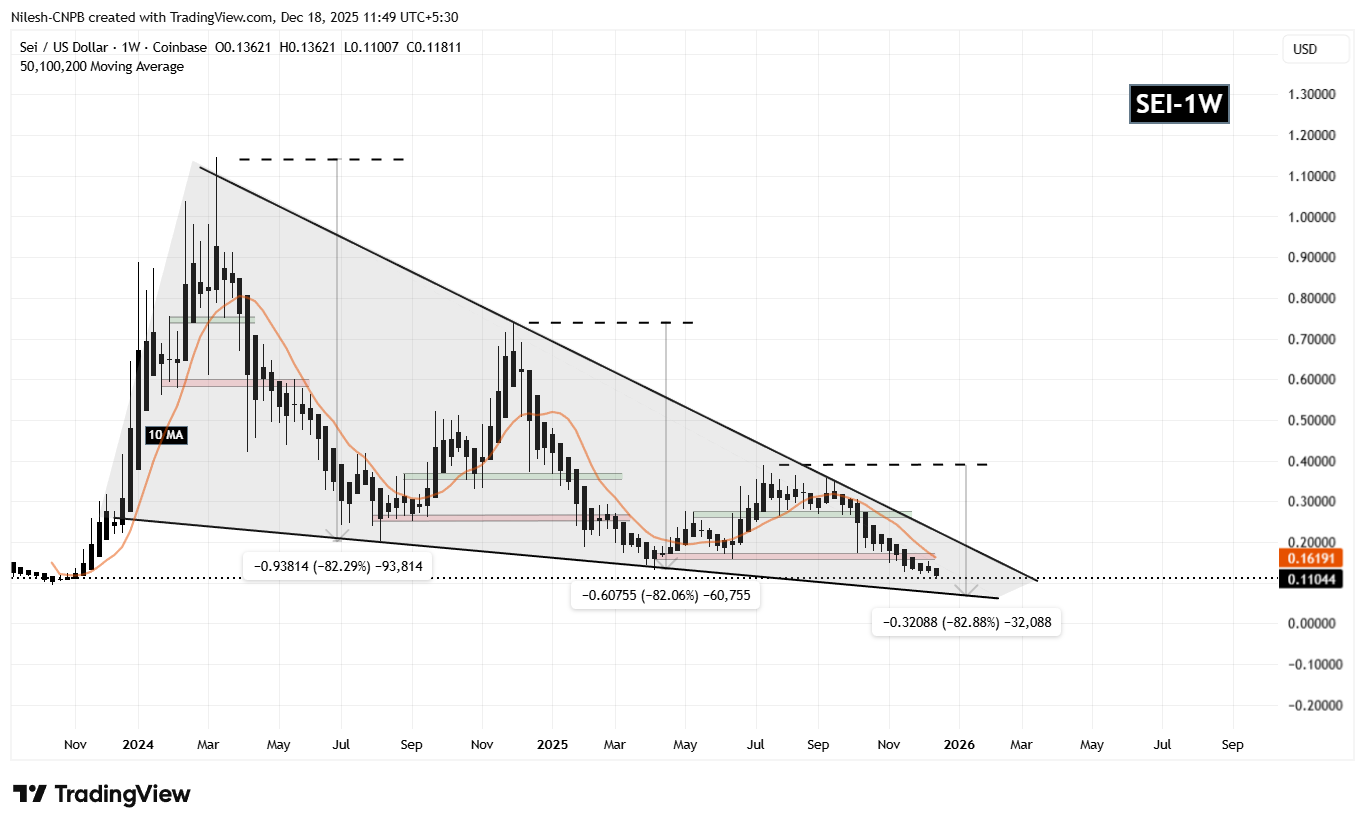
Sei (SEI) Weekly Chart/Coinsprobe (Source: Tradingview)
The chart now shows SEI following the same path once again.
After its previous rejection near the $0.3576 region, SEI slipped below multiple support areas marked on the chart. Price is now hovering around the $0.11 zone — a level that closely aligns with where previous deep corrections paused before another leg lower or consolidation.
With the fractal lining up almost point-for-point, the technical picture suggests that bearish momentum may still be in control.
What’s Next for SEI?
As long as SEI remains below the former support and fails to regain the red-zone level near $0.1582, the downside fractal remains valid. If history repeats, the pattern implies the possibility of another extended decline toward the lower boundary of the falling wedge, which currently sits around the $0.07 area. From current levels, that would translate into an additional downside move of roughly 35–40%.
That said, there is a clear invalidation point to watch. A strong rebound that allows SEI to reclaim the 10-week moving average near $0.1619 could disrupt the fractal structure and hint that selling pressure is finally easing. Such a move would be an early signal that the market is attempting to form a more durable base.
For now, however, the weekly chart suggests that SEI remains technically vulnerable. Until key resistance levels are reclaimed, the path of least resistance appears tilted to the downside, with traders closely watching whether this familiar fractal plays out once again.
Disclaimer: The views and analysis presented in this article are for informational purposes only and reflect the author’s perspective, not financial advice. Technical patterns and indicators discussed are subject to market volatility and may or may not yield the anticipated results. Investors are advised to exercise caution, conduct independent research, and make decisions aligned with their individual risk tolerance.
Disclaimer: The information on this page may come from third parties and does not represent the views or opinions of Gate. The content displayed on this page is for reference only and does not constitute any financial, investment, or legal advice. Gate does not guarantee the accuracy or completeness of the information and shall not be liable for any losses arising from the use of this information. Virtual asset investments carry high risks and are subject to significant price volatility. You may lose all of your invested principal. Please fully understand the relevant risks and make prudent decisions based on your own financial situation and risk tolerance. For details, please refer to
Disclaimer.
Related Articles
Rich Dad Warns: Biggest Crash in History Coming in 2026! Names BlackRock as Ponzi Scheme, Urges "Skip a Meal a Day" to Buy Bitcoin and Silver
Robert Kiyosaki warned on X platform that 2026 will see the biggest stock market crash in history, and accused BlackRock of being a "Ponzi scheme." He advised investors to purchase Bitcoin, Ethereum, and tangible assets like gold, even suggesting skipping meals to buy silver if lacking funds. He emphasized the importance of taking action and criticized current societal trends.
動區BlockTempo41m ago
DeFi's Yield Winter: Liquidity Stagnation, Leverage Contraction, Arbitrage Opportunities Closed
The DeFi market has entered an "interest rate winter," with mainstream stablecoin lending rates declining sharply due to supply-demand imbalance and liquidity surplus. Weakened arbitrage activities and decreased market risk appetite have led to a sharp drop in stablecoin borrowing demand. Meanwhile, the Sky protocol provides stable yields through real-world assets, becoming the "de facto floor" for on-chain yield rates. Overall, the current environment is prompting investors to reassess their risk strategies, and falling interest rates may become the foundation for DeFi's future recovery.
PANews1h ago
Zcash Price Rallies 10% on Major VC Funding, but Bulls Must Break $250
March 12, 2026 2:48 am EDT
TheCoinRepublic1h ago
Litecoin Crypto Expands DeFi Access Through Base: Is LTC Price On The Verge Of A Rally?
March 12, 2026 6:50 am EDT
TheCoinRepublic1h ago
Bitcoin Maintains Resilience Near $70,000, Analysts Say Deleveraging Paves Way for Next Rally
On March 12, analyst Omkar Godbole noted that Bloomberg predicted Bitcoin could fall to $10,000, but the industry considered this forecast unreasonable. The Deribit platform showed that approximately $800 million in put options are concentrated at $20,000, with some traders preparing for a possible crash. Despite external market volatility, Bitcoin remained around $70,000, demonstrating resilience. Analysis indicated that market consolidation could lay the foundation for subsequent price movements.
GateNews1h ago
Greeks.live: 26,000 BTC options expire on March 13, and the market enters a wait-and-see stance
Greeks.live predicts that a large volume of BTC and ETH options will expire on March 13th, with declining market rebound momentum and extremely low trading activity. Options data indicates the market is in a wait-and-see state, still in a bear market, with the recent AI hype failing to improve the situation.
GateNews1h ago