Trade
Basic
Futures
Futures
Hundreds of contracts settled in USDT or BTC
TradFi
Gold
Trade global traditional assets with USDT in one place
Options
Hot
Trade European-style vanilla options
Unified Account
Maximize your capital efficiency
Demo Trading
Futures Kickoff
Get prepared for your futures trading
Futures Events
Participate in events to win generous rewards
Demo Trading
Use virtual funds to experience risk-free trading
Earn
Launch
CandyDrop
Collect candies to earn airdrops
Launchpool
Quick staking, earn potential new tokens
HODLer Airdrop
Hold GT and get massive airdrops for free
Launchpad
Be early to the next big token project
Alpha Points
Trade on-chain assets and enjoy airdrop rewards!
Futures Points
Earn futures points and claim airdrop rewards
Investment
Simple Earn
Earn interests with idle tokens
Auto-Invest
Auto-invest on a regular basis
Dual Investment
Buy low and sell high to take profits from price fluctuations
Soft Staking
Earn rewards with flexible staking
Crypto Loan
0 Fees
Pledge one crypto to borrow another
Lending Center
One-stop lending hub
VIP Wealth Hub
Customized wealth management empowers your assets growth
Private Wealth Management
Customized asset management to grow your digital assets
Quant Fund
Top asset management team helps you profit without hassle
Staking
Stake cryptos to earn in PoS products
Smart Leverage
New
No forced liquidation before maturity, worry-free leveraged gains
GUSD Minting
Use USDT/USDC to mint GUSD for treasury-level yields
More
# ?CP
148.45K
Crypto_Exper
Digital and Cryptocurrency Market Overview as of the morning of February 27, 2026, compiled from the latest developments over the past 24 hours:
📊 Market Overview: Bitcoin's Recovery Efforts in a Sensitive Zone
The digital financial market entered the final trading day of the week with caution as capital flows showed a clear divergence between asset classes.
1. Bitcoin (BTC): Stuck around the $67K mark
24-hour fluctuations: BTC experienced a volatile trading session with a range of $66.5K to $68.8K. After the previous deep correction, the price showed a technical recovery, but selling pressur
- Reward
- 2
- Comment
- Repost
- Share
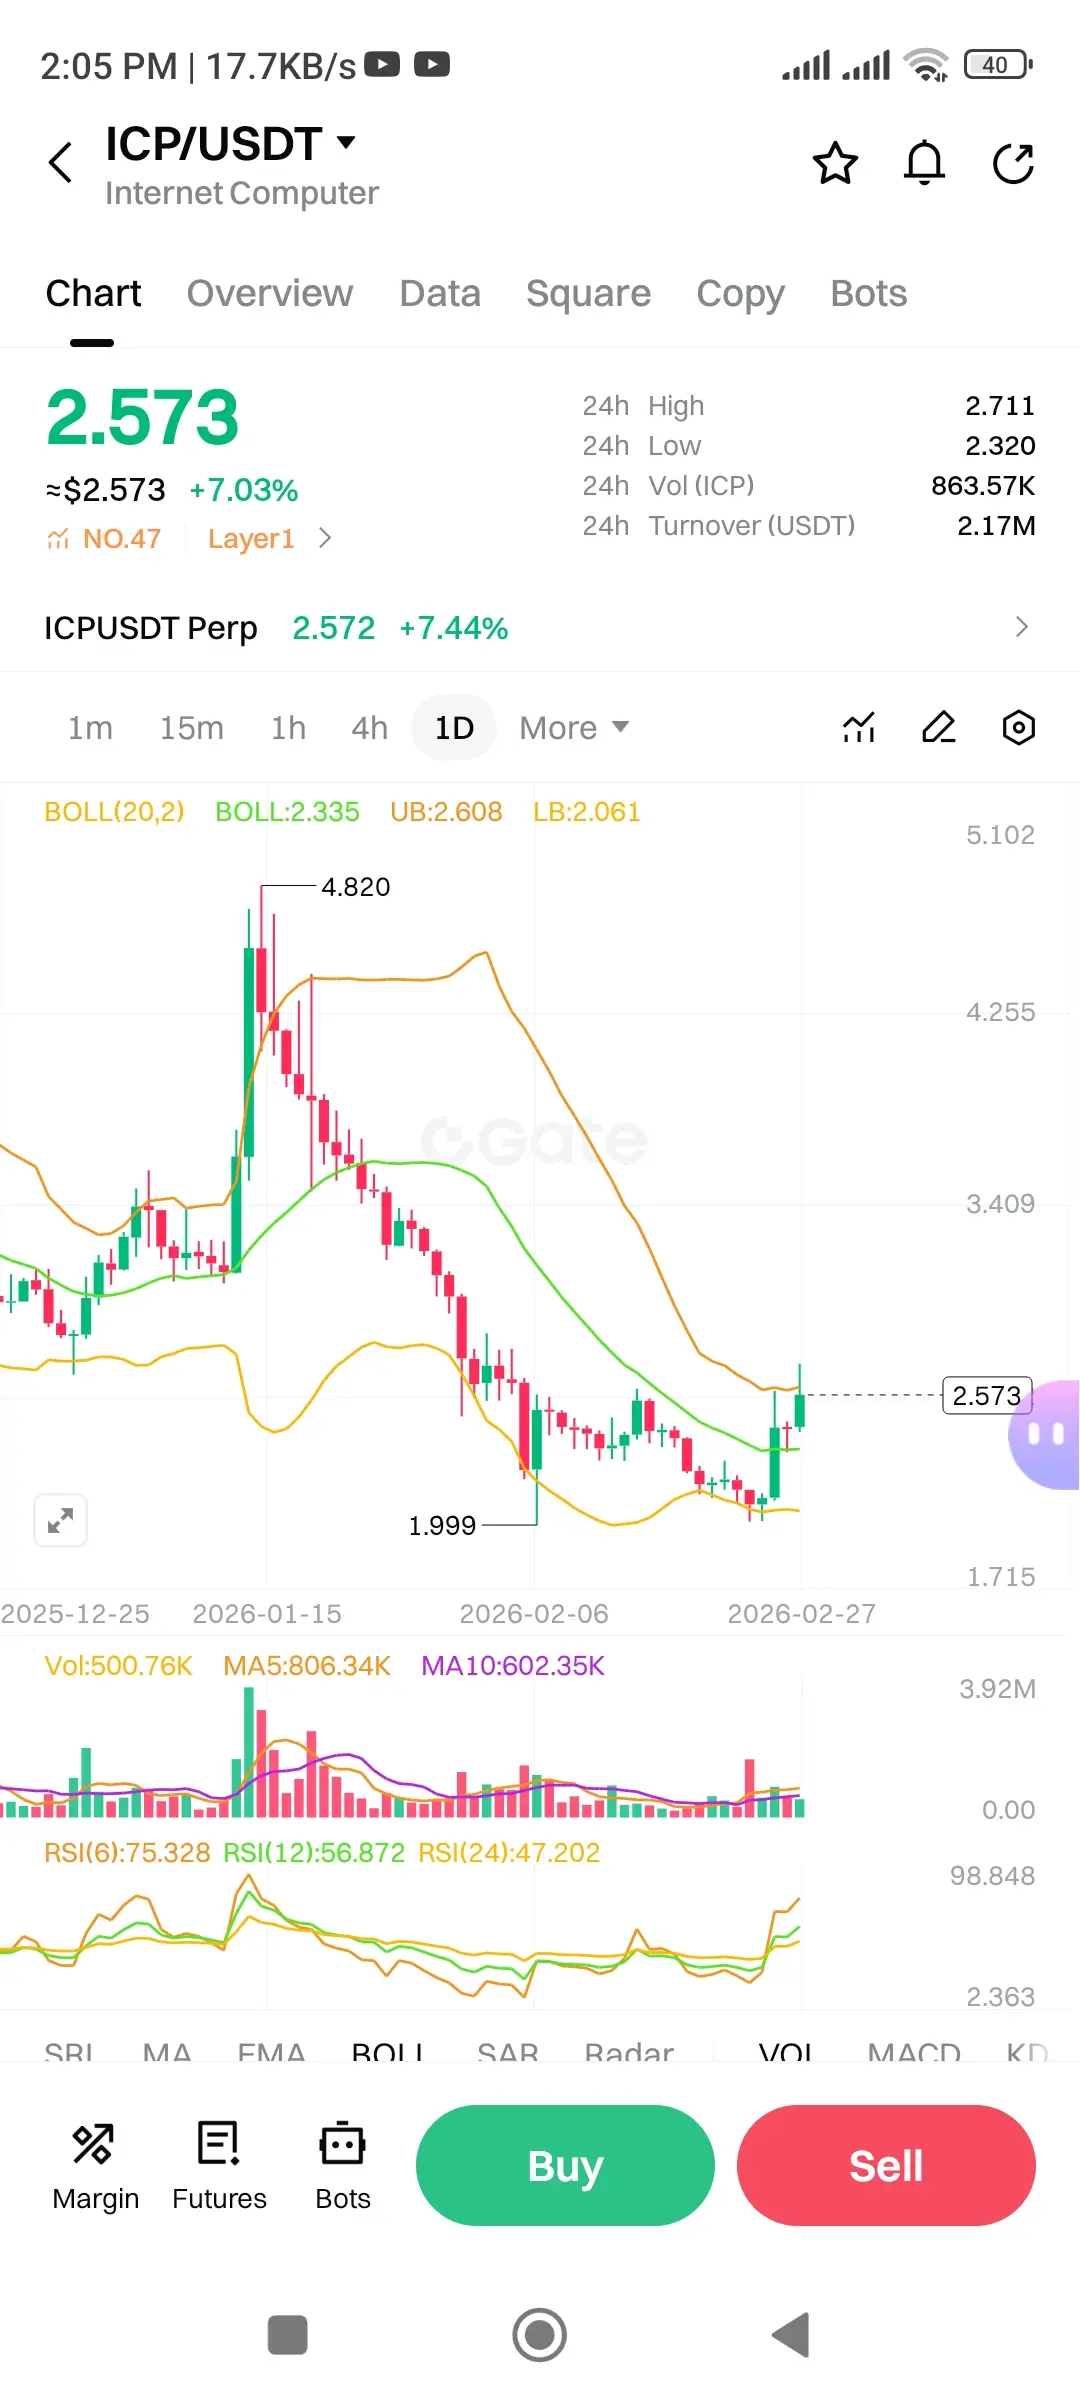
$ICP /USDT Technical Analysis | 1D Chart
Price: $2.573 | +7.03% 📈
After a brutal sell-off from $4.820, ICP finally found its footing near the $1.999 support zone where patient hands were clearly waiting.
📊 Indicators Breakdown:
🔵 BOLL(20,2): Price is now breaking above the Middle Band (2.335) and challenging the Upper Band at 2.608 a textbook bullish band expansion signal.
🟡 RSI(6): 75.328 | RSI(12): 56.872 | RSI(24): 47.202 Short-term momentum is blazing while mid & long-term RSI still has plenty of room to run no divergence yet!
📦 Volume: MA5 volume surpassing MA10 confirms fresh buying
ICP2.5%
- Reward
- 2
- Comment
- Repost
- Share
Digital and Cryptocurrency Market Overview as of the morning of February 27, 2026, compiled from the latest developments over the past 24 hours:
📊 Market Overview: Bitcoin's Recovery Efforts in a Sensitive Zone
The digital financial market entered the final trading day of the week with caution as capital flows showed a clear divergence between asset classes.
1. Bitcoin (BTC): Stuck around the $67K mark
24-hour fluctuations: BTC experienced a volatile trading session with a range of $66.5K to $68.8K. After the previous deep correction, the price showed a technical recovery, but selling pressur
📊 Market Overview: Bitcoin's Recovery Efforts in a Sensitive Zone
The digital financial market entered the final trading day of the week with caution as capital flows showed a clear divergence between asset classes.
1. Bitcoin (BTC): Stuck around the $67K mark
24-hour fluctuations: BTC experienced a volatile trading session with a range of $66.5K to $68.8K. After the previous deep correction, the price showed a technical recovery, but selling pressur
- Reward
- 2
- Comment
- Repost
- Share
📊 Digital Financial Market Report (Last 24 Hours)
Updated: Morning of February 21, 2026
The cryptocurrency market is showing positive signs of recovery after a short correction. Investor sentiment seems to have stabilized as major assets begin to find support at key price levels.
1. Bitcoin (BTC): Bulls Strive to Hold at $68K
24-Hour Volatility: Bitcoin experienced a fairly active trading day with a range of $66.4K to $68.3K. The fact that BTC hit a low of $66.4K but quickly bounced back shows that bottom-buying demand at this price level remains very strong.
Opening price this morning: Recor
- Reward
- 3
- 4
- Repost
- Share
MasterChuTheOldDemonMasterChu :
:
Happy New Year 🧨View More
Digital financial and cryptocurrency market as of the morning of January 19, 2026, based on the latest volatility data:
📊 Crypto Market Pulse: BTC Corrects After Challenging the $95K Zone
Over the past 24 hours, the cryptocurrency market has witnessed a technical correction after an impressive growth streak at the beginning of 2026.
1. Bitcoin (BTC): Profit-taking pressure at a psychological level
24-hour volatility: BTC briefly stabilized within the $93,000 – $95,000 range. However, upon approaching the $95K mark, short-term selling pressure emerged, causing the price to retreat to around $9

- Reward
- 6
- 6
- Repost
- Share
Yunna :
:
Diamond Hands 💎View More
$ICP
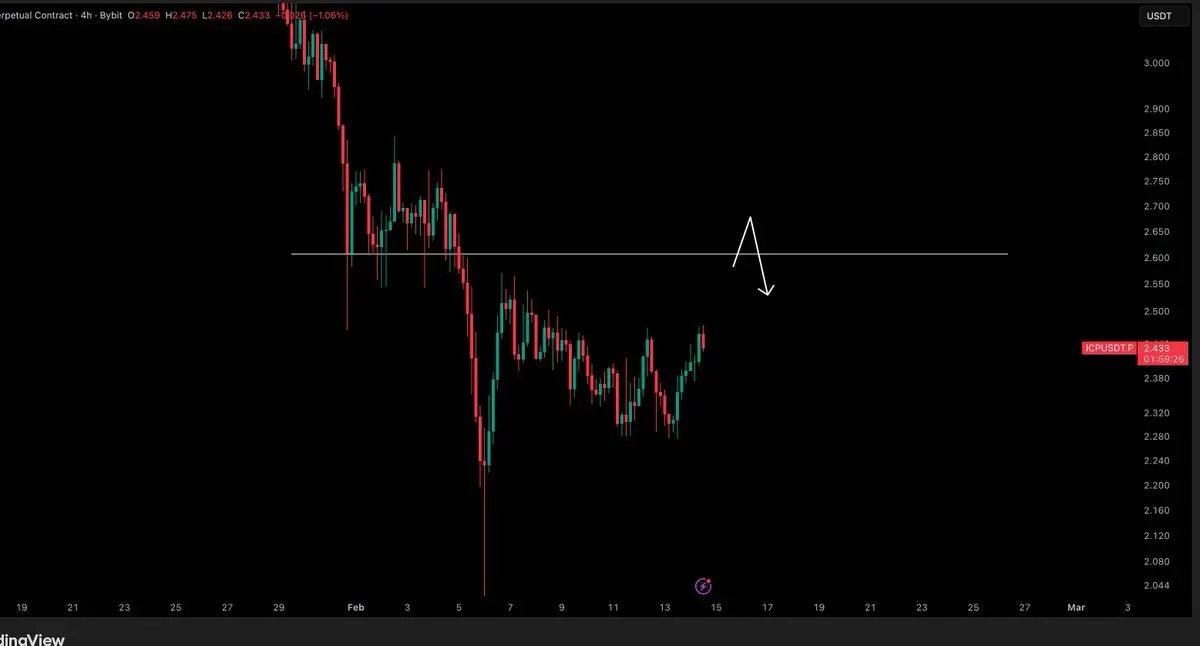
Relief bounce in play, momentum pushing price back toward the $2.60 resistance — key liquidity zone and prior breakdown level.
Wouldn’t be surprised to see that tapped before any real downside continuation.
#ICP #GateSquare$50KRedPacketGiveaway #USCoreCPIHitsFour-YearLow #What’sNextforBitcoin? #GateSpringFestivalHorseRacingEvent
ICP2.5%
- Reward
- 4
- 2
- Repost
- Share
Mhmdqase:
Bullish market at its peak 🐂View More
$ICP
Relief bounce in play, momentum pushing price back toward the $2.60 resistance — key liquidity zone and prior breakdown level.
Wouldn’t be surprised to see that tapped before any real downside continuation.
#ICP #GateSquare$50KRedPacketGiveaway #USCoreCPIHitsFour-YearLow #What’sNextforBitcoin? #GateSpringFestivalHorseRacingEvent $ICP
ICP2.5%
- Reward
- 6
- 1
- Repost
- Share
GateUser-d9e38fb6:
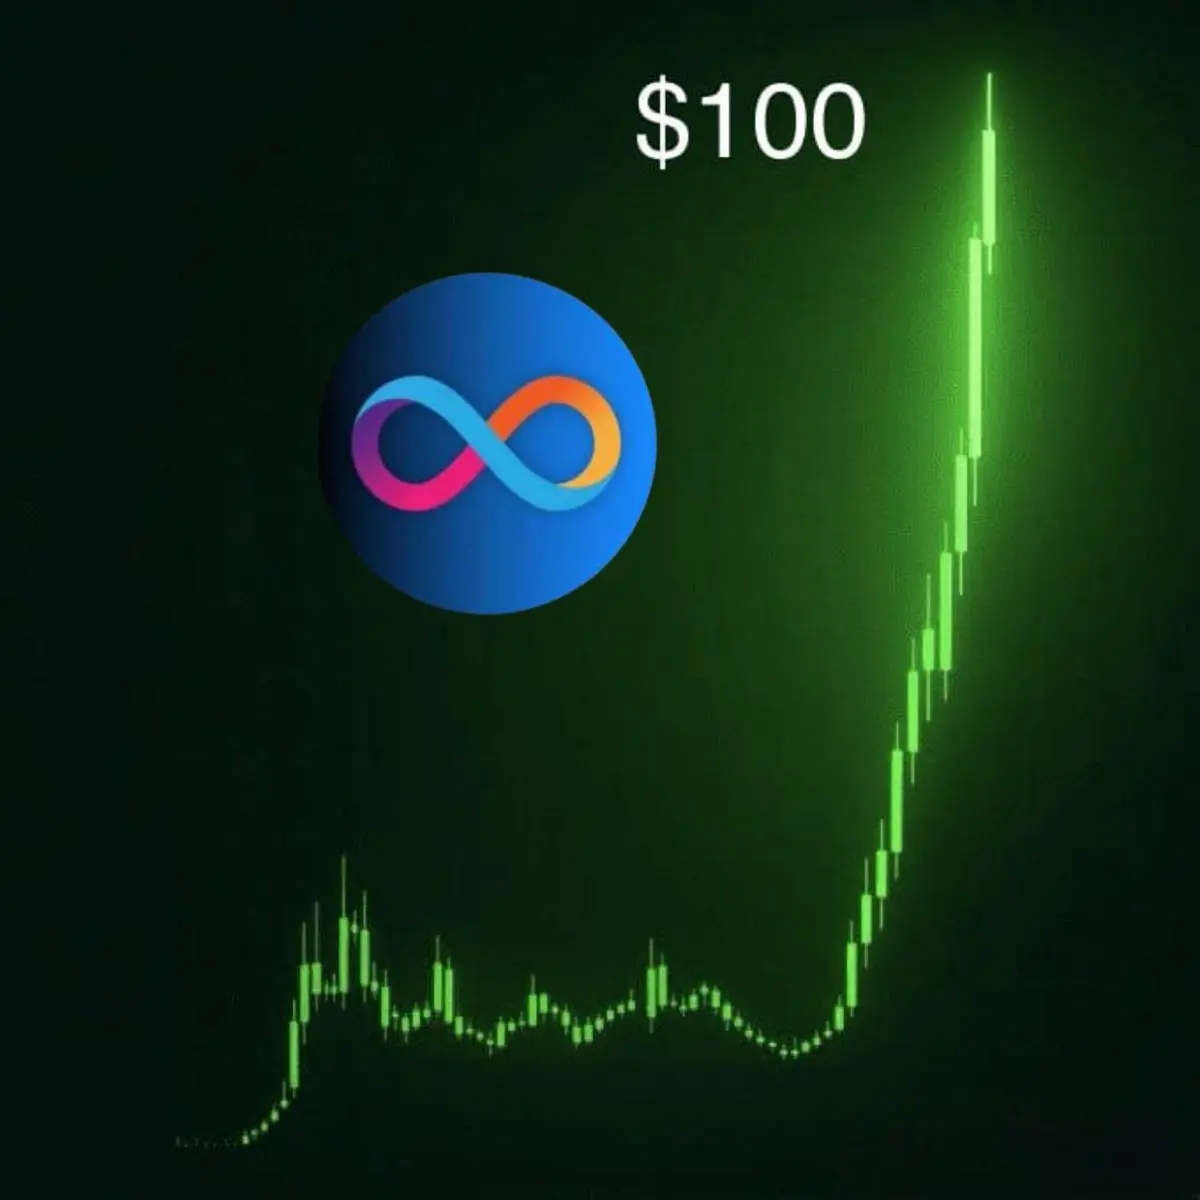
Go full throttle 🚀Guys, be honest. Is it possible for #ICP to reach $100 this year?
$ICP
YES or NO?#SpotGoldHitsaNewHigh
$ICP
YES or NO?#SpotGoldHitsaNewHigh
ICP2.5%
- Reward
- 1
- 2
- Repost
- Share
ShortingBeachfrontVill :
:
It can reach $120,000View More
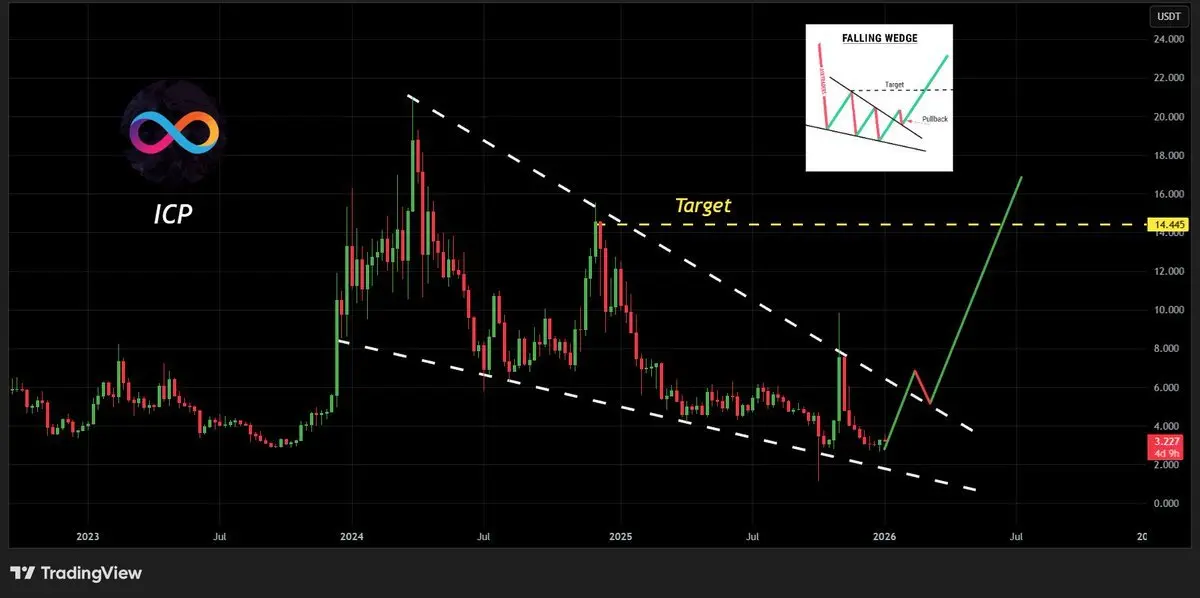
$ICP / USDT - The multi-month Falling Wedge is finally at its limit.
Price is currently tightening at the apex—historical data says the breakout will be violent. We’re looking at a 350% move to reclaim the $14.44 target.
Accumulate the compression. Retest is the entry. Moon is the destination.
#ICP #TariffTensionsHitCryptoMarket #CryptoMarketPullback #GoldandSilverHitNewHighs
ICP2.5%
- Reward
- 1
- 1
- Repost
- Share
InsteadOf:
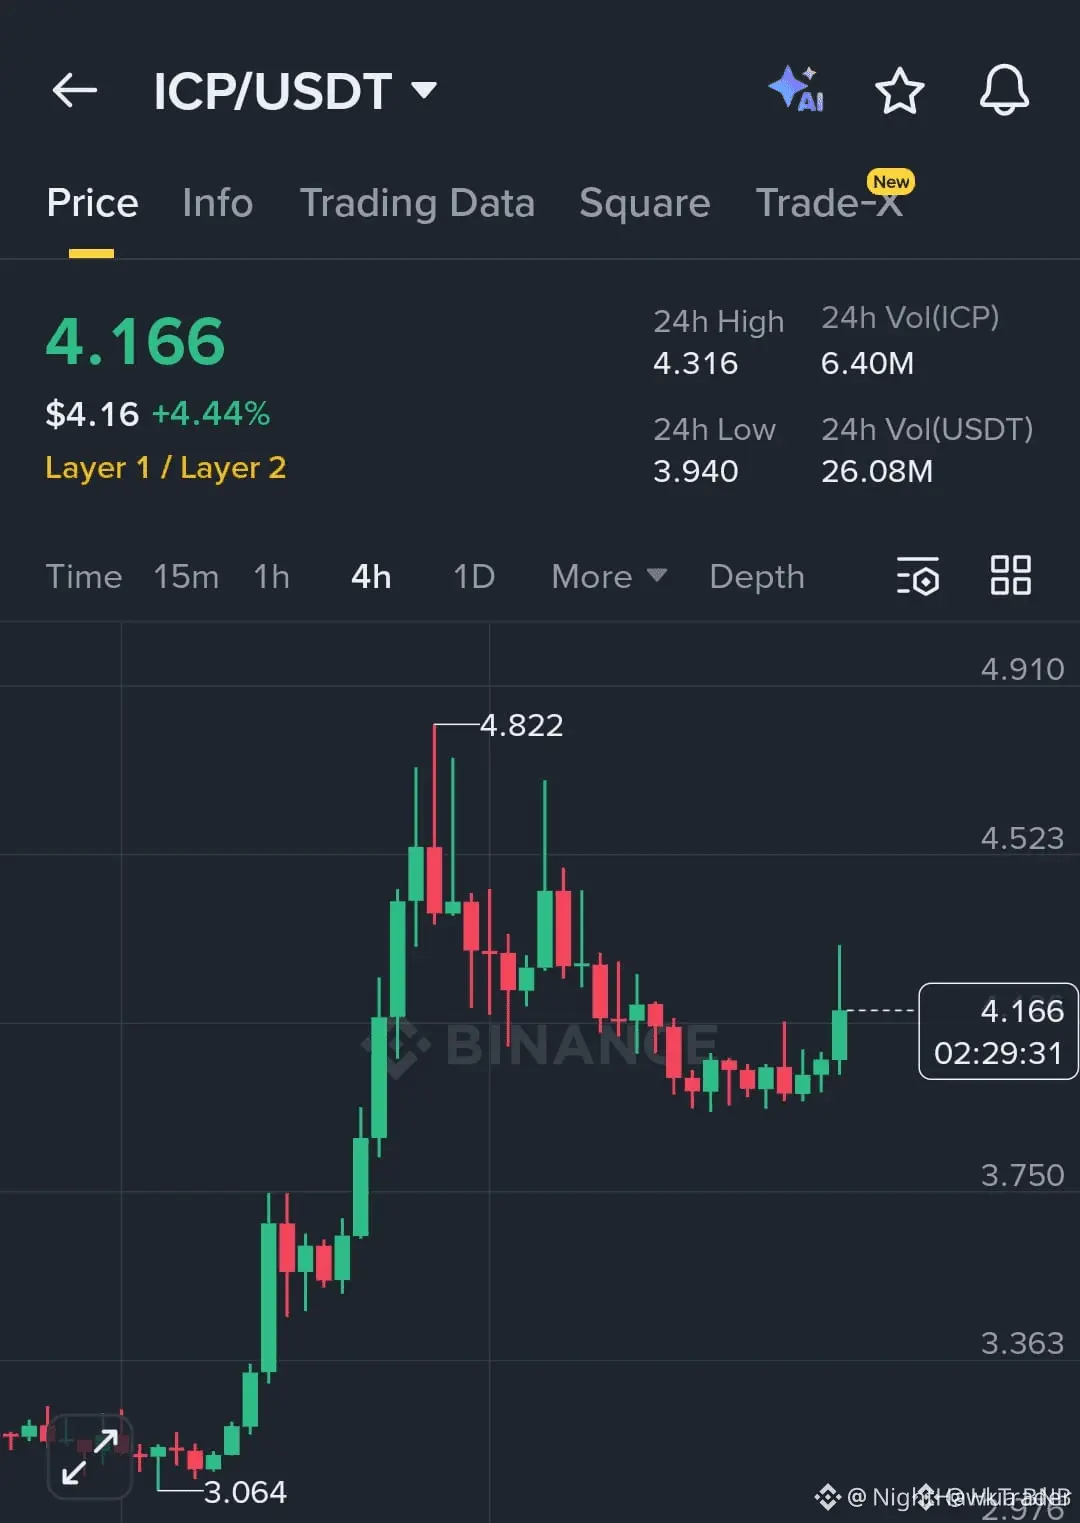
icp=icu$ICP EXPLOSION IMMINENT
Entry: 4.10 - 4.15 🟩
DCA: 4.05 - 4.08 🟩
Target 1: 4.17 🎯
Target 2: 4.20 🎯
Target 3: 4.25 🎯
Target 4: 4.30 🎯
Stop Loss: 4.00 🛑
Bullish energy is off the charts on $ICP. The 4H is screaming buy. This is your moment. Don't miss this rocket ship. Leverage 10x-20x, Margin 1%-3%. Book partials at TP1 and secure your capital. The FOMO is real. Get in now.
Disclaimer: Trading involves risk.
#ICP #Crypto #Trading #FOMO 🚀
$ICP
ICP2.5%
- Reward
- 2
- 1
- Repost
- Share
GateUser-5919b282:
Bull run 🐂Load More
Join 40M users in our growing community
⚡️ Join 40M users in the crypto craze discussion
💬 Engage with your favorite top creators
👍 See what interests you
Trending Topics
356.48K Popularity
21.94K Popularity
64.24K Popularity
15.6K Popularity
463.11K Popularity
3.78K Popularity
3.51K Popularity
1.86K Popularity
1.06K Popularity
80.25K Popularity
42.1K Popularity
97.54K Popularity
14.53K Popularity
67.09K Popularity
3.03K Popularity
News
View MoreLobster increased by 872.32% after launching Alpha, current price 0.0018772 USDT
36 m
Data: If BTC breaks through $68,773, the total liquidation strength of mainstream CEX short positions will reach $1.759 billion.
1 h
Data: If ETH breaks through $2,020, the total liquidation strength of short positions on mainstream CEXs will reach $758 million.
1 h
Traditional Finance Alert: NFLX Surges Over 12%
2 h
Lobster rose by 620.27% after going live on Alpha; current price is 0.0013907 USDT
2 h
Pin