Post content & earn content mining yield
placeholder
gatefun
gatefun
The current trend is basically in line with expectations. From the decline to the support pin rebound, it has been mostly predicted. Right now, the rebound strength of Bitcoin and Ethereum is still weak, and there hasn't been a direct V-shaped recovery. So, as mentioned in the live broadcast, there are two bullish scenarios: one is a direct push up to the 76-80 resistance zone for Bitcoin and the 2500-2600 zone for Ethereum; the other is a gradual increase with small pullbacks, step by step. Which one do you prefer? Drop your thoughts in the comments.
As for now, Bitcoin's support will likely
BTC3.9%
View Original
post-image
post-image
  • Reward
  • 1
  • Repost
  • Share
GarlicChivesAndScallionsvip:
2050 Cool
The United States 🇺🇸 has lost all its underwear 😃
1. Military bases with over a decade of layout have been damaged
2. Radar + air defense systems have been dismantled
3. Aircraft carriers have become old assets
4. Gods cannot bleed → Gods are covered in blood 🩸
View Original
  • Reward
  • Comment
  • Repost
  • Share
Congratulations to the brothers who followed the point prompts and placed orders yesterday. The first 2047 short position has taken profit, gaining 37 points...
(The highest yesterday reached 2053, the first to hit precisely, currently still profitable. You can reduce your position to hold or reduce to protect your principal. How much profit to take is up to you...)
View Original
post-image
post-image
  • Reward
  • Comment
  • Repost
  • Share
EGY
EGY
Egypt
gatefun
Created By@gatefunuser_b098
Listing Progress
100.00%
MC:
$36.67K
More Tokens
2049 is half long
🈳 Although I didn't get in, the prediction accurately pointed to position 2053
View Original
post-image
  • Reward
  • Comment
  • Repost
  • Share
Good morning, guys. We managed to land the short around 69500 overnight on BTC, BTC +1000 and ETH +50 gains.
BTC short at 69500, ETH short at 2045. Currently BTC has moved down to 68400 and ETH to 1993. We're reducing positions where we should reduce, locking in profits where we should lock in profits, and moving our stops lower.
BTC3.9%
View Original
post-image
post-image
post-image
  • Reward
  • Comment
  • Repost
  • Share
Tuesday morning, March 10th, BTC/ETH sharing
Three attempts to break through the resistance level have all failed to produce an effective breakout. Each rally was quickly reversed after a brief surge, leaving a clear long upper shadow on the daily chart. This pattern typically indicates that supply pressure above is very concentrated, and the bullish momentum to push higher is gradually weakening. The so-called "pin bar" market is essentially a failed breakout attempt—price briefly pierces a key level but is quickly suppressed back down, indicating that a large amount of active sell orders hav
BTC3.9%
ETH2.99%
SOL3.46%
View Original
post-image
  • Reward
  • Comment
  • Repost
  • Share
🚨 Gate Live Streamer Recruitment | Earn Up to $100 GT
New to Gate Live? Complete the required streams
🎁 Earn up to $100 GT in new streamer rewards!
📊 Official Streamer Growth Guide is Live
From zero to consistent streaming — every step is clear.
Learn the data · Follow the strategy · Claim rewards
Even beginners can start fast 🚀
👉 Growth Guide: https://www.gate.com/campaigns/3643
👉 Event Details: https://www.gate.com/announcements/article/50002#GateFebruaryTransparencyReport #GateBlueLobsters
GT0.28%
  • Reward
  • 7
  • Repost
  • Share
CryptosTalkervip:
To The Moon 🌕
View More
Last night, the market showed obvious top divergence, making it easy to be pulled down by the US stocks. It's not suitable to enter long positions now. I placed a sell order at 2057, missing the entry by a few points. The basic idea aligns with the market trend#微策略再砸12.8亿美元增持BTC
BTC3.9%
View Original
post-image
post-image
TradingKingGaoYuliangvip
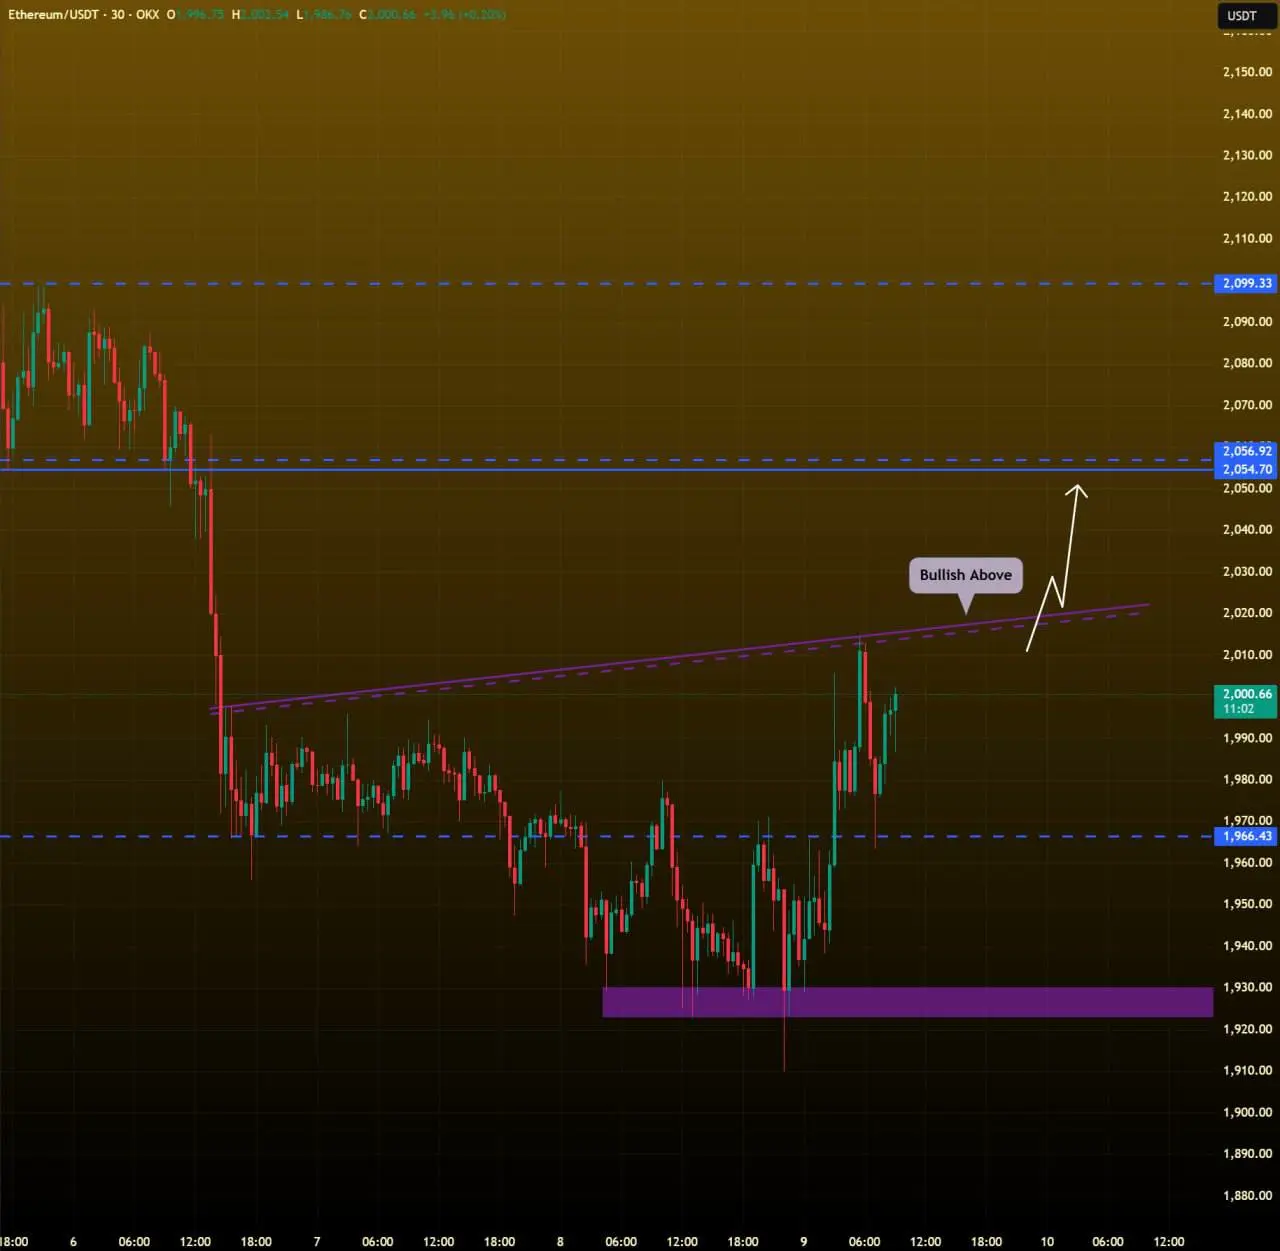
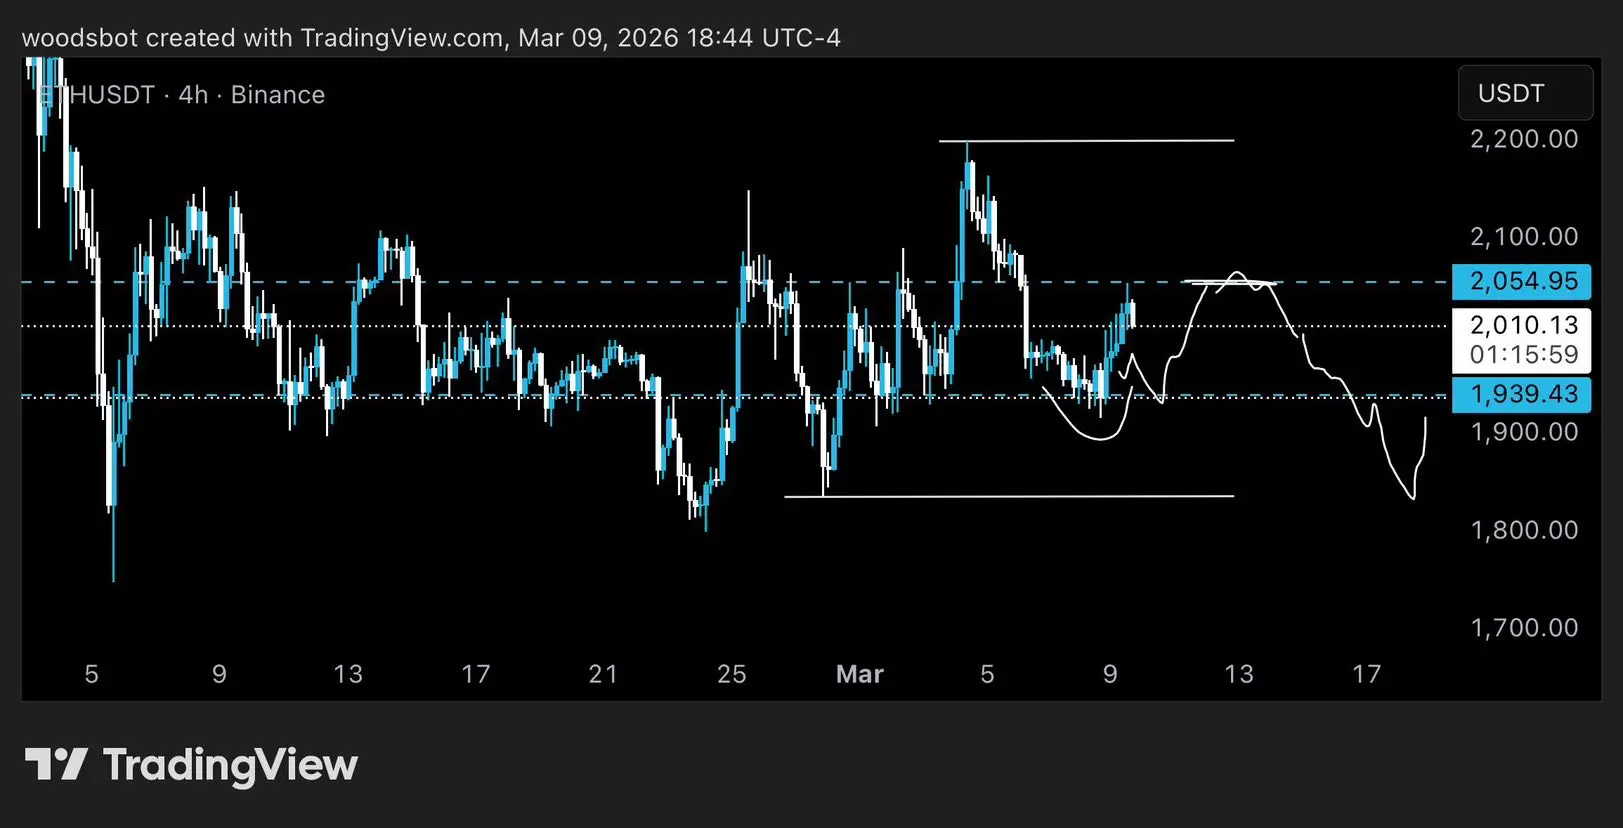
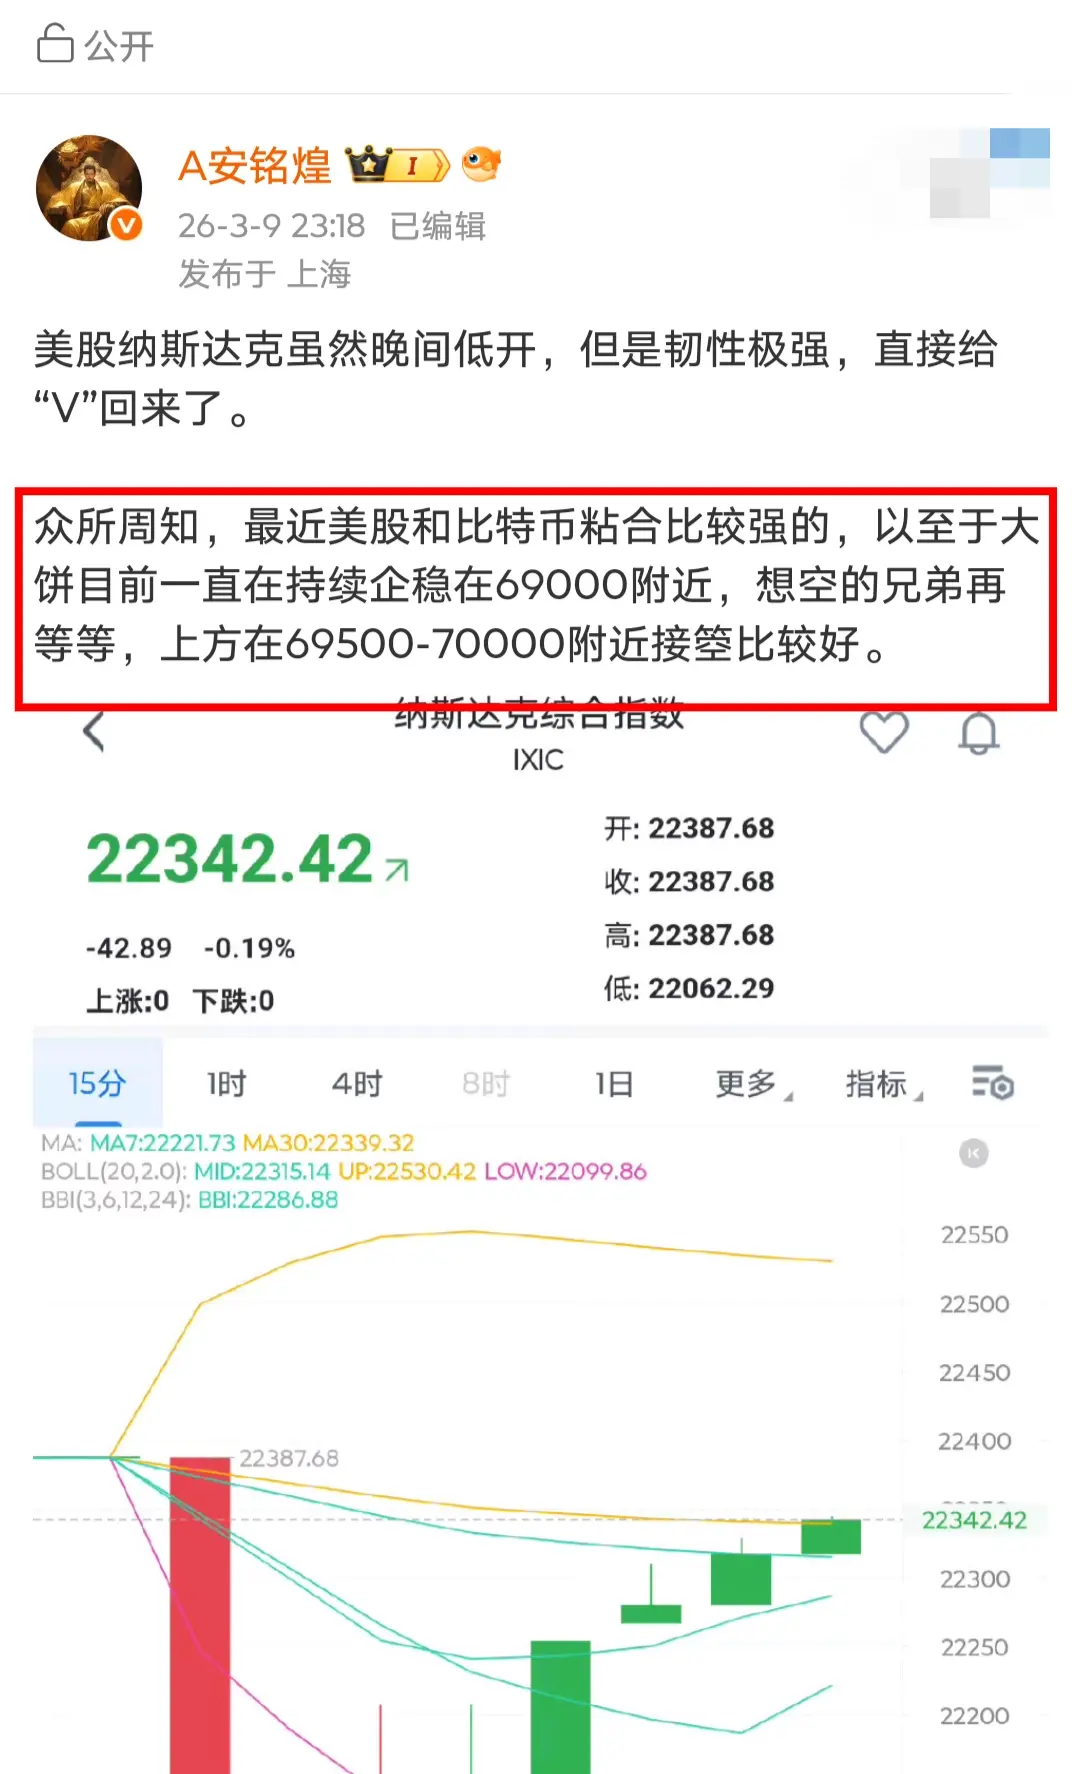
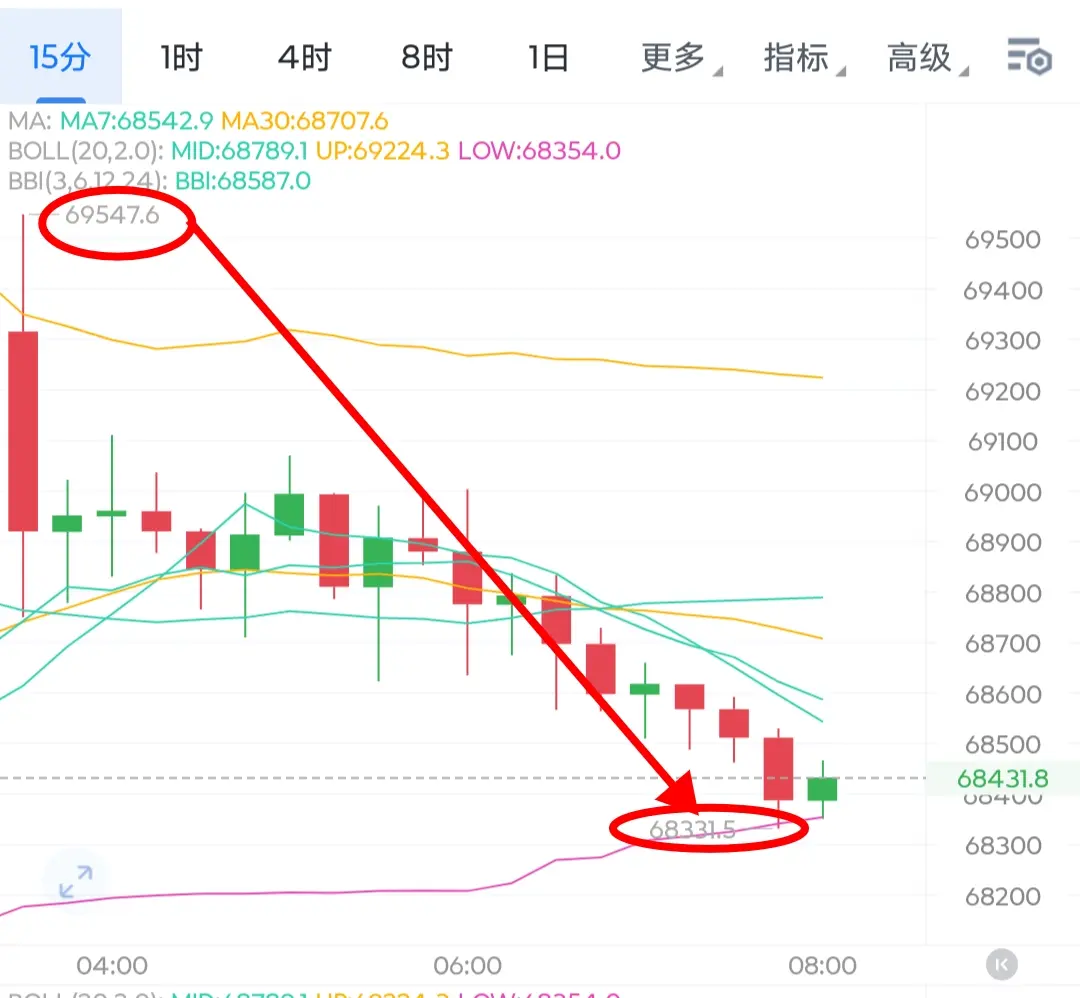
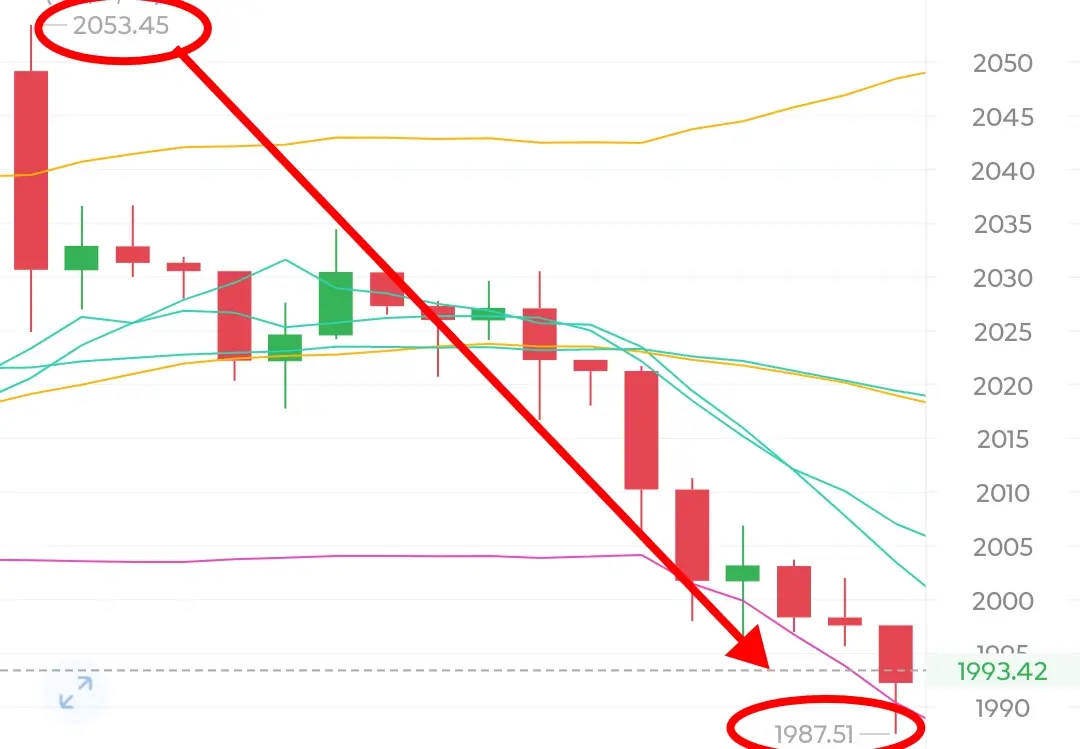
The short-term market continues to fluctuate at high levels, with bulls and bears repeatedly pulling and pushing around 2030. The 15-minute MACD on Ethereum shows a clear top divergence, and the RSI indicator shows a slight divergence. Note that U.S. stocks have continued to strengthen after 10 o'clock, with the Nasdaq recovering 2% of its decline, indicating a strong rebound. The crypto market has not followed the same upward trend and also shows divergence, which may be driven down by a pullback in U.S. stocks#微策略再砸12.8亿美元增持BTC
repost-content-media
  • Reward
  • 7
  • Repost
  • Share
GateUser-185e813fvip:
Last night, I set it at 55 but didn't get in.
View More
On the hourly chart, the market is operating in the upper band of the Bollinger Bands, with the upper band exerting continuous pressure. The upper shadow of the candlesticks keeps appearing, indicating a very ideal shift in market bearishness. The MACD technical indicator shows that the previous golden cross pattern is gradually turning bearish, with the bullish histogram decreasing step by step. The market's bearish trend is gradually warming up.
Combined with the strong resistance around 69,500 for Bitcoin given late yesterday evening, several upward attempts have failed to break through eff
View Original
post-image
post-image
post-image
post-image
  • Reward
  • Comment
  • Repost
  • Share
$FLOW Signal】Long - 1H Breakout and Retest Confirmation, Negative Funding Rate Short Squeeze in Progress
$FLOW The 1-hour timeframe has experienced a massive rally and is now in a healthy retracement confirmation phase. The price has fallen from a high of 0.05299 to around 0.0508, testing the support of the 1-hour moving averages. The 4-hour chart shows that the price has strongly broken through the previous consolidation range, forming a clear upward trend. Currently, the negative funding rate is as high as -0.23%, and with open interest remaining stable, it indicates that short sellers are
FLOW23.24%
BTC3.9%
ETH2.99%
SOL3.46%
View Original
post-image
  • Reward
  • Comment
  • Repost
  • Share
Midnight thoughts and what I mentioned during the live broadcast: when the volatility is not so large, the target can be appropriately reduced. In the early morning, I explained clearly that the Bitcoin target was changed to 69,500 because the entry point was around 68,350. Ethereum entered at 2007 with a target of 2050. All targets have been achieved. Although the profit space was relatively small, everything was realized.
From a technical structure perspective, the overall relative price comparison is still in a major oscillation phase. The bullish trend has not formed an effective continuat
ETH2.99%
BTC3.9%
View Original
post-image
  • Reward
  • Comment
  • Repost
  • Share
#USJobsReportSignalsMarketUncertainty 🇺🇸📊
The latest U.S. labor market report surprised investors after February Nonfarm Payrolls came in weaker than expected. Instead of showing steady job growth, the data revealed a slowdown in hiring, prompting traders to reconsider the outlook for economic momentum and Federal Reserve policy.
Across global markets — including equities and cryptocurrencies — the report has triggered a more cautious tone as investors evaluate how a softer labor market could influence inflation and interest-rate decisions in the coming months.
Dragon Fly Official notes tha
STABLE5.89%
post-image
  • Reward
  • Comment
  • Repost
  • Share
ido
ido
iron dome
gatefun
Created By@GateUser-a00d5c7b
Listing Progress
0.00%
MC:
$0.1
More Tokens
$ETH Laughing to death😂 1993's short squeeze for a day, finally some hope. Doesn't matter anymore. Take profit at 1950, stop loss at 2010. If I lose, I lose.
ETH2.99%
View Original
post-image
  • Reward
  • Comment
  • Repost
  • Share
3.10 Morning Bitcoin Outlook: Three Rebounds and Pullbacks Signal a Top! Clear High-Altitude Strategy at 69,000-69,500
From the four-hour chart, recent prices have repeatedly surged and pulled back, with frequent spike-like formations, indicating that bullish momentum is clearly weakening. The price has attempted to break through near 69,500 three times but has failed to do so effectively, quickly retreating after each surge, leaving long upper shadows. This is a typical sign of heavy selling pressure above and a lack of bullish strength. Spike-like formations are essentially false breakouts,
BTC3.9%
View Original
post-image
  • Reward
  • Comment
  • Repost
  • Share
$ASTER at a Crossroads as Burns and Buybacks Try to Shift Momentum
Aster has spent nearly a month moving inside a tight range after failing to reclaim the $0.76 level. Since then the price has largely stayed between $0.65 and $0.76, leaving the market stuck in a wait-and-see phase.
At the time of writing, ASTER is trading around $0.702, up about 2.3% after bouncing back from a brief dip to $0.67. The move shows buyers are still active near the lower end of the range, but a decisive breakout has yet to appear.
To help stabilize the market, the Aster team has been pushing forward with supply-re
ASTER1.52%
post-image
post-image
  • Reward
  • Comment
  • Repost
  • Share
Bitcoin Live Analysis | Market Next Move?
gate liveLIVE
1
  • Reward
  • Comment
  • Repost
  • Share
Every morning millions of traders perform the same ritual:
They open the chart…
And sacrifice their patience to the gods of volatility.
post-image
  • Reward
  • Comment
  • Repost
  • Share
# Bitcoin Market Analysis

Bitcoin (BTC) is currently trading in a consolidation phase after recent volatility. The price is hovering near a key support zone where buyers are showing interest, suggesting potential accumulation. If BTC holds above this support, a bullish continuation toward the next resistance level could occur. However, failure to maintain this level may trigger a short-term pullback. Market sentiment remains cautiously optimistic as traders watch macroeconomic signals and liquidity flow into crypto markets. Volume spikes indicate increasing activity, which could lead to a br
BTC3.9%
post-image
  • Reward
  • 1
  • Repost
  • Share
MrThanks77vip:
To The Moon 🌕
Hello everyone
Wishing you all a productive and profitable start to the week.
Let’s take a look at Ethereum.
#ETH is beginning to form a potential inverse head and shoulders structure on the lower timeframe, with price gradually building higher lows.
The key level to watch is the $2,000 neckline. $ETH is currently testing that area, and a clean break above it would confirm short-term strength and open the path toward $2,055, followed by the $2,100 region.
As long as price remains below $2,000, the structure is still developing and buyers haven’t fully taken control yet.
Key levels for today
ETH2.99%
post-image
  • Reward
  • Comment
  • Repost
  • Share
ETH
In review, we see that ETH is at 1940, maintaining resilience and moving towards 2054. It is stuck in the middle of Bitcoin.
The support at 1940 and the resistance at 2054 are the tight limits within the range I just mentioned. The next move will depend on which of these two levels is accepted. Once one side is thoroughly broken through, we will see a full liquidation of unfavorable intermediate traders, who will try to avoid getting caught in these upward or downward trends.
Personally, I firmly believe that in the next few days, it will break downward. Isn't the rapid rise in a bear mark
ETH2.99%
BTC3.9%
View Original
post-image
[The user has shared his/her trading data. Go to the App to view more.]
  • Reward
  • Comment
  • Repost
  • Share
Load More

Join 40M users in our growing community

⚡️ Join 40M users in the crypto craze discussion
💬 Engage with your favorite top creators
👍 See what interests you