Crypto markets can change direction quickly, so traders often look beyond whether price is moving up or down. The most useful question is whether the move has enough pressure behind it to continue. A rally may lose strength even while price is still rising, and a sell-off may begin to weaken before the chart shows a clear reversal.
This is where the technical indicator like Momentum becomes useful. It gives traders a way to observe whether buying or selling pressure is expanding, fading, or becoming unstable across recent price movements.
Momentum should not be treated as a prediction tool on its own. Its role is to add context, helping traders assess trend strength, possible exhaustion, and the quality of a price move when used with market structure, volume, support and resistance, or confirmation tools such as the Awesome Oscillator (AO).
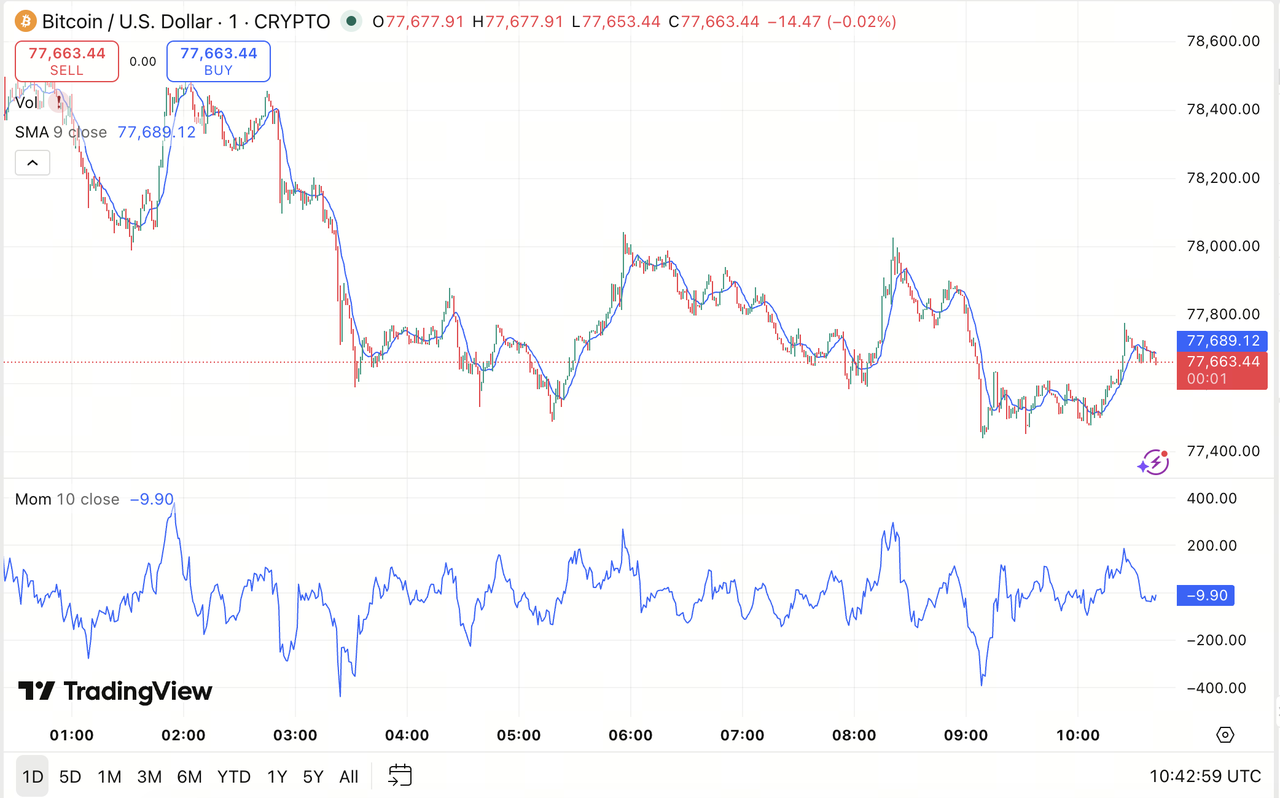
Source: TradingView
What the Momentum Indicator Is
In technical analysis, Momentum refers to the force behind a price move, measured by comparing the current price with a previous price over a selected period.
Its main purpose is to show whether price movement has strength behind it. Instead of asking only whether price is moving up or down, Momentum helps traders assess whether that movement is becoming stronger or weaker compared with the recent past.
In trading, Momentum is often used as a trend strength indicator because it helps show whether price movement is gaining or losing force. It is usually displayed as a line above or below a central reference level. When the line rises, trend strength is improving; when it falls, trend strength is weakening.
For beginner traders, the simplest way to understand Momentum is this: it shows how much pressure exists behind a move. A strong upward trend with rising Momentum suggests that buyers are still active. A rising price with falling Momentum may suggest that the move is continuing, but with less strength.
This makes Momentum especially useful in crypto markets, where sudden moves can look powerful at first but may quickly lose energy.
How Momentum Is Calculated
Momentum is calculated by comparing the current closing price with the closing price from a previous period.
A simple version of the calculation is:
Momentum = Current Price − Price N Periods Ago
For example, if the indicator uses a 10-period setting, it compares the latest closing price with the closing price from 10 candles earlier. On a daily chart, that means today’s close is compared with the close from 10 days ago. On an hourly chart, it compares the current hour with 10 hours earlier.
The exact number of periods can be adjusted. A shorter setting reacts faster but may create more noise. A longer setting moves more slowly but may provide a smoother view of broader trend pressure.
The calculation itself is not the most important part for most traders. What matters is the interpretation: Momentum rises when current prices are moving further away from past prices in the direction of the trend. It falls when that difference narrows.
| Momentum Reading |
Basic Meaning |
Practical Interpretation |
| Rising above the center line |
Upward pressure is increasing |
Buyers may be gaining strength |
| Falling above the center line |
Upward pressure is weakening |
An uptrend may be slowing |
| Falling below the center line |
Downward pressure is increasing |
Sellers may be gaining strength |
| Rising below the center line |
Downward pressure is weakening |
A downtrend may be losing force |
This table gives a simplified view. In practice, traders usually compare Momentum with price structure instead of reading the indicator in isolation.
Reading Positive and Negative Momentum
Momentum is often read around a central level, commonly called the zero line or baseline. The meaning depends on whether the indicator is above or below that level and whether it is rising or falling.
Positive Momentum usually means the current price is higher than the price from the selected earlier period. This suggests that price has advanced over that lookback window. If positive Momentum is also rising, the upward move may be gaining strength.
Negative Momentum usually means the current price is lower than the price from the selected earlier period. This suggests that price has declined over that window. If negative Momentum is falling further, downside pressure may be increasing.
However, positive does not automatically mean “buy,” and negative does not automatically mean “sell.” A market can remain positive while gradually weakening. It can also remain negative while sellers lose control.
For example, Bitcoin or another crypto asset may continue making higher highs while Momentum forms lower highs. This can suggest that the trend is still upward, but the speed behind the move is fading. Traders often watch this kind of difference as a warning sign, not as a standalone reversal signal.
Momentum vs Rate of Change (ROC)
Momentum and Rate of Change, often called ROC, are closely related indicators. Both compare the current price with the past price. The difference lies in how they express that comparison.
Momentum usually shows the price difference in absolute terms. ROC shows the change as a percentage.
For example, if an asset rises from 100 to 110, Momentum may show a difference of 10. ROC would show a 10% increase. Because ROC uses percentage change, it can be easier to compare across assets with very different prices.
In crypto markets, this distinction matters. A $100 move in Bitcoin is not the same as a $100 move in a lower-priced token. ROC normalizes the move by showing it as a percentage. Momentum, by contrast, keeps the focus on the raw difference between current and past price.
Both indicators help traders evaluate speed and pressure. Momentum may feel more direct, while ROC may be more useful when comparing different assets or timeframes.
Neither tool should be treated as complete analysis by itself. They are best used as part of a broader process that includes market structure, trend direction, volume behavior, and risk control.
Momentum in Trend Acceleration and Deceleration
Momentum is especially useful for identifying whether a trend is accelerating or decelerating.
Trend acceleration means price is moving with increasing force. In an uptrend, this may appear as higher prices combined with rising Momentum. In a downtrend, it may appear as lower prices combined with falling Momentum.
Trend deceleration means the trend is still moving, but with less force. This can happen before consolidation, a pullback, or a possible reversal. A market can continue rising even while Momentum starts to fall, which means traders should separate direction from strength.
In practical terms, Momentum can help traders ask better questions:
-
Is the current move stronger than the previous move?
-
Is price making new highs with stronger or weaker pressure?
-
Is a sell-off accelerating, or are sellers beginning to lose control?
-
Is a breakout supported by rising momentum, or does it lack confirmation?
These questions are valuable because markets do not move in straight lines. A breakout with rising Momentum and rising volume may carry more weight than a breakout where Momentum is flat or declining. A downtrend with weakening Momentum may suggest that sellers are no longer pressing with the same intensity.
This is why many traders combine Momentum with trend indicators, moving averages, volume tools, or oscillators such as the Awesome Oscillator (AO). The goal is not to make the chart more complicated, but to confirm whether different signals are pointing to the same market condition.
Limitations of Momentum
The Momentum indicator has several limitations. The most important is that it can produce misleading signals in sideways or choppy markets.
When price moves within a range, Momentum may cross above and below its baseline without a clear trend developing. This can create false impressions of strength or weakness. In such conditions, traders often need support and resistance analysis to understand the broader market structure.
Momentum can also react late or too quickly depending on the chosen period. A short lookback setting may catch rapid changes but can be noisy. A longer setting may filter out small moves but may respond after much of the move has already happened.
Another limitation is that Momentum does not explain why price is moving. It does not show news, liquidity conditions, order book depth, macro events, or changes in market sentiment. It only measures the relationship between current and past price.
Divergence is also easy to misunderstand. A bearish divergence, where price rises while Momentum weakens, does not guarantee an immediate reversal. It only suggests that upward pressure may be fading. A strong trend can continue for a long time even after Momentum starts to slow.
For this reason, Momentum should be used as a confirmation and context tool. It works better when paired with price action, trend analysis, volume, and clear risk management.
Conclusion
Momentum is a practical indicator for understanding the speed and strength of price movement. By comparing the current price with a previous price, it shows whether a market move is gaining pressure, losing force, or becoming unstable.
For beginner crypto traders, the main value of Momentum is not prediction. Its value lies in context. It helps traders distinguish between a trend that is strengthening and a trend that may be slowing down.
Positive Momentum suggests that price is above its earlier level, while negative Momentum suggests that price is below it. Rising Momentum often points to increasing force, and falling Momentum often points to weakening pressure. These readings become more useful when compared with price structure and volume.
Momentum should not be treated as a direct buy or sell signal. Like any indicator, it reflects past price behavior. Its strongest use is in helping traders understand whether current market movement has enough strength to support the trend.
FAQs
What does the Momentum indicator show?
The Momentum indicator shows the speed and strength of price movement by comparing the current price with a previous price. It helps traders see whether a market move is gaining or losing pressure.
How to interpret positive and negative Momentum?
Positive Momentum suggests price is higher than a previous period and may support a bullish view. Negative Momentum suggests price is lower and may indicate downside pressure. Neither should be used alone; traders confirm with trend, volume, and price structure.
How is Momentum different from ROC?
Momentum measures the absolute difference between current price and past price. Rate of Change measures that difference as a percentage. ROC can be easier for comparing different assets, while Momentum provides a direct view of price difference.
Can Momentum identify reversals?
Momentum can help identify weakening trend pressure, especially through divergence, but it does not confirm reversals by itself. A reversal signal should be checked against support and resistance, trend structure, volume, and broader market conditions.
Is Momentum useful for crypto trading?
Momentum can be useful in crypto trading because crypto markets often move quickly and sharply. It helps traders evaluate whether a price move has strength behind it. However, it should be used with other tools rather than as a standalone trading signal.