Average Directional Index (ADX) was introduced as part of a directional movement system designed to bring greater objectivity to price analysis. Over time, as trading shifted toward systematic and rules-based approaches, the ability to separate trend strength from direction became increasingly valuable.
Not every price movement develops into a meaningful trend. Some markets move decisively, while others fluctuate without clear direction. ADX provides a way to distinguish between these conditions, helping traders and analysts better understand when trends are strong enough to matter. It is often used alongside indicators like MACD to build a more complete view of market behavior.
What ADX Is
The Average Directional Index (ADX) measures the strength of a market trend without indicating whether the trend is upward or downward.
It belongs to the broader category of trend analysis tools, focusing specifically on the intensity of price movement. Rather than tracking price direction directly, ADX evaluates whether market activity reflects a sustained trend or a lack of clear momentum.
This distinction addresses a common challenge in trading: identifying when conditions are suitable for trend-based strategies. In markets where price movement lacks strength or consistency, many trend-following approaches tend to underperform. ADX helps filter out those weaker conditions.
How ADX Is Calculated
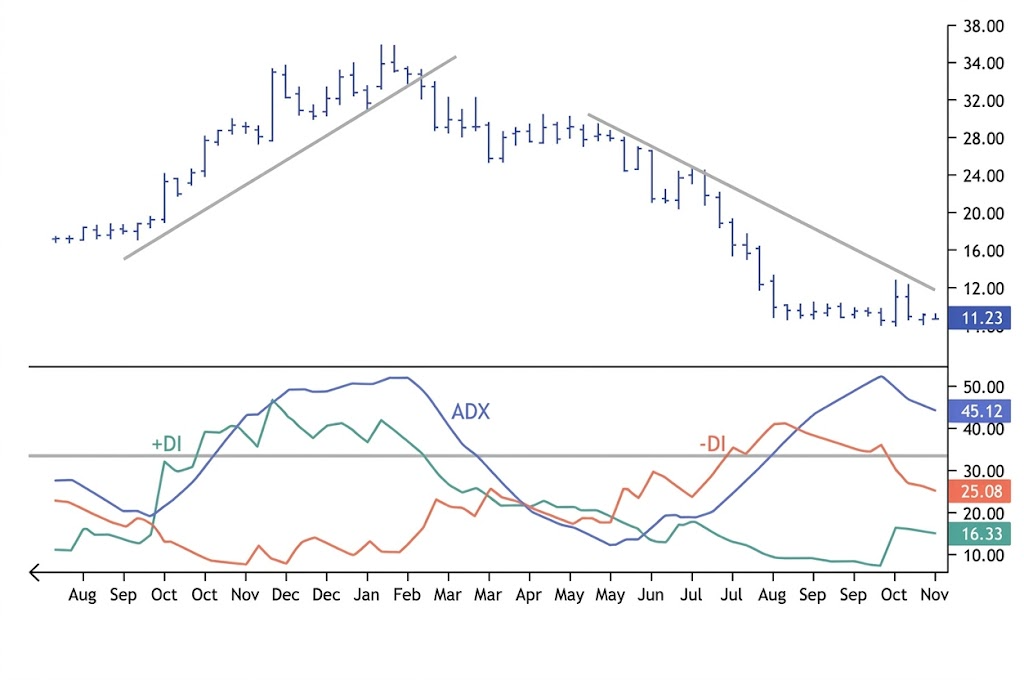
ADX comes from a directional movement system built on three related components:
-
ADX line, which shows overall trend strength
-
+DI (Positive Directional Indicator), which reflects upward directional movement
-
-DI (Negative Directional Indicator), which reflects downward directional movement
The calculation is easier to understand when broken into steps:
Step 1: Measure directional movement
Price data is first examined to identify how much movement occurred upward and how much occurred downward during each period. This creates the basis for separating positive movement from negative movement.
Step 2: Build the +DI and -DI values
The upward movement is used to form +DI, while the downward movement is used to form -DI. These two lines show which side of the market is exerting more pressure.
Step 3: Smooth the data over time
The directional values are then smoothed over a selected period, most commonly 14 intervals. This helps reduce random short-term fluctuations and makes the indicator easier to read.
Step 4: Compare the two directional lines
Once +DI and -DI are established, their difference is compared in a standardized way. This comparison shows whether directional movement is becoming more distinct or remains weak.
Step 5: Average the result into ADX
The final step is to smooth and average that comparison into a single line: the ADX line. This line does not show direction. It only shows whether the trend, in either direction, is becoming stronger or weaker.
A few characteristics define how ADX behaves:
-
It is always shown as a positive value
-
It usually moves within a range of 0 to 100
-
It is designed to filter out short-term market noise
Because ADX relies on smoothing, it does not respond instantly to sudden price changes. Instead, it reflects the broader strength of a developing trend, which makes it more stable but also slightly delayed.
Reading ADX Values: Weak vs Strong Trend Thresholds
ADX values are interpreted through ranges that reflect how strong a market trend is. Instead of focusing on price direction, these levels help determine whether market movement is meaningful or relatively weak.
The table below provides a commonly used framework for understanding ADX levels:
| ADX Value Range |
Trend Strength |
Market Interpretation |
| 0 – 20 |
Weak |
Market lacks clear direction; often range-bound |
| 20 – 25 |
Developing |
Early signs of a potential trend forming |
| 25 – 50 |
Strong |
Established trend with consistent movement |
| 50 – 75 |
Very Strong |
High momentum with sustained directional pressure |
| 75 – 100 |
Extreme |
Rare conditions with unusually strong trend intensity |
These ranges offer a practical way to assess market conditions. While the exact thresholds may vary slightly depending on the asset or timeframe, the general structure remains widely applicable.
Several behavioral patterns are important when reading ADX:
-
A rising ADX indicates that trend strength is increasing, regardless of direction
-
A falling ADX suggests that the current trend may be losing momentum
-
Low ADX values are typically associated with sideways or consolidating markets
A key point to keep in mind is that ADX does not indicate whether a trend is upward or downward. A high ADX value simply confirms that the market is moving strongly, which can occur in both uptrends and downtrends.
+DI and -DI: Identifying Trend Direction Alongside ADX
To determine trend direction using ADX, the process involves combining it with the +DI and -DI lines:
-
Step 1: Identify +DI and -DI +DI reflects upward price movement, while -DI reflects downward price movement.
-
Step 2: Compare their position If +DI is above -DI, upward pressure is stronger. If -DI is above +DI, downward pressure is stronger.
-
Step 3: Watch for crossovers A +DI crossover above -DI may signal increasing bullish momentum. A -DI crossover above +DI may indicate growing bearish momentum.
-
Step 4: Check ADX for strength Rising ADX confirms strengthening trend conditions, while low ADX suggests weak or unreliable signals.
-
Step 5: Combine direction and strength +DI and -DI indicate direction, while ADX confirms whether the trend is strong enough to be meaningful.
This structured approach separates direction from strength, allowing for clearer interpretation of market behavior. This approach is conceptually similar to indicators like MACD, which also aim to combine different dimensions of price behavior.
ADX in Ranging and Trending Market Conditions
One of the most practical uses of ADX is identifying whether a market is trending or moving sideways.
Trending Markets
-
ADX typically rises above 25 When ADX moves above this level, it signals that a meaningful trend is developing and gaining strength.
-
Price movement shows continuity and direction Prices tend to move more consistently in one direction, with fewer abrupt reversals.
-
Trend-following strategies become more effective Strategies based on momentum or breakouts tend to perform better when a strong trend is present.
-
Rising ADX confirms strengthening conditions An increasing ADX suggests that the current trend is becoming more established, regardless of whether it is upward or downward.
Ranging Markets
-
ADX tends to remain below 20 Low ADX values indicate weak momentum and the absence of a clear trend.
-
Price moves within a horizontal range The market fluctuates between support and resistance levels without sustained direction.
-
Momentum is inconsistent and short-lived Price movements often reverse quickly, making trend-based signals less reliable.
-
Range-based strategies may be more suitable Approaches focused on reversals or oscillations tend to align better with sideways conditions.
Recognizing the difference between trending and ranging markets helps avoid applying unsuitable strategies. Indicators like MACD are often used alongside ADX to confirm both momentum and overall market structure.
Limitations of ADX
Although ADX is widely used, it is not without limitations. Understanding these constraints is essential for interpreting it correctly.
Lagging Nature
ADX is based on smoothed data, which means it reflects trends after they have already begun. This can delay signals, particularly at the early stages of a trend.
No Directional Output
On its own, ADX does not indicate whether a trend is upward or downward. It must be combined with +DI, -DI, or other indicators to provide directional context.
Sensitivity to Short-Term Volatility
In some cases, sudden bursts of volatility can cause ADX to rise temporarily, even if a stable trend is not forming. This can lead to misleading interpretations if viewed in isolation.
Variability Across Markets
Threshold values such as 20 or 25 are widely used, but they are not universal. Different assets, timeframes, and market conditions may require adjusted interpretations.
These limitations highlight the importance of using ADX as part of a broader analytical framework rather than relying on it alone.
Conclusion
The Average Directional Index (ADX) offers a structured way to evaluate the strength of trends in financial markets. By focusing solely on intensity rather than direction, it provides a distinct layer of insight that complements other technical indicators.
Its primary value lies in helping distinguish between meaningful trends and weaker, less reliable price movements. When used alongside directional tools such as +DI and -DI, or combined with broader indicators like MACD, ADX contributes to a more balanced and systematic understanding of market behavior.
Rather than predicting where prices will go, ADX helps clarify whether current market conditions support trend-based analysis.
FAQs
What does ADX measure?
ADX measures the strength of a price trend, without indicating its direction.
What ADX level indicates a strong trend?
An ADX value above 25 is commonly interpreted as indicating a strong trend.
Can ADX be used on its own?
It is generally more effective when used alongside other indicators that provide directional context.
Why is ADX considered a lagging indicator?
Because it relies on smoothed historical data, it reacts more slowly to recent price changes.
How does ADX differ from MACD?
ADX focuses on trend strength only, while MACD combines direction and momentum into a single indicator.