EMA 20 generally detects short-term trend changes and active swing-trading setups more quickly, whereas EMA 50 offers a smoother perspective on the broader market trend. The more suitable choice depends on whether a trader prioritizes responsiveness, trend stability, or confirmation across multiple time horizons.
You’ll see when EMA 20 offers an earlier entry cue, when EMA 50 does a better job of filtering noise, and when using both together gives a clearer trend read.
TL;DR
-
EMA 20 reacts faster to recent price changes, making it more suitable for short swing trades, pullback monitoring, and early trend detection.
-
EMA 50 responds more slowly but filters more short-term volatility, making it useful for assessing the broader swing-trading trend.
-
EMA 20 generates earlier signals but may produce more false signals during sideways or volatile markets.
-
EMA 50 provides stronger trend filtering but may confirm reversals after a significant part of the price move has occurred.
-
Many swing traders use EMA 20 and EMA 50 together rather than treating either moving average as a complete trading system.
| Feature |
EMA 20 |
EMA 50 |
| Main focus |
Short-term trend |
Medium-term trend |
| Price sensitivity |
Higher |
Lower |
| Signal timing |
Earlier |
Later |
| Market-noise filtering |
Lower |
Higher |
| Common swing-trading use |
Pullbacks and early changes |
Directional bias and confirmation |
| Main weakness |
Frequent false signals |
Greater signal delay |
| Best suited to |
Active swing traders |
More patient trend followers |
The central trade-off is speed versus stability. EMA 20 responds quickly enough to highlight developing moves, while EMA 50 sacrifices some speed to provide a steadier representation of market direction.
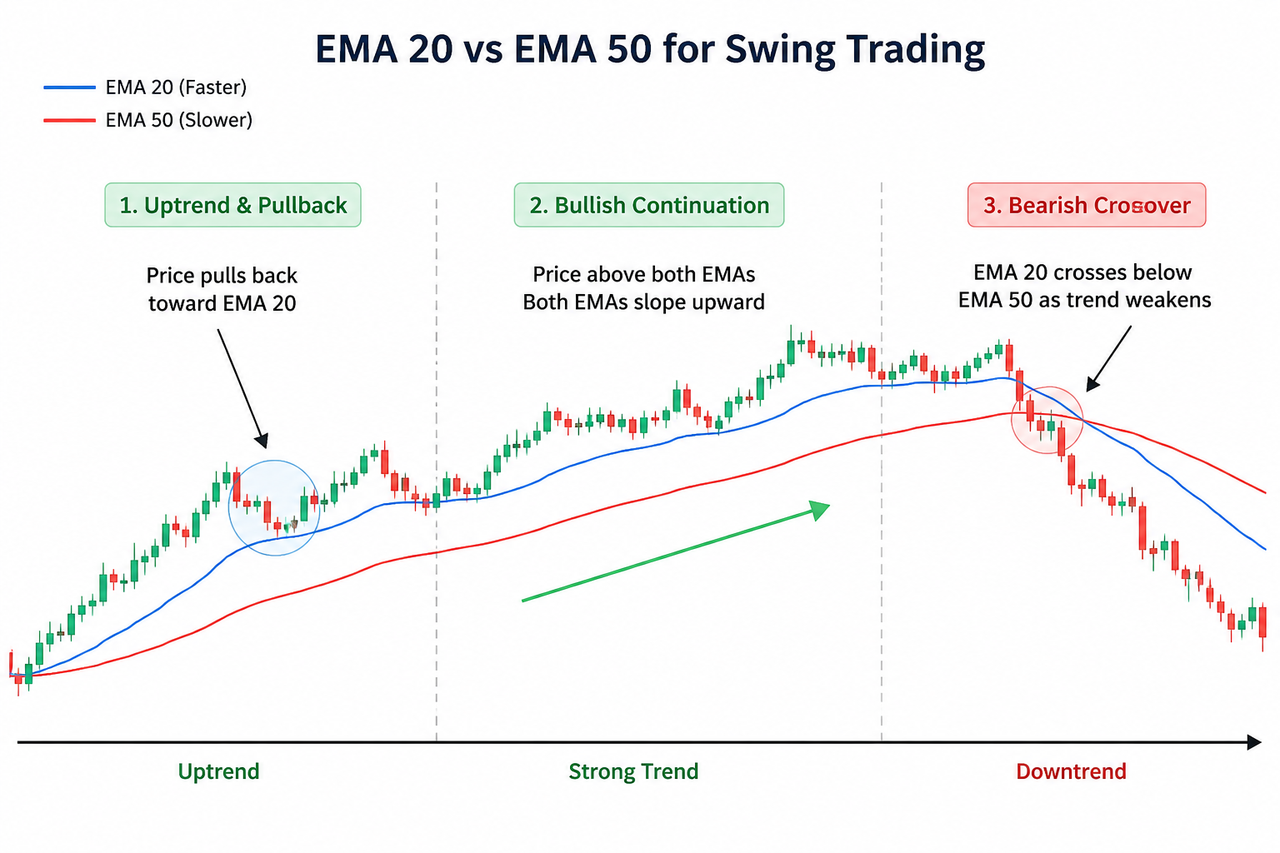
What Are EMA 20 and EMA 50 Exponential Moving Averages?
EMA 20 and EMA 50 are exponential moving averages calculated over the latest 20 and 50 chart periods. As an exponential moving average, each indicator gives greater weight to recent prices, but EMA 20 concentrates that weighting over a shorter lookback period and therefore responds faster.
The chart period determines the time represented. On a daily chart, EMA 20 covers approximately 20 daily candles, while EMA 50 uses 50 daily candles. On a four-hour chart, the same indicators use the latest 20 and 50 four-hour candles.
EMA 20 is commonly treated as a short-term trend reference. Its proximity to price makes it useful for observing recent momentum, shallow pullbacks, and early changes in direction. The standalone explanation of the EMA 20 indicator covers its calculation, slope, price interaction, and use as a dynamic area of interest.
EMA 50 represents a broader period and changes more gradually. The 50-day EMA filters out short-term noise and helps show clearer intermediate trends, which can help traders determine whether a short-term movement fits the prevailing swing-trading structure or merely reflects temporary volatility.
Neither average predicts the market. Both summarize historical price data, so every signal appears after price has already moved.
How Do EMA 20 and EMA 50 Differ?
EMA 20 is more responsive, while EMA 50 is more stable. That difference influences how each moving average behaves during breakouts, pullbacks, consolidation, and reversals.
Sensitivity of Moving Averages to Price Changes
EMA 20 follows current price more closely because recent candles carry more weight in a 20-period calculation than in a 50-period calculation. When momentum accelerates, EMA 20 usually changes slope first.
This responsiveness can be useful when a swing trader wants to recognize an emerging move before it becomes obvious on slower indicators. However, fast reactions also make EMA 20 more vulnerable to temporary price spikes and market noise.
EMA 50 changes direction more slowly. A single volatile candle has less influence on the broader calculation, so the line generally remains smoother. This can prevent overreaction to minor fluctuations, although it also delays confirmation when a genuine reversal develops.
Trend Direction
EMA 20 acts as a short term ema that describes the immediate trend more clearly, while EMA 50 serves as a long term ema and provides a broader directional filter.
A rising EMA 20 with price holding above it often indicates positive short-term momentum. A falling EMA 20 with price remaining below it commonly reflects bearish short-term conditions. These readings can change quickly when price becomes unstable.
EMA 50 helps place those conditions in context. When price, EMA 20, and EMA 50 are all rising in an orderly structure, the bullish trend has stronger alignment across short-term and medium-term periods. When EMA 20 rises but EMA 50 remains flat or falls, the move may represent only a temporary rebound within a weaker structure.
Signal Timing
EMA 20 normally produces the earlier signal. EMA 50 normally provides the more delayed confirmation.
Entry timing is one reason traders choose EMA 20 for earlier setups and EMA 50 for later confirmation.
An early signal is not automatically a better signal. It offers more potential exposure to the beginning of a move, but the probability of reacting to an unsuccessful breakout or short-lived reversal may also increase.
A delayed signal may miss the earliest part of a trend, yet it can reduce the temptation to respond to every minor change. The preferred balance depends on the trader’s holding period, risk tolerance, chart timeframe, and need for confirmation.
EMA 20 vs. 50 EMA for Swing-Trading Pullbacks
EMA 20 is generally more useful for monitoring shallow pullbacks, while EMA 50 may become relevant during deeper corrections.
In a strong uptrend, price may repeatedly retreat toward EMA 20 before continuing higher. The 20-day EMA can also act as dynamic support or resistance during pullbacks. Swing traders sometimes observe whether the pullback slows near the average and whether the broader pattern of higher highs and higher lows remains intact.
A touch of EMA 20 is not an automatic entry signal. Price can cross the average without ending the trend, remain below it during an extended correction, or move repeatedly through it during consolidation.
Some traders use RSI to confirm pullback entries, watch for oversold conditions, and decide when to enter.
EMA 50 can act as a secondary reference when price moves decisively below EMA 20. A pullback toward EMA 50 may still remain consistent with a broader bullish structure when EMA 50 is rising and important support has not broken. However, a deeper pullback also indicates that short-term momentum has weakened.
The following framework helps separate different conditions:
| Price and EMA Structure |
Possible Interpretation |
Main Limitation |
| Price above rising EMA 20 and EMA 50 |
Bullish trend alignment |
Trend may already be extended |
| Price pulls back to EMA 20 while EMA 50 rises |
Shallow correction within an uptrend |
EMA 20 may not hold as support |
| Price falls below EMA 20 but remains above rising EMA 50 |
Deeper correction or slowing momentum |
Trend deterioration may continue |
| Price below falling EMA 20 and EMA 50 |
Bearish trend alignment |
Selling after a large decline may be late |
| Both averages flatten and price crosses repeatedly |
Sideways or uncertain conditions |
Frequent false signals are likely |
Price structure remains more important than whether a candle touches a moving average. Support and resistance, swing highs and lows, volatility, volume, and the strength of the underlying trend can change the meaning of the same EMA interaction.
How Do EMA 20 and EMA 50 Crossovers Work?
An EMA crossover occurs when EMA 20 moves above or below EMA 50. The crossover shows that short-term average price behavior has shifted relative to the medium-term trend.
A bullish crossover occurs when EMA 20 rises above EMA 50. This suggests that recent prices are strengthening faster than the broader average. A bearish crossover occurs when EMA 20 falls below EMA 50, and that move is commonly treated as a sell signal because recent price performance has weakened.
Crossovers can help confirm a transition, but they are delayed by construction. Price often begins reversing before the averages intersect. By the time a crossover appears, the market may have already completed a meaningful portion of the move. Traders should not implement crossover signals mechanically without checking structure.
Crossovers are particularly unreliable when both averages are flat and tightly compressed. EMA 20 may cross EMA 50 several times as price moves sideways, producing a sequence of contradictory signals.
The distance and slope of the averages provide more context than the crossover alone:
-
A bullish crossover with both averages turning upward is more meaningful than a crossover between flat lines.
-
Increasing separation may indicate that directional momentum is expanding.
-
Narrowing separation can show that momentum is weakening before a crossover occurs.
-
A crossover against the broader market structure deserves greater caution.
-
Crossover-based alerts are more useful when they reflect slope and separation, not just the cross itself.
Which EMA Is Better for Swing Trading?
EMA 20 is better for responsiveness, while EMA 50 is better for broader trend filtering in a simple comparison of responsiveness versus filtering. Neither indicator is universally better for every swing-trading setup.
EMA 20 may be more suitable when:
-
the intended trade lasts several candles rather than several weeks;
-
the trader wants to monitor shallow pullbacks;
-
early momentum changes matter;
-
price is already moving in a clear trend;
-
faster signals fit the trader’s risk-management process.
EMA 50 may be more suitable when:
-
the trader wants to filter short-term volatility;
-
the broader market direction matters more than exact timing;
-
deeper pullbacks are being evaluated;
-
the strategy requires stronger trend confirmation;
-
the trader accepts later signals in exchange for greater stability.
Using both may be more suitable when:
-
short-term timing must align with the broader trend;
-
the trader wants to distinguish a pullback from a structural reversal;
-
trend direction, slope, separation, and crossovers are evaluated together;
-
neither moving average is being treated as an independent entry command.
A practical approach is to use EMA 50 as the directional filter and EMA 20 as the active trend reference. This means applying EMA 50 to define direction and EMA 20 as the active reference for timing. Some traders also use the EMA 200 as a market-regime filter before applying EMA 20 and EMA 50 for swing setups. For example, a swing trader may focus on bullish setups while EMA 50 rises, then use price interaction with EMA 20 to evaluate whether short-term momentum is recovering after a pullback.
This method does not guarantee a successful trade. It simply assigns different analytical roles to each average. That makes the framework easy to understand for beginners because each EMA has a distinct role.
How Can Traders Confirm EMA Signals?
EMA signals become more useful when used by combining them with other technical indicators that measure a different market characteristic, rather than relying on them alone.
The ADX indicator can help determine whether a directional move has sufficient trend strength. Rising EMAs in a weak or non-trending market may not provide the same conditions as rising EMAs during an expanding trend.
The MACD indicator adds information about momentum and the relationship between faster and slower exponential averages. Combining EMAs with MACD can improve trade selection accuracy, although MACD and EMA 20 or EMA 50 are mathematically related, so agreement should not be mistaken for completely independent confirmation. Traders often use these indicators in conjunction with EMAs as part of broader analyses.
A SuperTrend indicator introduces volatility through Average True Range. Price above SuperTrend while EMA 20 and EMA 50 rise may reinforce a bullish interpretation, although all three tools remain lagging indicators.
For trade management, the Parabolic SAR indicator can provide a trailing reference during an established move. A Parabolic SAR flip may warn of weakening momentum before the slower EMA structure fully reverses. Gate Learn describes Parabolic SAR dots as appearing below price during bullish conditions and above price during bearish conditions.
Combining multiple confirmation tools can help reduce false signals.
Confirmation should reduce dependence on one signal, not create an overcrowded chart. Indicators that measure the same underlying price behavior can appear to provide several confirmations while repeating similar information.
What Are the Main Limitations of EMA 20 and EMA 50?
The main limitation of both indicators is that they lag behind price. These lag and whipsaw issues are inherent risks of EMA-based trading. EMA 20 reduces that delay but becomes more sensitive to noise, while EMA 50 improves smoothing at the cost of slower recognition.
Traders should understand these limits before they conduct live trading decisions.
Other limitations include:
-
Sideways-market signals: Price can cross both averages repeatedly without establishing a sustainable trend.
-
Sudden volatility: News, liquidations, or abrupt changes in market sentiment can make previous EMA structures irrelevant.
-
False support assumptions: A moving average is a calculated reference, not a guaranteed support or resistance level.
-
Timeframe inconsistency: A bullish structure on a one-hour chart may exist inside a bearish daily trend.
-
Parameter dependence: The numbers 20 and 50 are conventions rather than universal settings suited to every asset.
-
Execution risk: Slippage, fees, liquidity, and stop placement affect real results even when the trend interpretation is correct.
These are common cases where flat or choppy conditions can make both EMAs unreliable.
Technical indicators cannot eliminate market risk. EMA 20 and EMA 50 should support a structured process involving position sizing, predefined invalidation levels, and an assessment of broader market conditions.
Conclusion
EMA 20 is generally better for active swing traders who value early trend information and short-term pullback signals. EMA 50 is better for traders who prioritize a smoother directional filter and are willing to accept later confirmation.
The strongest EMA 20 vs. EMA 50 framework gives each average a separate role. EMA 50 defines the broader trend, while EMA 20 tracks immediate momentum and pullback behavior. Price structure, trend strength, volatility, and risk controls should determine whether the combined signal is actionable.
FAQs
Is 20 EMA or EMA 50 more accurate?
Neither EMA 20 nor EMA 50 is consistently more accurate in every market. EMA 20 reacts faster but produces more noise, while EMA 50 filters more volatility but confirms changes later. Accuracy depends on the asset, timeframe, market structure, and rules used to validate the signal.
Can EMA 20 and EMA 50 be used together?
EMA 20 and EMA 50 can be used together to compare short-term momentum with the broader trend. Traders may monitor price relative to both averages, their slopes, the distance between them, and potential crossovers. Agreement improves context but does not guarantee that the trend will continue. At the same time, many traders use EMA 20 and EMA 50 together rather than relying on a single signal.
What does it mean when EMA 20 crosses EMA 50?
An EMA 20 crossover above EMA 50 indicates that recent price behavior is strengthening relative to the medium-term average. A crossover below EMA 50 is typically read as a sell signal, showing that short-term momentum is weakening against the medium-term trend. EMA crossovers are lagging signals, not leading ones. The signal is more meaningful when both averages have clear slopes and price structure supports the same direction.
Which timeframe works best with EMA 20 and EMA 50?
EMA 20 and EMA 50 can be used on daily, four-hour, hourly, or other charts, but the selected timeframe should match the intended holding period. Swing traders commonly analyze a higher timeframe for overall direction and a lower timeframe for setup timing. No timeframe removes false signals.
Is EMA 20 and EMA 50 a complete trading strategy?
EMA 20 and EMA 50 do not form a complete strategy by themselves. A complete process also requires entry criteria, invalidation rules, position sizing, exit planning, and controls for volatility and liquidity. Moving averages describe historical price behavior rather than predicting certain outcomes.







