


#我的Gate交易时刻 June 23 Morning BTC/ETH Deep Dive: The Battle of the Middle Bollinger Band, a Watershed Moment for Bulls and Bears
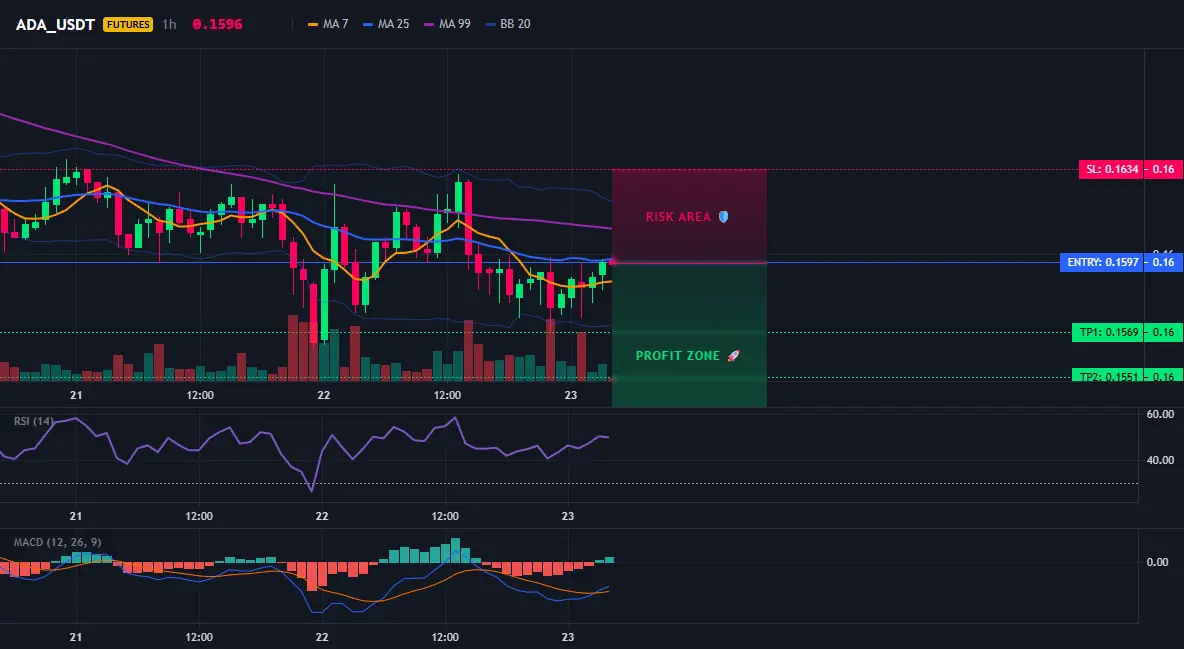
On the morning of June 23, Bitcoin and Ethereum both retreated from the upper Bollinger Band toward the middle band for consolidation. The three Bollinger bands' upward momentum has clearly slowed, with the upper band turning flat, indicating a tightening of the upward channel. The middle band has shifted from short-term support to a key dividing line between bulls and bears. Once effectively broken below, the downside space will fully open up.
1. Technical Analysis: Bollinger Bands Contracting, Momentum Fading
Bitcoin (BTC): The 64,500 USD Level as a Critical Support Line
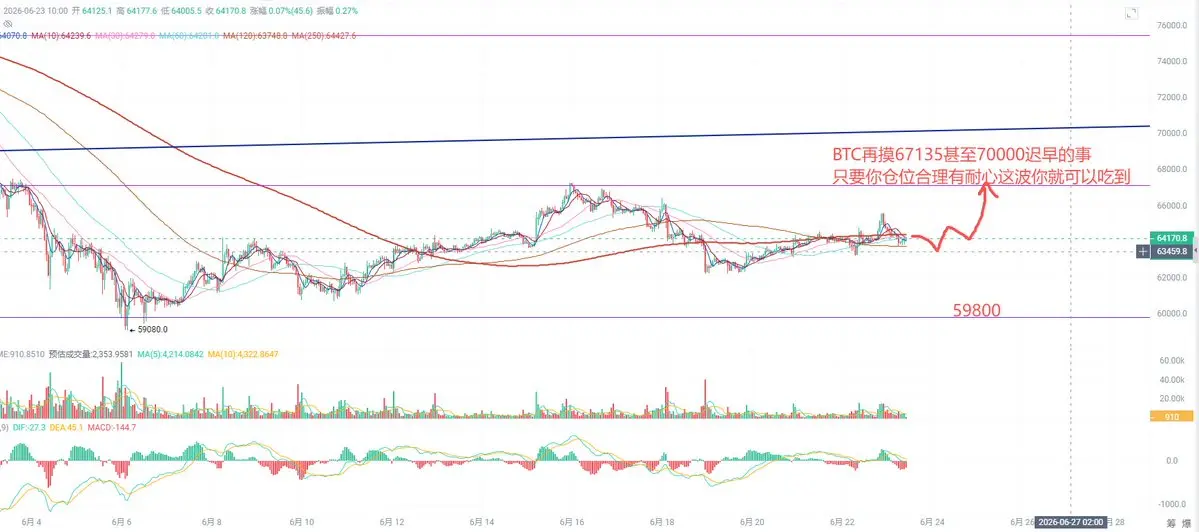
From the daily chart, Bitcoin previously relied on the strong push from the upper Bollinger Band, but recently failed to sustain the breakout, pulling back from highs to hover near the middle band. This signals a very important message: the support role of the middle band is weakening, gradually evolving into a dividing line in the bulls and bears contest. The slope of the three Bollinger bands has significantly slowed, with the upper band showing signs of flattening, indicating the previously smooth upward channel is contracting.
According to classic technical analysis, when the price falls back from the upper band to the middle band, if the middle band is lost, the lower band becomes the next target. Currently, Bitcoin’s middle band is roughly around $64,000–$64,200. Once it is broken and confirmed, the downside space will be fully unlocked, with $63,000 or even lower becoming the main target for bears.
More notably, this correction is accompanied by gradually shrinking volume, indicating that buyers have not organized an effective counterattack at key levels. Volume contraction during declines often suggests the trend is not over, and the market is still searching for a new equilibrium.
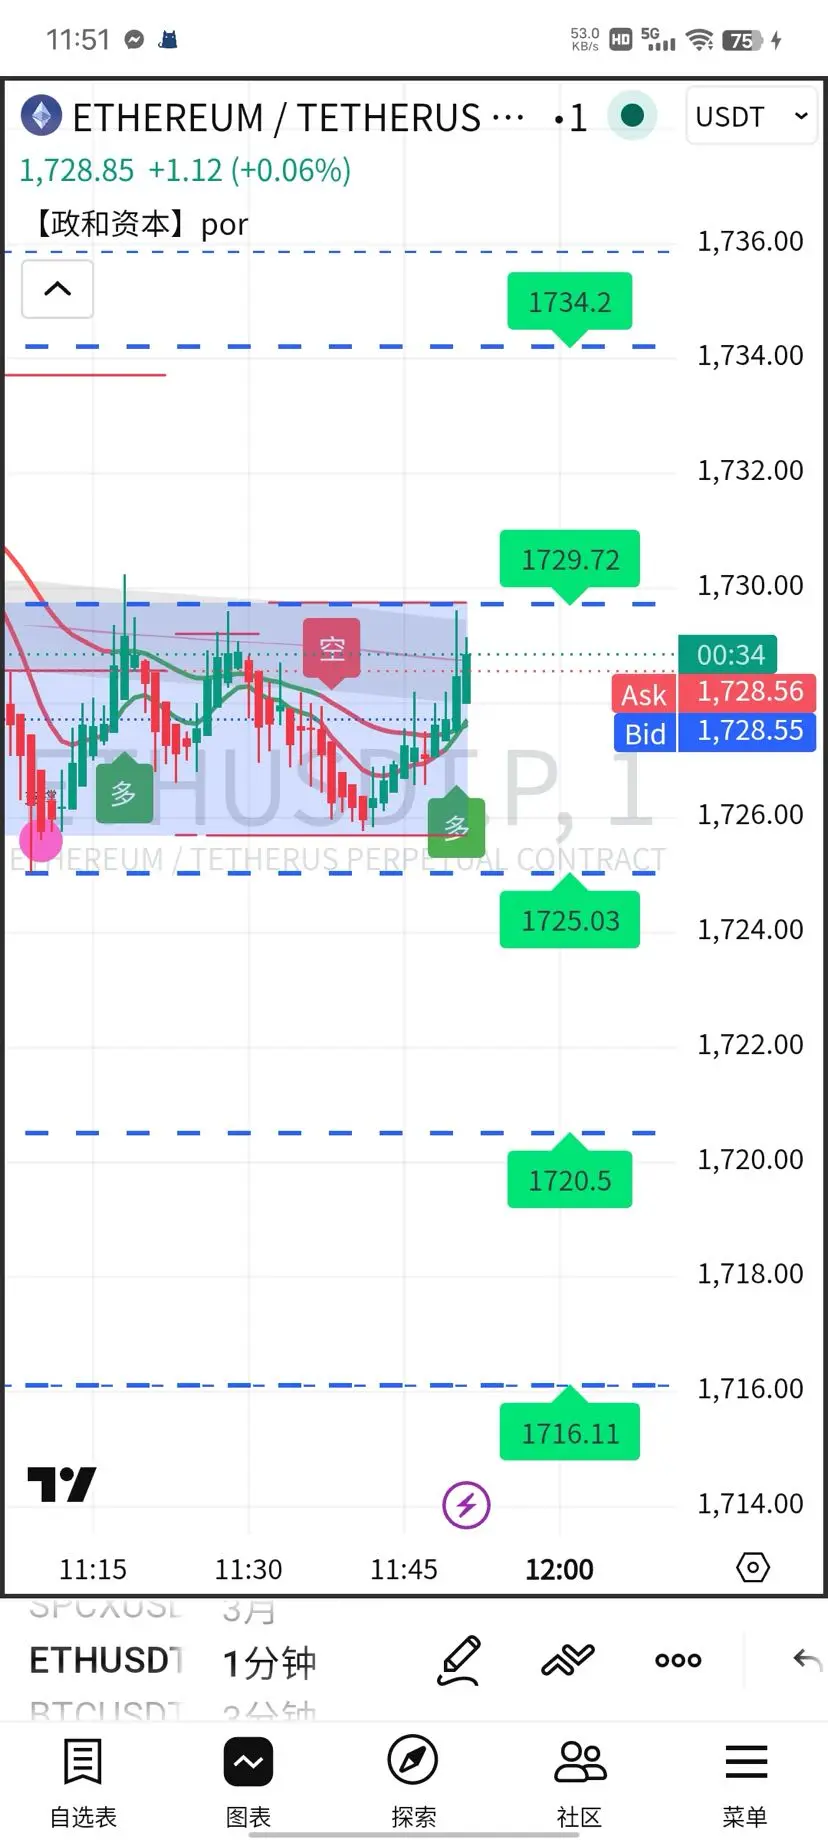
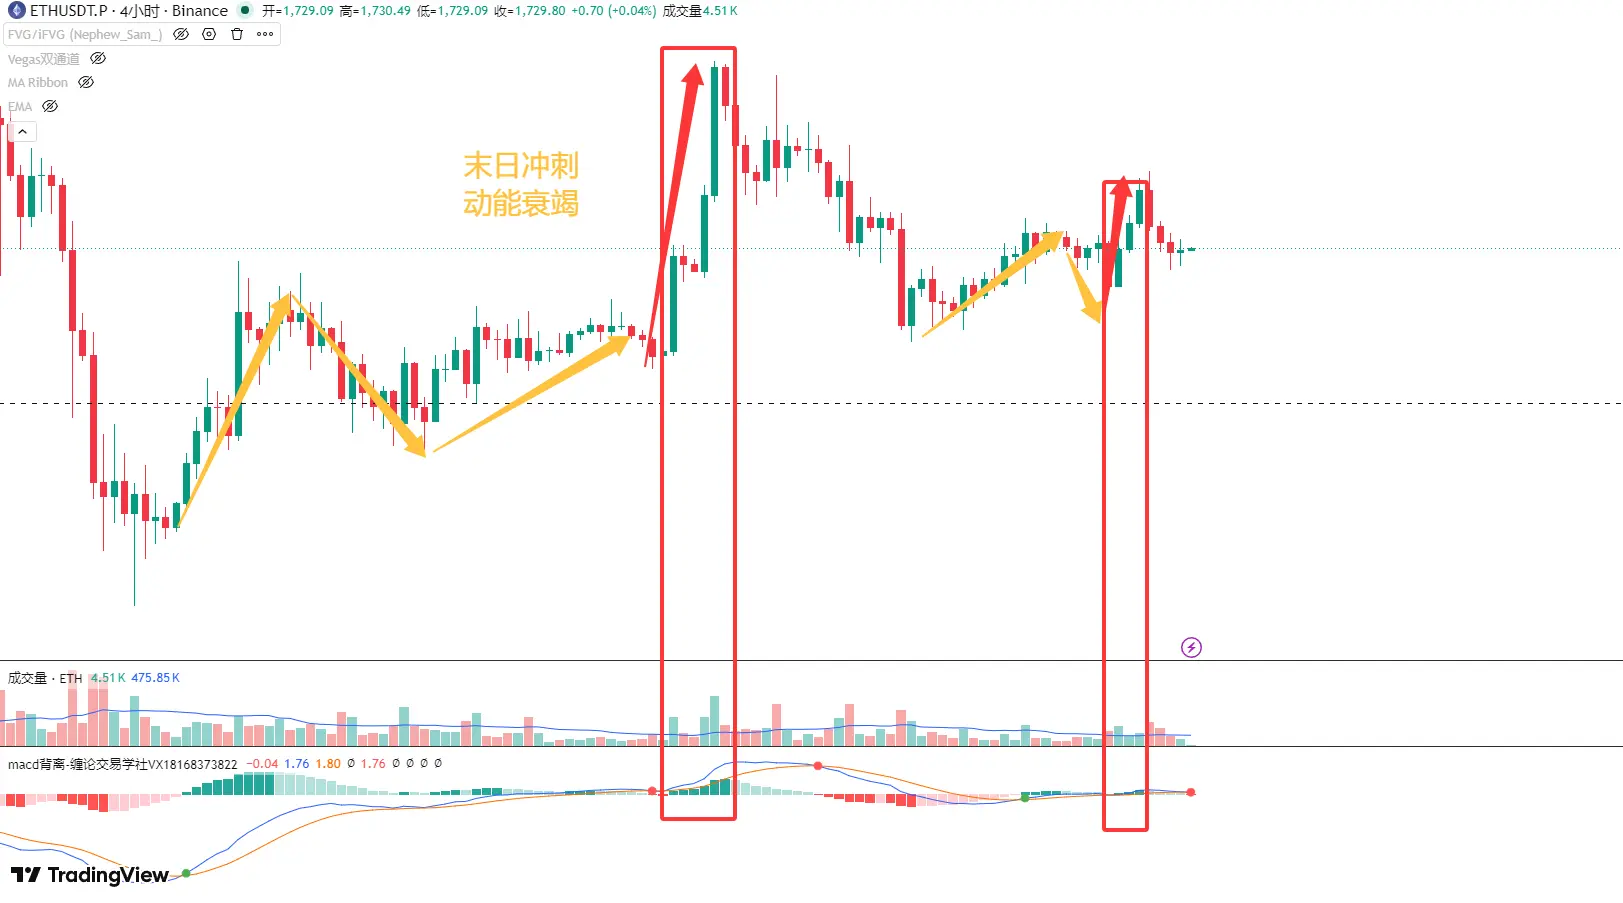
Ethereum (ETH): Support at $1,740 Under Pressure
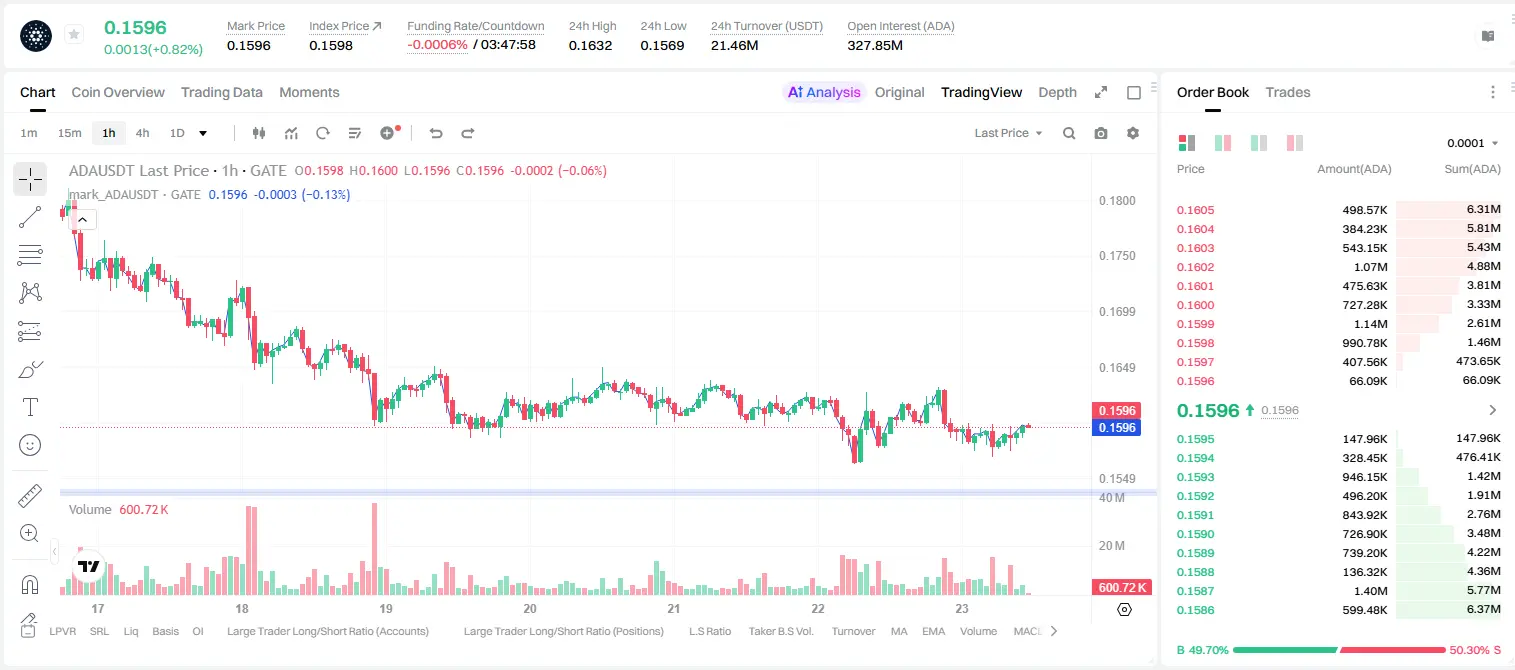
Ethereum’s technical pattern is highly synchronized with Bitcoin but exhibits more volatility. ETH also retreated from the upper Bollinger Band and is currently battling between $1,740 and $1,720 (near the middle band). From the ETH/BTC ratio, Ethereum has been weakening relative to Bitcoin recently, with ETH/BTC dropping to around 0.027, reflecting a trend of capital shifting from Ethereum to Bitcoin. This "blood-sucking" pattern is common during bear markets or corrections and further weakens Ethereum’s rebound momentum.
The key psychological level at $1,700 for Ethereum is under threat; once lost, the $1,680 level and even lower prices will face direct testing. Similar to Bitcoin, ETH’s Bollinger Bands are also converging into a three-band squeeze, with clear signs of momentum exhaustion.
2. Capital Flows: ETF Outflows Persist, Institutional Caution
Recent capital flows in spot crypto ETFs provide important signals of "smart money." Latest data shows that BTC and ETH ETFs experienced significant net outflows in mid-June, with daily net outflows reaching hundreds of millions of dollars at times. This ongoing institutional capital exodus reflects risk-averse behavior among large investors amid increasing macro uncertainties.
Notably, Bitcoin ETFs tend to see larger outflows than Ethereum, partly explaining why ETH/BTC remains under pressure—institutions prefer to reduce holdings of the more volatile Ethereum assets.
From the futures market, Bitcoin’s funding rate has recently turned negative, indicating rising bearish sentiment. The perpetual contract market’s long-short ratio also favors bears, with leveraged positions aligned with the overall cautious market sentiment.
3. Macro and News Sentiment: Bulls and Bears Intertwined, High Uncertainty
Federal Reserve Policy: The Rate Path Remains the Biggest Variable
The Fed’s interest rate trajectory in 2026 continues to be a core macro factor influencing the crypto market. The market generally expects the Fed to maintain a cautious rate cut pace within the year, but there are significant disagreements on the timing of policy shifts. The Fed’s rate control mechanism still operates with the "three-piece set": the Interest on Reserve Balances (IORB) as the main tool, Overnight Reverse Repurchase Agreements (ON RRP) as the rate floor, and Standing Repo Facility (SRP) as the rate ceiling. In December 2025, the FOMC removed the $500 billion daily limit on SRP, allowing banks to borrow from the Fed with unlimited government bond collateral, which has continued to inject liquidity into the system into the first half of 2026, supporting risk assets.
However, the market is more focused on whether the Fed will adjust its stance amid persistent inflation data and slowing economic growth. Any marginal change in rate expectations could trigger sharp volatility in the crypto markets.
Geopolitical Risks: Persistent Risk-Off Sentiment
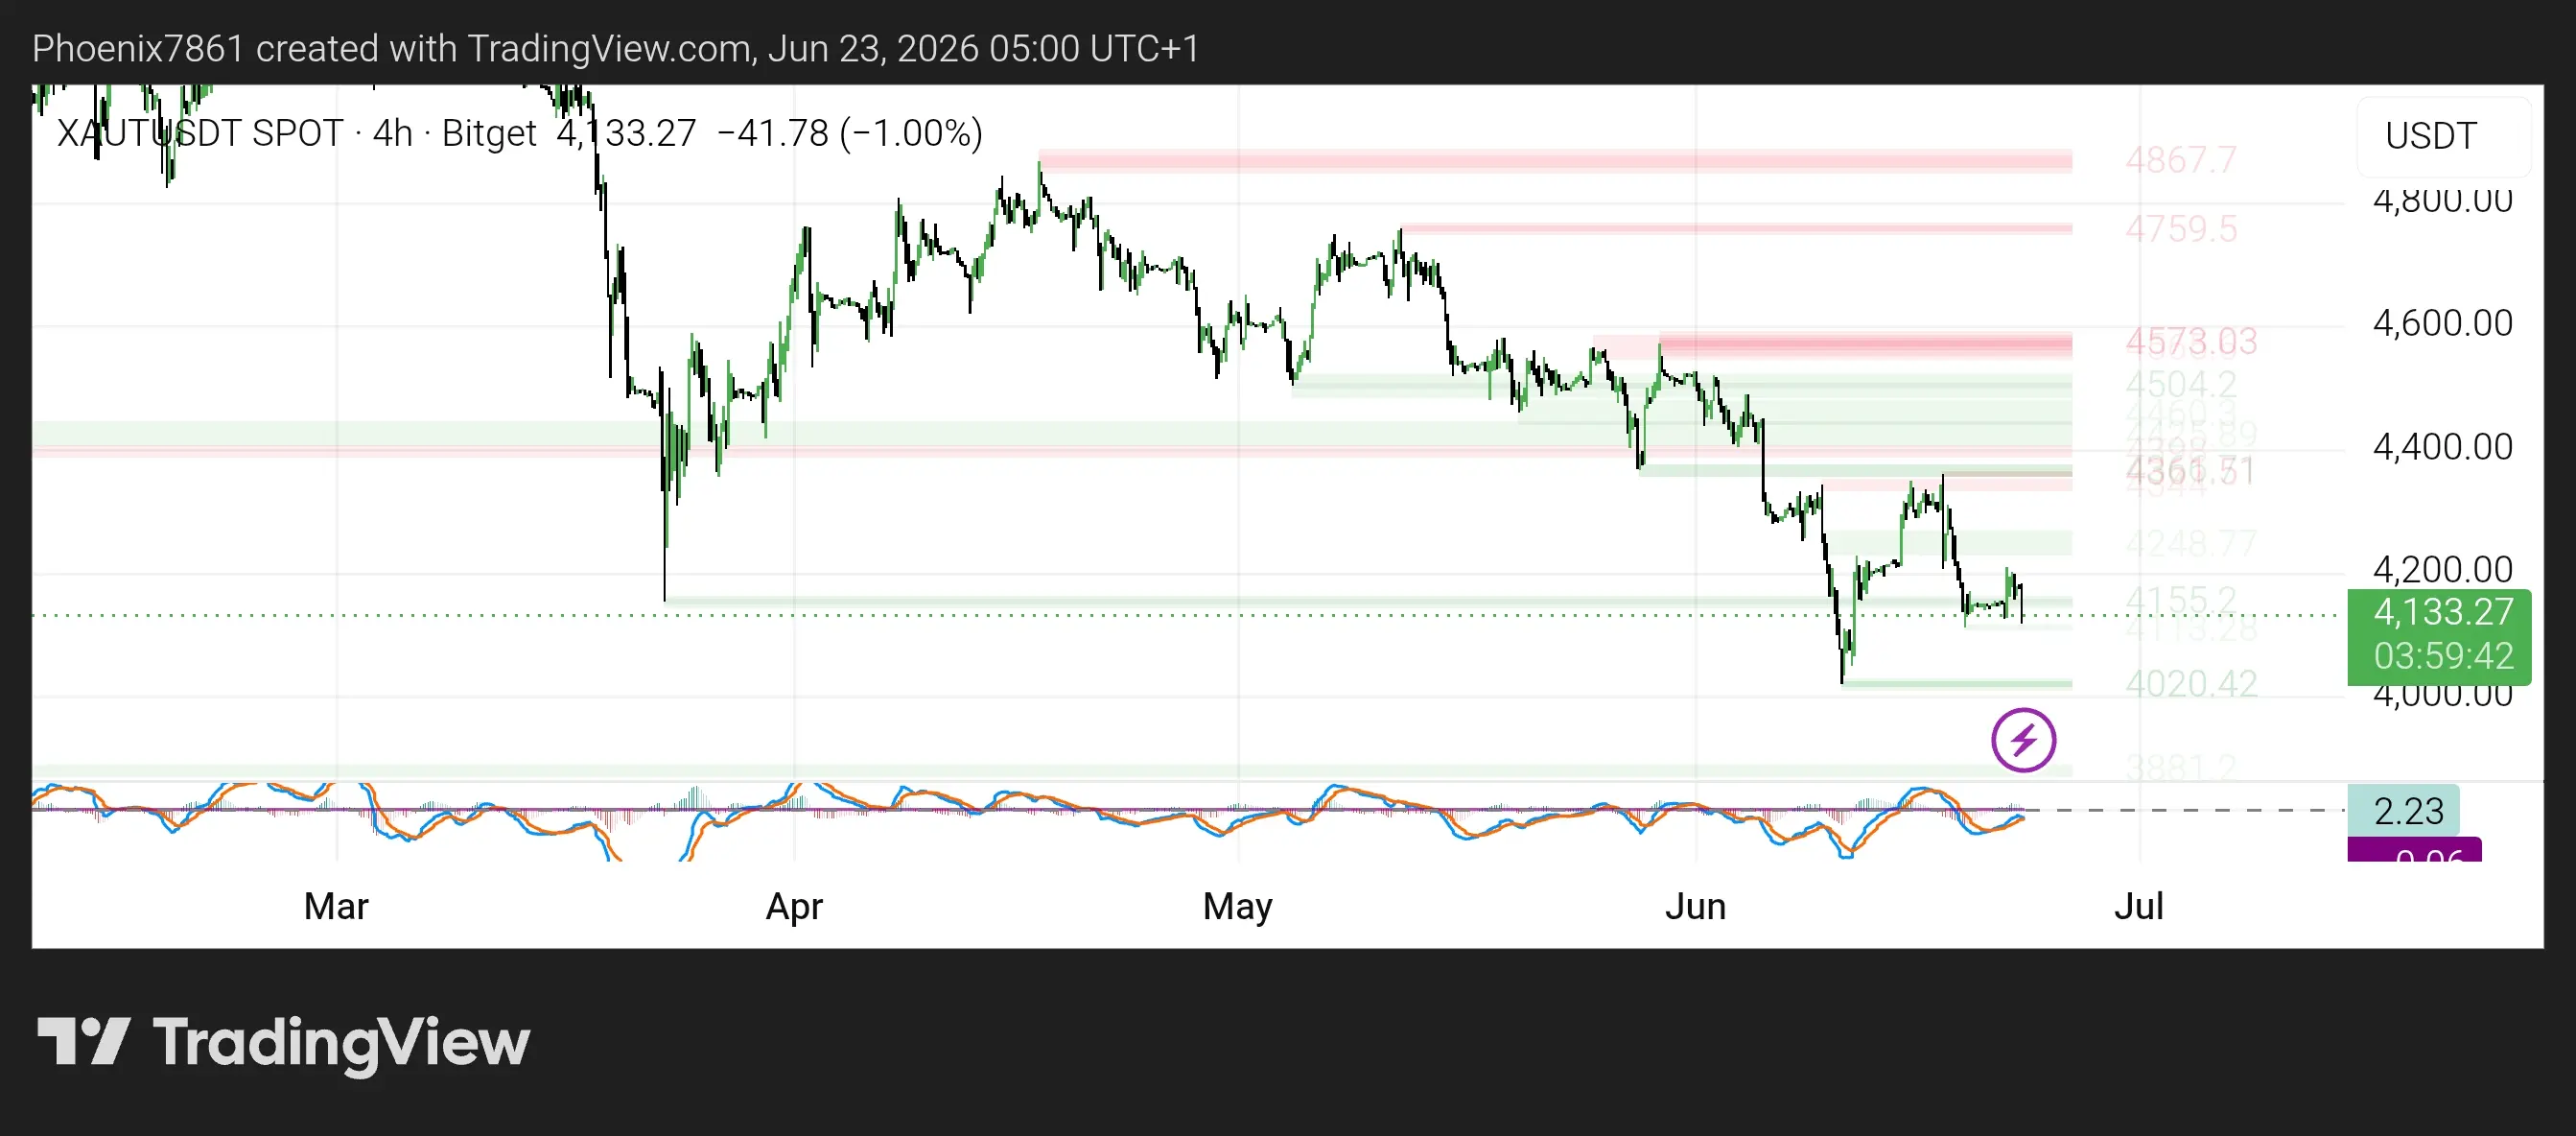
Since June, global geopolitical tensions remain complex. While some regional tensions have eased, new uncertainties continue to emerge. News of the deepening crisis in Japan’s bond market and yields reaching levels not seen since 1999 have sounded alarms for global risk assets. In such an environment of high geopolitical and macro uncertainty, gold remains a favored safe haven, while the narrative of cryptocurrencies as "digital gold" has yet to be fully established. This divergence partly explains the recent decoupling of gold and Bitcoin movements.
Regulatory Developments: Long-term Positive, Short-term Neutral
The Trump administration’s promise to swiftly pass the crypto market structure bill aims to reinforce US leadership in the global crypto space. In the long run, clear legislative pathways are key to large-scale institutional inflows and will significantly improve industry policy expectations. However, regulatory benefits take time to materialize and are unlikely to provide immediate price boosts. Currently, markets focus more on ETF capital flows, on-chain data, and macro sentiment.
4. Trading Strategies: Follow the Trend, Manage Risks Strictly
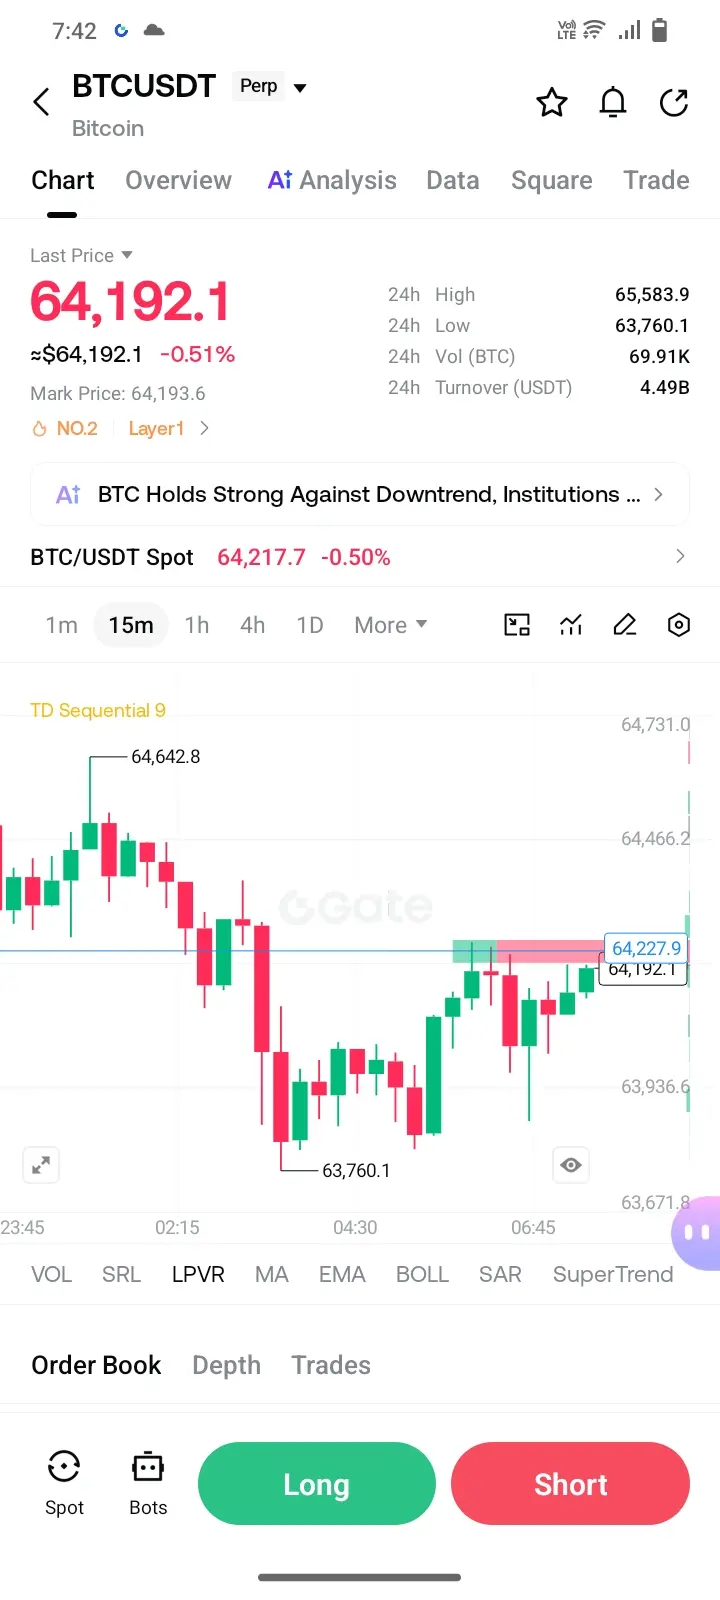
Bitcoin (BTC): Currently trading between $64,500 and $64,200, Bitcoin faces a critical decision point. From both technical and capital flow perspectives, bears hold some advantage but no clear breakdown signal has yet emerged.
Short-term strategy: If the price shows signs of stagnation or weakening rebound near $64,500–$64,200, consider light short positions with stops above $64,800–$65,000. The first target is $63,000, the second is around $62,000. Emphasize that the $64,000 middle band is a watershed; a confirmed close below this level (daily close below) will fully open the downside space. Conversely, if support holds and volume rebounds, a challenge to the upper Bollinger Band could be possible.
Ethereum (ETH): With higher volatility and more extreme risk-reward profile than Bitcoin, ETH also faces the middle band test at $1,740–$1,720.
Short-term strategy: If the price faces resistance near $1,740–$1,720, consider light short positions with stops at $1,760–$1,780. The first target is $1,680, the second around $1,650. Be cautious: on-chain data shows that large wallets holding 100–1,000 ETH have recently exhibited clear selling tendencies, with the Distribution indicator rising, adding downward pressure in the short term.
Position Management and Risk Control
Regardless of long or short, managing position size is crucial in the current environment. It is recommended that individual trades do not exceed 10% of total capital, with strict stop-losses. The narrowing of Bollinger Bands often signals an impending trend change, as the market awaits a catalyst—possibly hawkish comments from Fed officials or a sudden reversal in ETF flows.
5. Conclusion: Awaiting Direction, Patience Is Key
As of the morning of June 23, Bitcoin and Ethereum are at a critical technical crossroads. The middle Bollinger Band has shifted from support to a dividing line, with the three bands converging and the upward channel tightening, signaling an imminent major directional decision.
From capital flows, ETF outflows persist and institutional caution remains; macro factors include uncertain Fed policy and geopolitical risks; technically, volume contraction and momentum exhaustion are evident. Multiple factors suggest bears currently have a slight advantage in the short term. However, crypto markets are known for high volatility and unpredictability. Any sudden news can quickly reverse sentiment. Therefore, patience, strict risk management, and waiting for clear break signals may be the most rational approach at this stage. The market will not stay in turbulence forever; a trend will eventually emerge. When the Bollinger Bands open again and volume increases, a genuine trend will follow.
This article is for technical analysis and market opinion sharing only and does not constitute any investment advice.
On the morning of June 23, Bitcoin and Ethereum both retreated from the upper Bollinger Band toward the middle band for consolidation. The three Bollinger bands' upward momentum has clearly slowed, with the upper band turning flat, indicating a tightening of the upward channel. The middle band has shifted from short-term support to a key dividing line between bulls and bears. Once effectively broken below, the downside space will fully open up.
1. Technical Analysis: Bollinger Bands Contracting, Momentum Fading
Bitcoin (BTC): The 64,500 USD Level as a Critical Support Line
From the daily chart, Bitcoin previously relied on the strong push from the upper Bollinger Band, but recently failed to sustain the breakout, pulling back from highs to hover near the middle band. This signals a very important message: the support role of the middle band is weakening, gradually evolving into a dividing line in the bulls and bears contest. The slope of the three Bollinger bands has significantly slowed, with the upper band showing signs of flattening, indicating the previously smooth upward channel is contracting.
According to classic technical analysis, when the price falls back from the upper band to the middle band, if the middle band is lost, the lower band becomes the next target. Currently, Bitcoin’s middle band is roughly around $64,000–$64,200. Once it is broken and confirmed, the downside space will be fully unlocked, with $63,000 or even lower becoming the main target for bears.
More notably, this correction is accompanied by gradually shrinking volume, indicating that buyers have not organized an effective counterattack at key levels. Volume contraction during declines often suggests the trend is not over, and the market is still searching for a new equilibrium.
Ethereum (ETH): Support at $1,740 Under Pressure
Ethereum’s technical pattern is highly synchronized with Bitcoin but exhibits more volatility. ETH also retreated from the upper Bollinger Band and is currently battling between $1,740 and $1,720 (near the middle band). From the ETH/BTC ratio, Ethereum has been weakening relative to Bitcoin recently, with ETH/BTC dropping to around 0.027, reflecting a trend of capital shifting from Ethereum to Bitcoin. This "blood-sucking" pattern is common during bear markets or corrections and further weakens Ethereum’s rebound momentum.
The key psychological level at $1,700 for Ethereum is under threat; once lost, the $1,680 level and even lower prices will face direct testing. Similar to Bitcoin, ETH’s Bollinger Bands are also converging into a three-band squeeze, with clear signs of momentum exhaustion.
2. Capital Flows: ETF Outflows Persist, Institutional Caution
Recent capital flows in spot crypto ETFs provide important signals of "smart money." Latest data shows that BTC and ETH ETFs experienced significant net outflows in mid-June, with daily net outflows reaching hundreds of millions of dollars at times. This ongoing institutional capital exodus reflects risk-averse behavior among large investors amid increasing macro uncertainties.
Notably, Bitcoin ETFs tend to see larger outflows than Ethereum, partly explaining why ETH/BTC remains under pressure—institutions prefer to reduce holdings of the more volatile Ethereum assets.
From the futures market, Bitcoin’s funding rate has recently turned negative, indicating rising bearish sentiment. The perpetual contract market’s long-short ratio also favors bears, with leveraged positions aligned with the overall cautious market sentiment.
3. Macro and News Sentiment: Bulls and Bears Intertwined, High Uncertainty
Federal Reserve Policy: The Rate Path Remains the Biggest Variable
The Fed’s interest rate trajectory in 2026 continues to be a core macro factor influencing the crypto market. The market generally expects the Fed to maintain a cautious rate cut pace within the year, but there are significant disagreements on the timing of policy shifts. The Fed’s rate control mechanism still operates with the "three-piece set": the Interest on Reserve Balances (IORB) as the main tool, Overnight Reverse Repurchase Agreements (ON RRP) as the rate floor, and Standing Repo Facility (SRP) as the rate ceiling. In December 2025, the FOMC removed the $500 billion daily limit on SRP, allowing banks to borrow from the Fed with unlimited government bond collateral, which has continued to inject liquidity into the system into the first half of 2026, supporting risk assets.
However, the market is more focused on whether the Fed will adjust its stance amid persistent inflation data and slowing economic growth. Any marginal change in rate expectations could trigger sharp volatility in the crypto markets.
Geopolitical Risks: Persistent Risk-Off Sentiment
Since June, global geopolitical tensions remain complex. While some regional tensions have eased, new uncertainties continue to emerge. News of the deepening crisis in Japan’s bond market and yields reaching levels not seen since 1999 have sounded alarms for global risk assets. In such an environment of high geopolitical and macro uncertainty, gold remains a favored safe haven, while the narrative of cryptocurrencies as "digital gold" has yet to be fully established. This divergence partly explains the recent decoupling of gold and Bitcoin movements.
Regulatory Developments: Long-term Positive, Short-term Neutral
The Trump administration’s promise to swiftly pass the crypto market structure bill aims to reinforce US leadership in the global crypto space. In the long run, clear legislative pathways are key to large-scale institutional inflows and will significantly improve industry policy expectations. However, regulatory benefits take time to materialize and are unlikely to provide immediate price boosts. Currently, markets focus more on ETF capital flows, on-chain data, and macro sentiment.
4. Trading Strategies: Follow the Trend, Manage Risks Strictly
Bitcoin (BTC): Currently trading between $64,500 and $64,200, Bitcoin faces a critical decision point. From both technical and capital flow perspectives, bears hold some advantage but no clear breakdown signal has yet emerged.
Short-term strategy: If the price shows signs of stagnation or weakening rebound near $64,500–$64,200, consider light short positions with stops above $64,800–$65,000. The first target is $63,000, the second is around $62,000. Emphasize that the $64,000 middle band is a watershed; a confirmed close below this level (daily close below) will fully open the downside space. Conversely, if support holds and volume rebounds, a challenge to the upper Bollinger Band could be possible.
Ethereum (ETH): With higher volatility and more extreme risk-reward profile than Bitcoin, ETH also faces the middle band test at $1,740–$1,720.
Short-term strategy: If the price faces resistance near $1,740–$1,720, consider light short positions with stops at $1,760–$1,780. The first target is $1,680, the second around $1,650. Be cautious: on-chain data shows that large wallets holding 100–1,000 ETH have recently exhibited clear selling tendencies, with the Distribution indicator rising, adding downward pressure in the short term.
Position Management and Risk Control
Regardless of long or short, managing position size is crucial in the current environment. It is recommended that individual trades do not exceed 10% of total capital, with strict stop-losses. The narrowing of Bollinger Bands often signals an impending trend change, as the market awaits a catalyst—possibly hawkish comments from Fed officials or a sudden reversal in ETF flows.
5. Conclusion: Awaiting Direction, Patience Is Key
As of the morning of June 23, Bitcoin and Ethereum are at a critical technical crossroads. The middle Bollinger Band has shifted from support to a dividing line, with the three bands converging and the upward channel tightening, signaling an imminent major directional decision.
From capital flows, ETF outflows persist and institutional caution remains; macro factors include uncertain Fed policy and geopolitical risks; technically, volume contraction and momentum exhaustion are evident. Multiple factors suggest bears currently have a slight advantage in the short term. However, crypto markets are known for high volatility and unpredictability. Any sudden news can quickly reverse sentiment. Therefore, patience, strict risk management, and waiting for clear break signals may be the most rational approach at this stage. The market will not stay in turbulence forever; a trend will eventually emerge. When the Bollinger Bands open again and volume increases, a genuine trend will follow.
This article is for technical analysis and market opinion sharing only and does not constitute any investment advice.