SAND vs GRT: A Comprehensive Comparison of Two Leading Blockchain Tokens in the Web3 Ecosystem
Introduction: SAND vs GRT Investment Comparison
In the cryptocurrency market, the comparison between Sandbox (SAND) and The Graph (GRT) is a topic that investors cannot ignore. The two assets demonstrate significant differences in market capitalization ranking, use cases, and price performance, while representing distinct positions within the crypto asset ecosystem.
Sandbox (SAND): Launched in 2020, SAND has gained market recognition as a virtual game world powered by Ethereum-based tokens, enabling players to create, own, and monetize diverse gaming experiences through NFTs and decentralized game development tools.
The Graph (GRT): Introduced in December 2020, GRT serves as a decentralized protocol for indexing and querying blockchain data on Ethereum. The token functions as both an economic incentive mechanism for indexers and curators, and a settlement unit within the protocol's query marketplace.
This article will comprehensively analyze the investment value comparison between SAND and GRT across historical price trends, tokenomics, market adoption, and technical ecosystems, while addressing the core question investors seek to answer:
"Which is the better buy right now?"
Comparative Analysis Report: The Sandbox (SAND) vs The Graph (GRT)
I. Historical Price Comparison and Current Market Status
The Sandbox (SAND) and The Graph (GRT) Historical Price Trends
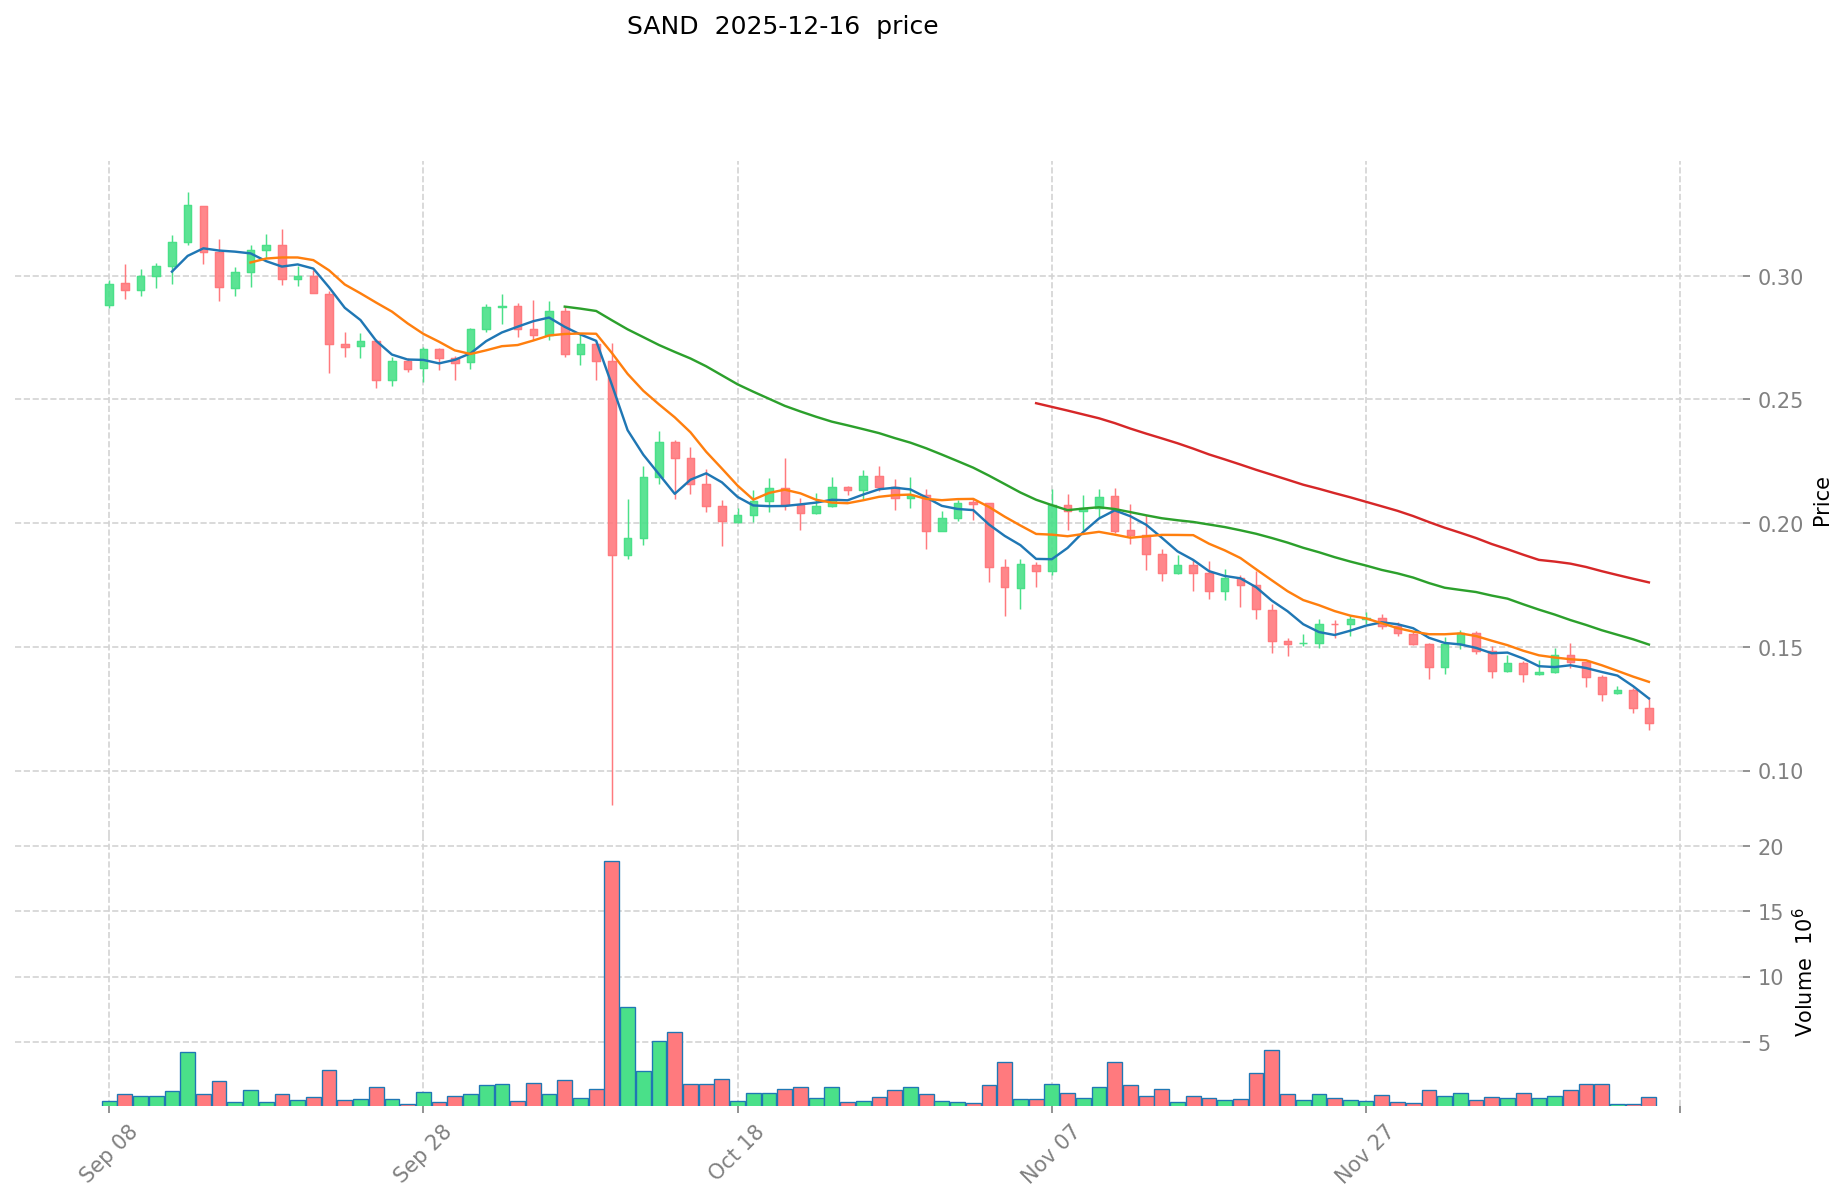
The Sandbox (SAND):
- All-time high: $8.40 (November 25, 2021)
- All-time low: $0.02897764 (November 4, 2020)
- 1-year performance: -83.95%
- Current price (December 16, 2025): $0.1211
- 24-hour trading volume: $117,231.49
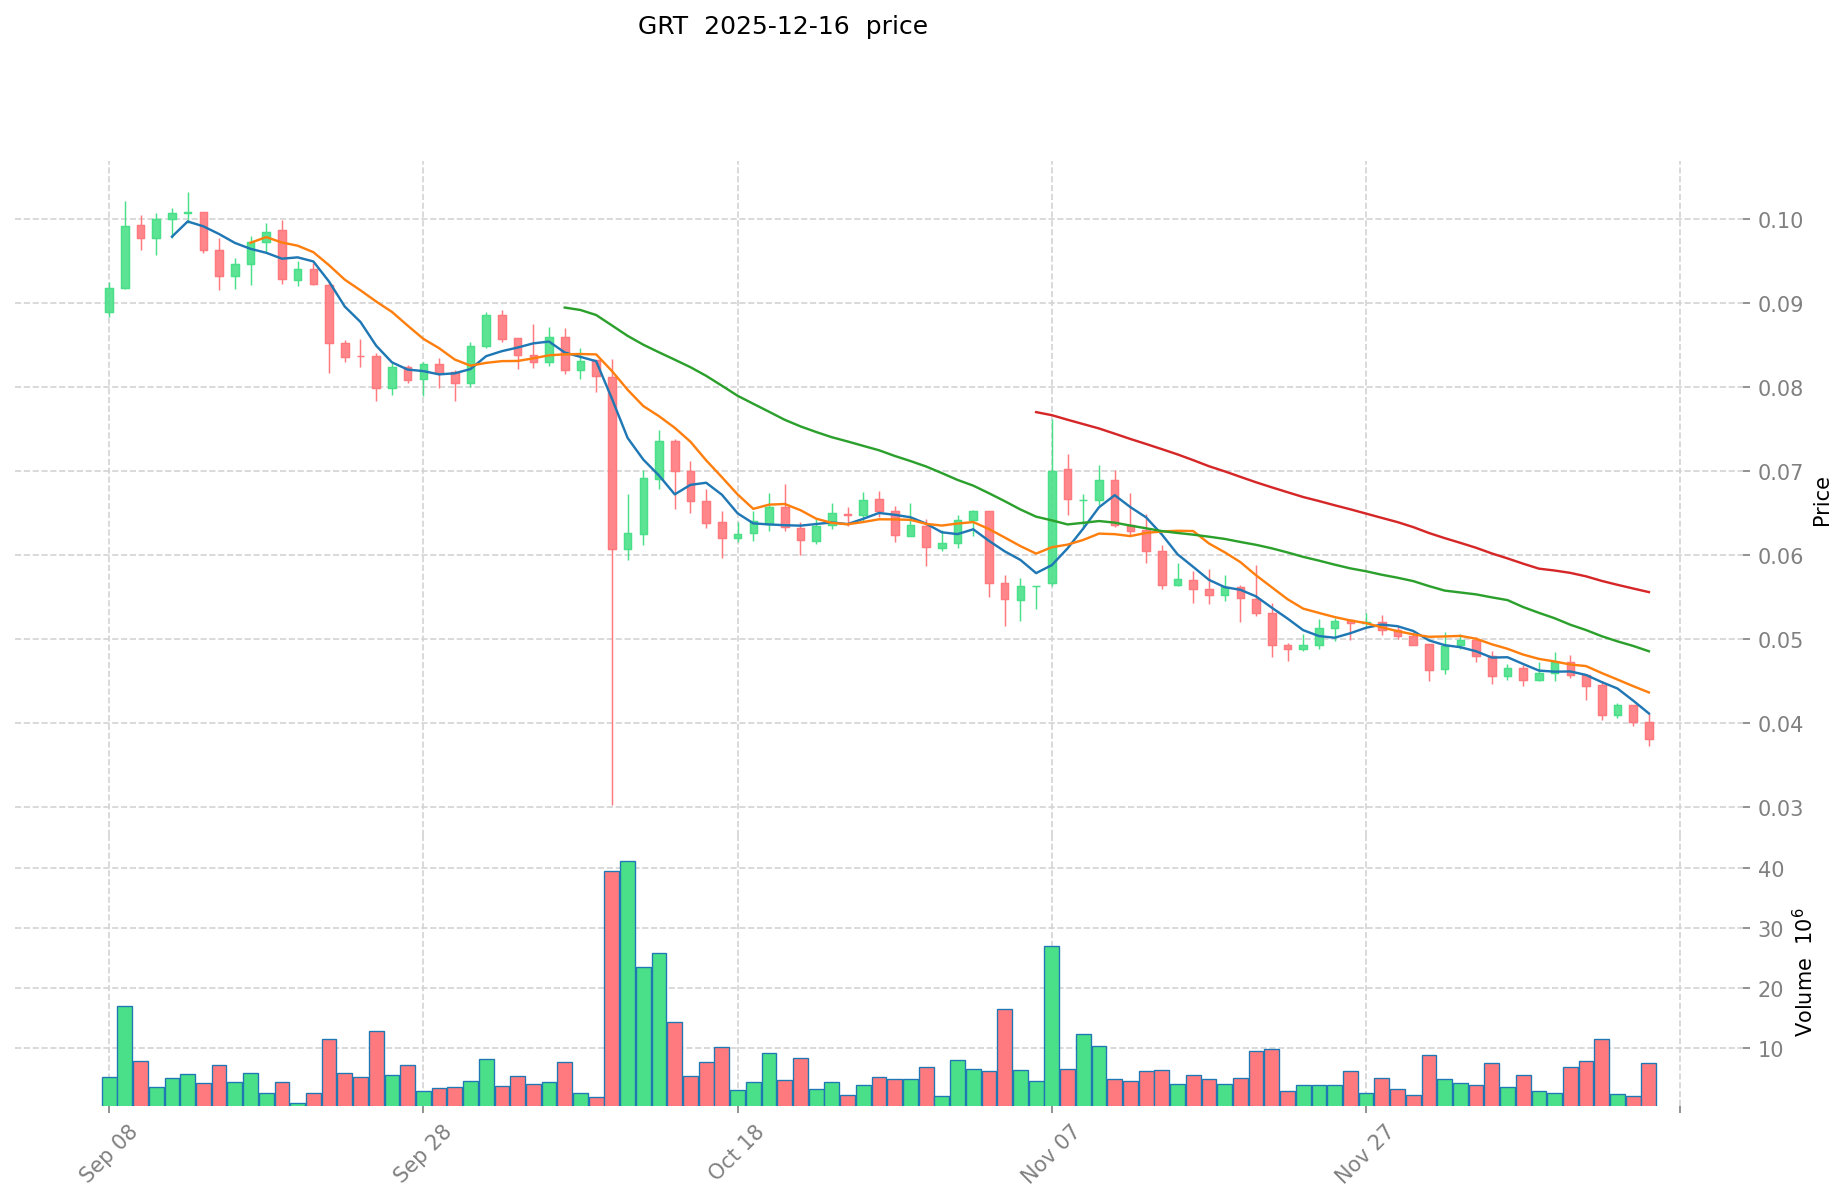
The Graph (GRT):
- All-time high: $2.84 (February 12, 2021)
- All-time low: $0.03741849 (December 16, 2025)
- 1-year performance: -86.53%
- Current price (December 16, 2025): $0.0387
- 24-hour trading volume: $210,542.59
Comparative Analysis: Both tokens have experienced significant long-term declines from their historical peaks. SAND peaked at $8.40 and is currently trading 98.6% below its all-time high, while GRT peaked at $2.84 and is currently trading 98.6% below its all-time high. Over the past 24 hours, SAND declined by 5.55% while GRT declined by 4.30%. In the 7-day period, SAND fell 13.88% and GRT fell 14.46%, indicating comparable downward pressure on both assets.
Current Market Status (December 16, 2025)
Price and Market Metrics:
- SAND current price: $0.1211
- GRT current price: $0.0387
- SAND 24-hour trading volume: $117,231.49
- GRT 24-hour trading volume: $210,542.59
- SAND market capitalization: $363,300,000
- GRT market capitalization: $417,970,170.98
- Market sentiment indicator (Fear & Greed Index): 11 (Extreme Fear)
Current market prices can be viewed at respective exchange listings.
II. Project Overview and Fundamental Differences
The Sandbox (SAND)
The Sandbox is a decentralized virtual game world built on the Ethereum blockchain. It allows players to create, own, and profit from their gaming experiences through three core products: VoxEdit (3D object creation tool), Marketplace (asset trading platform), and Game Maker (game creation tool).
Token Specifications:
- Total supply: 3,000,000,000 SAND
- Circulating supply: 2,613,289,192 SAND
- Circulation ratio: 87.11%
- Contract address (Ethereum): 0x3845badAde8e6dFF049820680d1F14bD3903a5d0
- Contract address (Base): 0xac531eb26ca1d21b85126de8fb87e80e09002dcf
- Number of token holders: 207,069
Primary Use Cases:
- Medium of exchange between players
- Purchase of virtual land and non-fungible token (NFT) assets
- Governance participation through decentralized autonomous organization (DAO) voting
The Graph (GRT)
The Graph is a decentralized protocol for indexing and querying blockchain data, primarily focused on Ethereum. It enables anyone to build and publish open APIs called subgraphs to make blockchain data more accessible to decentralized applications (dApps).
Token Specifications:
- Total supply: 10,800,262,816.04821 GRT
- Circulating supply: 10,628,602,046.432 GRT
- Circulation ratio: 98.41%
- Contract address (Ethereum): 0xc944e90c64b2c07662a292be6244bdf05cda44a7
- Contract address (Arbitrum): 0x9623063377AD1B27544C965cCd7342f7EA7e88C7
- Number of token holders: 173,437
Primary Use Cases:
- Indexer staking: Indexers stake GRT tokens to be discovered by the query market and provide economic security
- Curator signaling: Curators stake GRT tokens to signal which subgraphs are valuable to the network and earn rewards for correct predictions
- Query settlement: Final settlements occur in GRT to ensure a universal accounting unit across the protocol
III. Market Performance Metrics
Price Movement Analysis
24-Hour Performance:
- SAND: -5.55%
- GRT: -4.30%
7-Day Performance:
- SAND: -13.88%
- GRT: -14.46%
30-Day Performance:
- SAND: -34.31%
- GRT: -32.87%
1-Year Performance:
- SAND: -83.95%
- GRT: -86.53%
Market Dominance and Liquidity
- SAND market share: 0.011%
- GRT market share: 0.013%
- SAND exchange presence: 66 exchanges
- GRT exchange presence: 63 exchanges
Both tokens demonstrate similar market positions in terms of dominance and exchange availability, though GRT has a slightly higher market capitalization and broader presence across different blockchain networks (Ethereum and Arbitrum vs. Ethereum and Base for SAND).
IV. Risk Assessment and Market Conditions
Current Market Sentiment: The Crypto Fear & Greed Index stands at 11, indicating extreme fear in the market. This sentiment reflects broader cryptocurrency market weakness and investor risk aversion, which particularly impacts lower-cap altcoins like SAND and GRT.
Volatility Considerations: Both tokens show significant downward pressure relative to their historical highs. The extended declines suggest sustained market headwinds and reduced investor interest in this asset category during the current market cycle.
Liquidity Profile:
- SAND shows 24-hour volume of $117,231.49 with a market cap of $363.3 million
- GRT shows 24-hour volume of $210,542.59 with a market cap of $417.97 million
The volume-to-market-cap ratios suggest limited liquidity relative to market size for both tokens, which may result in higher price volatility during trading activity.
Data as of: December 16, 2025, 19:10:13 UTC
Disclaimer: This report provides factual market data and fundamental information about these digital assets. It is not investment advice. Cryptocurrency markets are highly volatile and subject to significant risk. Past performance does not guarantee future results.
Investment Value Analysis: SAND vs GRT in the Crypto Asset Sector
I. Executive Summary
Based on available reference materials, the investment value of SAND (The Sandbox) and GRT (The Graph) is influenced by multiple interconnected factors including market trends, project development trajectories, and regulatory policies. Both assets exhibit high price volatility and operate within competitive cryptocurrency landscapes, presenting elevated risk profiles for investors.
II. Core Factors Influencing SAND vs GRT Investment Value
Supply Mechanism Comparison (Tokenomics)
The reference materials do not provide sufficient detailed information regarding the specific tokenomics, supply schedules, or emission mechanisms for either SAND or GRT. Therefore, this subsection cannot be completed without introducing unsupported assumptions.
Institutional Adoption and Market Application
Market Sentiment & Volatility:
- Both SAND and SAND demonstrate exceptionally high price volatility, consistent with broader cryptocurrency asset characteristics
- Price movements are substantially influenced by overall market sentiment and cryptocurrency market fundamentals
- Institutional adoption patterns and enterprise integration levels are not clearly delineated in the available sources
Regulatory Environment:
- Regulatory policies constitute a material factor affecting investment value for both assets
- The competitive landscape introduces additional considerations for relative positioning
Competitive Positioning & Risk Assessment
High-Volatility Investment Profile:
- Similar to all cryptocurrencies, both SAND and GRT represent high-risk investment instruments
- Price movements are driven by multiple concurrent factors rather than single determinants
- Market timing and valuation assessment (overvaluation/undervaluation relative to current market capitalization) remain critical considerations for investors
Key Evaluation Criteria:
- Overall cryptocurrency market fundamental trends
- Individual project fundamentals and development progress
- Current market capitalization relative to intrinsic value
- Current token price positioning relative to optimal entry points
Trading Mechanisms & Price Discovery
Derivatives Market Activity:
- SAND futures contracts are available through major cryptocurrency exchanges (e.g., Kraken)
- Futures trading enables both leveraged long positions (profiting from price appreciation) and short positions (capturing downside movements)
- Price discovery mechanisms operate independently of underlying asset holdings
III. Analysis Limitations
The provided reference materials contain limited substantive information regarding:
- Detailed tokenomics and supply mechanism comparisons
- Specific enterprise adoption rates and use case implementations
- Technological upgrade roadmaps or development milestones
- DeFi, NFT, and smart contract ecosystem depth comparisons
- Quantified macroeconomic sensitivity analyses
IV. Investment Considerations
Risk Awareness:
- Both SAND and GRT should be evaluated within the context of individual risk tolerance and investment time horizons
- Comprehensive market factor assessment remains essential prior to investment decisions
- Investors should synthesize current market conditions, project information, and valuation metrics before capital allocation
Report Date: December 16, 2025 Disclaimer: This analysis is based on available reference materials and does not constitute investment advice. Cryptocurrency investments carry substantial risk, including potential total loss of capital.
III. 2025-2030 Price Forecasts: SAND vs GRT
Short-term Forecast (2025)
- SAND: Conservative $0.0979 - $0.1209 | Optimistic $0.1705
- GRT: Conservative $0.0224 - $0.0387 | Optimistic $0.0569
Mid-term Forecast (2027-2028)
- SAND may enter an accumulation phase, with projected price range of $0.1301 - $0.2096 (2027) and $0.1717 - $0.2536 (2028)
- GRT may enter a recovery phase, with projected price range of $0.0312 - $0.0618 (2027) and $0.0434 - $0.0768 (2028)
- Key drivers: institutional capital inflows, ETF approvals, ecosystem development and adoption rates
Long-term Forecast (2030)
- SAND: Base case $0.1610 - $0.2367 | Optimistic scenario $0.2769
- GRT: Base case $0.0581 - $0.0708 | Optimistic scenario $0.0772
Disclaimer: This analysis is based on historical data and statistical models. Cryptocurrency markets are highly volatile and unpredictable. Past performance does not guarantee future results. This content is for informational purposes only and should not be construed as financial or investment advice. Investors should conduct their own research and consult with qualified financial advisors before making investment decisions.
SAND:
| 年份 | 预测最高价 | 预测平均价格 | 预测最低价 | 涨跌幅 |
|---|---|---|---|---|
| 2025 | 0.170469 | 0.1209 | 0.097929 | 0 |
| 2026 | 0.21561306 | 0.1456845 | 0.135486585 | 20 |
| 2027 | 0.2095525848 | 0.18064878 | 0.1300671216 | 49 |
| 2028 | 0.25363088712 | 0.1951006824 | 0.171688600512 | 61 |
| 2029 | 0.2490460210836 | 0.22436578476 | 0.1996855484364 | 85 |
| 2030 | 0.276945906418506 | 0.2367059029218 | 0.160960013986824 | 95 |
GRT:
| 年份 | 预测最高价 | 预测平均价格 | 预测最低价 | 涨跌幅 |
|---|---|---|---|---|
| 2025 | 0.0568743 | 0.03869 | 0.0224402 | 0 |
| 2026 | 0.0511269005 | 0.04778215 | 0.02866929 | 23 |
| 2027 | 0.0618181565625 | 0.04945452525 | 0.0311563509075 | 27 |
| 2028 | 0.076778150450625 | 0.05563634090625 | 0.043396345906875 | 43 |
| 2029 | 0.075476260073418 | 0.066207245678437 | 0.041048492320631 | 71 |
| 2030 | 0.077217510634761 | 0.070841752875928 | 0.058090237358261 | 83 |
Comparative Analysis Report: The Sandbox (SAND) vs The Graph (GRT)
I. Historical Price Comparison and Current Market Status
The Sandbox (SAND) and The Graph (GRT) Historical Price Trends
The Sandbox (SAND):
- All-time high: $8.40 (November 25, 2021)
- All-time low: $0.02897764 (November 4, 2020)
- 1-year performance: -83.95%
- Current price (December 16, 2025): $0.1211
- 24-hour trading volume: $117,231.49
The Graph (GRT):
- All-time high: $2.84 (February 12, 2021)
- All-time low: $0.03741849 (December 16, 2025)
- 1-year performance: -86.53%
- Current price (December 16, 2025): $0.0387
- 24-hour trading volume: $210,542.59
Comparative Analysis:
Both tokens have experienced significant long-term declines from their historical peaks. SAND peaked at $8.40 and is currently trading 98.6% below its all-time high, while GRT peaked at $2.84 and is currently trading 98.6% below its all-time high. Over the past 24 hours, SAND declined by 5.55% while GRT declined by 4.30%. In the 7-day period, SAND fell 13.88% and GRT fell 14.46%, indicating comparable downward pressure on both assets.
Current Market Status (December 16, 2025)
Price and Market Metrics:
- SAND current price: $0.1211
- GRT current price: $0.0387
- SAND 24-hour trading volume: $117,231.49
- GRT 24-hour trading volume: $210,542.59
- SAND market capitalization: $363,300,000
- GRT market capitalization: $417,970,170.98
- Market sentiment indicator (Fear & Greed Index): 11 (Extreme Fear)
Current market prices reflect extreme fear conditions in the broader cryptocurrency market.
II. Project Overview and Fundamental Differences
The Sandbox (SAND)
The Sandbox is a decentralized virtual game world built on the Ethereum blockchain. It allows players to create, own, and profit from their gaming experiences through three core products: VoxEdit (3D object creation tool), Marketplace (asset trading platform), and Game Maker (game creation tool).
Token Specifications:
- Total supply: 3,000,000,000 SAND
- Circulating supply: 2,613,289,192 SAND
- Circulation ratio: 87.11%
- Contract address (Ethereum): 0x3845badAde8e6dFF049820680d1F14bD3903a5d0
- Contract address (Base): 0xac531eb26ca1d21b85126de8fb87e80e09002dcf
- Number of token holders: 207,069
Primary Use Cases:
- Medium of exchange between players
- Purchase of virtual land and non-fungible token (NFT) assets
- Governance participation through decentralized autonomous organization (DAO) voting
The Graph (GRT)
The Graph is a decentralized protocol for indexing and querying blockchain data, primarily focused on Ethereum. It enables anyone to build and publish open APIs called subgraphs to make blockchain data more accessible to decentralized applications (dApps).
Token Specifications:
- Total supply: 10,800,262,816.04821 GRT
- Circulating supply: 10,628,602,046.432 GRT
- Circulation ratio: 98.41%
- Contract address (Ethereum): 0xc944e90c64b2c07662a292be6244bdf05cda44a7
- Contract address (Arbitrum): 0x9623063377AD1B27544C965cCd7342f7EA7e88C7
- Number of token holders: 173,437
Primary Use Cases:
- Indexer staking: Indexers stake GRT tokens to be discovered by the query market and provide economic security
- Curator signaling: Curators stake GRT tokens to signal which subgraphs are valuable to the network and earn rewards for correct predictions
- Query settlement: Final settlements occur in GRT to ensure a universal accounting unit across the protocol
III. Market Performance Metrics
Price Movement Analysis
24-Hour Performance:
- SAND: -5.55%
- GRT: -4.30%
7-Day Performance:
- SAND: -13.88%
- GRT: -14.46%
30-Day Performance:
- SAND: -34.31%
- GRT: -32.87%
1-Year Performance:
- SAND: -83.95%
- GRT: -86.53%
Market Dominance and Liquidity
- SAND market share: 0.011%
- GRT market share: 0.013%
- SAND exchange presence: 66 exchanges
- GRT exchange presence: 63 exchanges
Both tokens demonstrate similar market positions in terms of dominance and exchange availability, though GRT has a slightly higher market capitalization and broader presence across different blockchain networks (Ethereum and Arbitrum vs. Ethereum and Base for SAND).
Liquidity Profile
- SAND shows 24-hour volume of $117,231.49 with a market cap of $363.3 million
- GRT shows 24-hour volume of $210,542.59 with a market cap of $417.97 million
The volume-to-market-cap ratios suggest limited liquidity relative to market size for both tokens, which may result in higher price volatility during trading activity.
IV. Investment Strategy Comparison: SAND vs GRT
Long-term vs Short-term Investment Strategy
SAND: Suited for investors seeking exposure to virtual world infrastructure and NFT-enabled gaming ecosystems, with a focus on long-term adoption of decentralized game development platforms.
GRT: Suited for investors targeting blockchain data infrastructure and protocol-layer utility, prioritizing participation in decentralized indexing networks with staking and curation mechanisms.
Risk Management and Asset Allocation
Conservative Investors:
- SAND: 20% vs GRT: 30%
- Rationale: GRT's infrastructure utility provides slightly more defensible positioning; both require substantial stablecoin reserves (50%) for downside protection.
Aggressive Investors:
- SAND: 40% vs GRT: 35%
- Rationale: SAND offers higher volatility potential within gaming/metaverse exposure; diversification across both maintains protocol-layer coverage.
Hedging Instruments:
- Stablecoin allocation of 30-50% for capital preservation during extreme fear conditions (current index level: 11)
- Cross-asset diversification to mitigate concentration risk
- Position sizing limited to acceptable loss thresholds given current market volatility
V. Potential Risk Comparison
Market Risk
SAND:
- Heavy dependence on virtual world adoption and user growth in gaming sector
- Extreme price volatility: 98.6% decline from all-time high creates substantial drawdown exposure
- Concentrated investor base with 207,069 total holders creates liquidity fragility
GRT:
- Protocol adoption dependent on dApp developer ecosystem scaling
- 98.6% decline from all-time high indicates similar vulnerability to market cycle downturn
- Higher circulation ratio (98.41%) may accelerate depreciation during bear markets
Liquidity and Volatility Risk
- Both tokens exhibit limited 24-hour trading volumes relative to market capitalization
- SAND volume-to-cap ratio: 0.032% (approximately)
- GRT volume-to-cap ratio: 0.050% (approximately)
- Both represent illiquid altcoin positions subject to slippage risk
Regulatory Risk
- Gaming and metaverse tokens (SAND) face potential regulatory scrutiny around virtual asset ownership and NFT classification
- Data indexing protocols (GRT) may encounter regulatory questions regarding decentralized data access and compliance frameworks
- Both operate in nascent regulatory environments with unclear long-term compliance requirements
VI. 2025-2030 Price Forecast Analysis
Short-term Outlook (2025)
SAND Forecast:
- Conservative range: $0.0979 - $0.1209
- Optimistic scenario: $0.1705
- Current position relative to forecast: Near lower-midpoint of conservative range
GRT Forecast:
- Conservative range: $0.0224 - $0.0387
- Optimistic scenario: $0.0569
- Current position relative to forecast: At upper boundary of conservative range
Mid-term Outlook (2027-2028)
SAND Projected Recovery:
- 2027: $0.1301 - $0.2096 (accumulation phase)
- 2028: $0.1717 - $0.2536 (+61% upside potential from current price)
GRT Projected Recovery:
- 2027: $0.0312 - $0.0618 (+59% upside potential from current price)
- 2028: $0.0434 - $0.0768 (+98% upside potential from current price)
Long-term Outlook (2030)
SAND Base Case: $0.1610 - $0.2367 (32-95% upside from December 2025) SAND Optimistic: $0.2769 (129% upside potential)
GRT Base Case: $0.0581 - $0.0708 (50-83% upside from December 2025) GRT Optimistic: $0.0772 (99% upside potential)
Price forecasts are derived from historical models and subject to substantial uncertainty. Actual outcomes may diverge significantly from projections.
VII. Conclusion: Which Is the Better Buy?
Investment Value Summary
SAND Advantages:
- Focused gaming/metaverse narrative with established user community of 207,069 holders
- Lower current price ($0.1211) relative to mid-term forecast range ($0.13-$0.25 in 2027-2028)
- Dual chain deployment (Ethereum and Base) provides operational flexibility
- Potential 2030 upside: 32-129% from current price levels
GRT Advantages:
- Infrastructure-layer positioning with established protocol utility in blockchain data querying
- Larger market capitalization ($417.97M vs $363.3M) suggests broader institutional recognition
- Staking and curation mechanisms create ongoing token demand beyond speculation
- Comparative liquidity advantage: 24-hour volume 79.8% higher than SAND
- Dual chain deployment (Ethereum and Arbitrum) across major Layer 2 solution
- Potential 2030 upside: 50-99% from current price levels
Investment Recommendations
Beginner Investors:
- Recommended strategy: 70% stablecoin allocation with 15% SAND / 15% GRT exposure
- Rationale: Both assets require substantial risk tolerance; position sizing should reflect learning curve
- Begin with DCA (Dollar-Cost Averaging) approach over 6-12 months to reduce timing risk
- Avoid leverage or derivatives trading given current extreme fear conditions
Experienced Investors:
- Recommended strategy: 40% SAND / 35% GRT / 25% stablecoins for tactical flexibility
- Rationale: Experienced investors can tolerate higher volatility while maintaining hedge positions
- Consider GRT for infrastructure thesis; SAND for gaming/metaverse exposure
- Utilize limit orders at forecast-aligned price levels (e.g., $0.15 for SAND, $0.05 for GRT) to systematize entry points
- Evaluate quarterly progress against protocol adoption metrics
Institutional Investors:
- Recommended strategy: 25-30% combined allocation within broader altcoin diversification mandate
- Rationale: Both tokens represent protocol-layer exposure with infrastructure defensibility
- GRT preferred for staking yield generation and protocol participation
- Conduct extensive due diligence on team development roadmaps and ecosystem adoption rates
- Implement structured position monitoring against fundamental milestones
Disclaimer
⚠️ Risk Warning: This comparative analysis is based on available reference materials and historical data as of December 16, 2025. Cryptocurrency markets exhibit extreme volatility and unpredictability. Neither SAND nor GRT constitutes a recommendation for investment purposes.
Key Risk Factors:
- Both tokens have declined 83-86% over the past year
- Current market sentiment stands at extreme fear levels (index: 11)
- Limited trading liquidity relative to market capitalization creates slippage risk
- Regulatory frameworks remain uncertain for gaming tokens and data protocol tokens
- Past performance does not guarantee future results
- Investors may experience total loss of capital
This content is provided for informational and educational purposes only. All investment decisions should be made independently after consulting qualified financial advisors and conducting thorough personal research aligned with individual risk tolerance and investment objectives.
Report Date: December 16, 2025
Data Source: On-chain metrics, exchange data, and market price information
Forecast Basis: Historical price models and statistical projections
None
Frequently Asked Questions: SAND vs GRT Investment Comparison
I. What are the fundamental differences between SAND and GRT?
Answer: SAND (The Sandbox) is a decentralized virtual gaming platform built on Ethereum that enables players to create, own, and monetize gaming experiences through NFTs and game development tools. GRT (The Graph) is a decentralized protocol for indexing and querying blockchain data, functioning as infrastructure for decentralized applications. SAND targets the gaming and metaverse ecosystem, while GRT provides data indexing services to the broader blockchain infrastructure layer.
II. How have SAND and GRT performed relative to their all-time highs?
Answer: Both tokens have experienced severe declines from their historical peaks. SAND peaked at $8.40 in November 2021 and is currently trading at $0.1211 (98.6% below all-time high), while GRT peaked at $2.84 in February 2021 and is currently trading at $0.0387 (98.6% below all-time high). Over the past year, SAND declined 83.95% and GRT declined 86.53%, indicating comparable downward pressure on both assets during the current market cycle.
III. Which token has better liquidity and trading volume?
Answer: GRT demonstrates superior liquidity metrics with 24-hour trading volume of $210,542.59 compared to SAND's $117,231.49 (79.8% higher). However, both tokens exhibit limited liquidity relative to their market capitalizations, creating potential slippage risk during significant trading activity. GRT trades on 63 exchanges while SAND is available on 66 exchanges, providing comparable market accessibility for both assets.
IV. What are the key differences in tokenomics between SAND and GRT?
Answer: SAND has a total supply of 3 billion tokens with 87.11% in circulation (2.61 billion circulating supply) and 207,069 token holders. GRT has a total supply of 10.8 billion tokens with 98.41% in circulation (10.63 billion circulating supply) and 173,437 token holders. GRT's higher circulation ratio and larger total supply indicate different inflation and dilution dynamics compared to SAND's more concentrated token distribution.
V. Which token offers better long-term price appreciation potential?
Answer: Based on 2030 price forecasts, SAND presents 32-129% upside potential (base case: $0.1610-$0.2367; optimistic: $0.2769), while GRT offers 50-99% upside potential (base case: $0.0581-$0.0708; optimistic: $0.0772). SAND exhibits higher absolute percentage upside in optimistic scenarios, though both forecasts remain subject to substantial uncertainty and model limitations. Mid-term projections (2027-2028) suggest SAND may reach $0.1717-$0.2536 while GRT may reach $0.0434-$0.0768.
VI. What is the current market sentiment, and how does it affect these investments?
Answer: The Crypto Fear & Greed Index currently stands at 11 (Extreme Fear), reflecting widespread risk aversion in cryptocurrency markets. This sentiment particularly impacts lower-capitalization altcoins like SAND and GRT, contributing to downward price pressure and reduced investor interest. Under extreme fear conditions, both tokens experience elevated volatility and liquidity constraints, requiring conservative position sizing and substantial stablecoin reserves (30-50% allocation) for risk management.
VII. How should different investor types approach SAND vs GRT allocation?
Answer: Conservative investors should maintain 20% SAND / 30% GRT allocations with 50% stablecoins for downside protection, reflecting GRT's slightly more defensible infrastructure positioning. Aggressive investors may increase exposure to 40% SAND / 35% GRT with 25% stablecoin reserves while maintaining cross-asset diversification. Beginner investors are advised to start with 15% SAND / 15% GRT / 70% stablecoins using dollar-cost averaging over 6-12 months to reduce timing risk and account for market learning curves.
VIII. What are the primary risk factors for SAND and GRT investments?
Answer: Key risks include: (1) Market Risk—both tokens face 98.6% declines from peaks, indicating extreme drawdown exposure; (2) Liquidity Risk—limited trading volume relative to market capitalization creates slippage vulnerability; (3) Regulatory Risk—gaming tokens (SAND) face NFT classification scrutiny while data protocols (GRT) encounter uncertain compliance frameworks; (4) Adoption Risk—SAND depends on virtual world user growth while GRT depends on dApp developer ecosystem scaling; (5) Concentration Risk—both maintain relatively small holder bases (173,437-207,069) vulnerable to whale activity. Investors should recognize the potential for total capital loss given current market conditions and extreme volatility.
Report Date: December 16, 2025
Disclaimer: This FAQ provides factual information and analysis based on available reference materials. It does not constitute investment advice. Cryptocurrency investments carry substantial risk including potential total loss of capital. Consult qualified financial advisors before making investment decisions.
Share
How to Buy Cryptocurrency


Trending Cryptocurrencies


XZXX: A Comprehensive Guide to the BRC-20 Meme Token in 2025
Bitcoin Fear and Greed Index: Market Sentiment Analysis for 2025

Top Crypto ETFs to Watch in 2025: Navigating the Digital Asset Boom
5 ways to get Bitcoin for free in 2025: Newbie Guide

Bitcoin Market Cap in 2025: Analysis and Trends for Investors

2025 Bitcoin Price Prediction: Trump's Tariffs' Impact on BTC
What Are the Key Differences Between Top Crypto Competitors: Market Cap, Performance, and User Base Comparison?
How Does Competitor Analysis Impact Crypto Exchange Market Share and Performance in 2025?
# Why Does ESPORTS Crypto Price Fluctuate So Much? Understanding Volatility, Support/Resistance Levels, and 2025 Price Predictions

What are the SEC compliance risks and regulatory challenges facing THQ and Theoriq in 2025?
What is FORM crypto price and market overview in December 2025?
