Explore o potencial de investimento de MAV face a AAVE no mercado de criptoativos. Compare estes principais protocolos DeFi considerando tendências históricas de preços, adoção institucional, ecossistemas técnicos e previsões para o futuro. O protocolo de empréstimo consolidado da AAVE em contraste com a infraestrutura AMM inovadora da MAV. Avalie a melhor oportunidade de compra para investidores experientes e novos, através de uma análise estratégica e comparação de riscos. Descubra mais detalhes sobre previsões de preços, sentimento do mercado e fatores de crescimento exclusivamente na Gate.
Introdução: Comparação de Investimento entre MAV e AAVE
No contexto das criptomoedas, analisar Maverick (MAV) e AAVE (AAVE) é uma questão incontornável para qualquer investidor informado. Estas duas soluções diferenciam-se significativamente em capitalização de mercado, cenários de aplicação e desempenho do preço, além de ocuparem posições distintas no ecossistema dos ativos digitais.
Maverick (MAV): Após o lançamento em 2023, conquistou notoriedade pelo seu modelo inovador de automated market maker (AMM) na finança descentralizada.
AAVE (AAVE): Desde 2020, é reconhecido como protocolo líder de empréstimos descentralizados, oferecendo serviços de depósito e crédito a utilizadores.
Este artigo apresenta uma análise detalhada do valor de investimento entre MAV e AAVE, com enfoque em tendências históricas de preço, mecanismos de oferta, adoção institucional, ecossistemas técnicos e previsões futuras, procurando responder à principal questão dos investidores:
"Qual oferece melhor potencial de compra atualmente?"
I. Comparação Histórica de Preço e Estado Atual do Mercado
Evolução Histórica dos Preços de MAV e AAVE
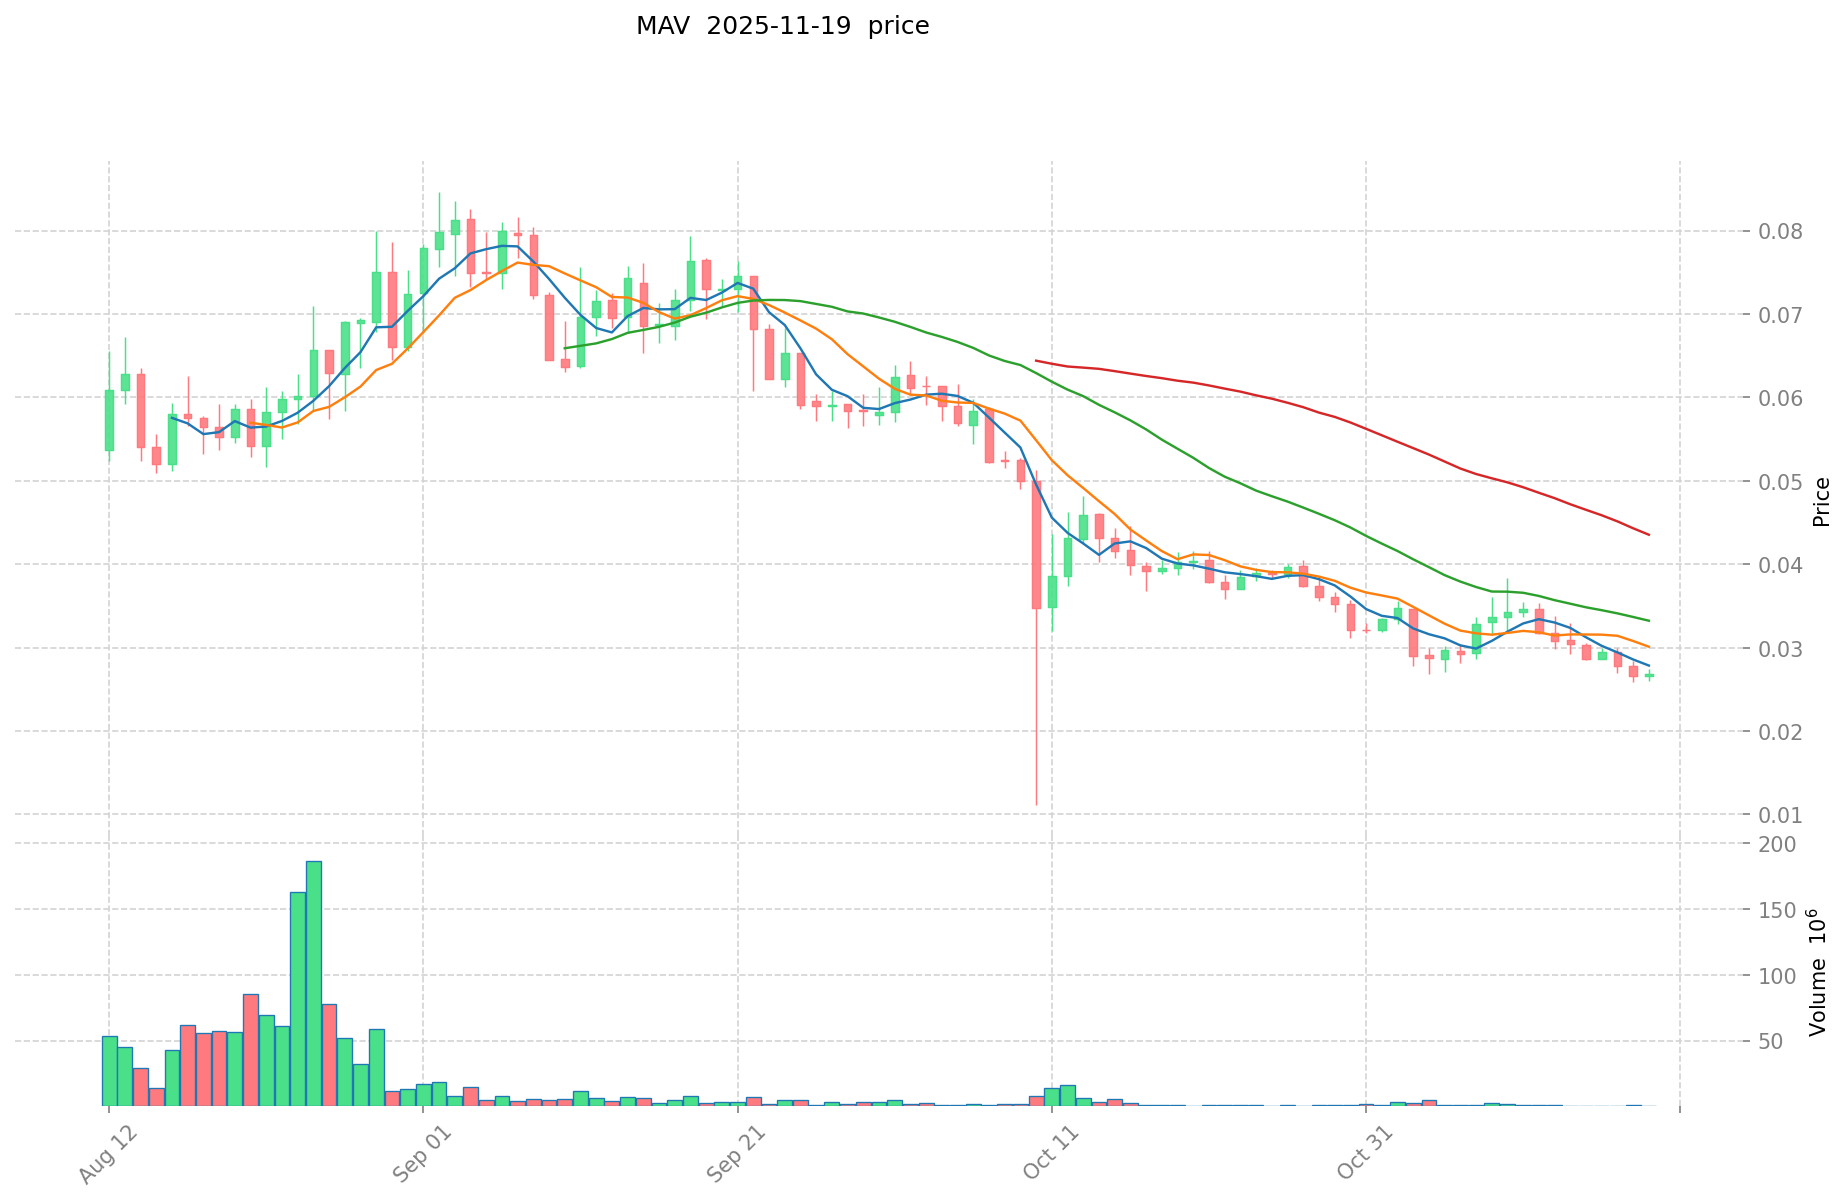
- 2024: MAV atingiu o máximo histórico de 0,8186 $ em 2 de março de 2024.
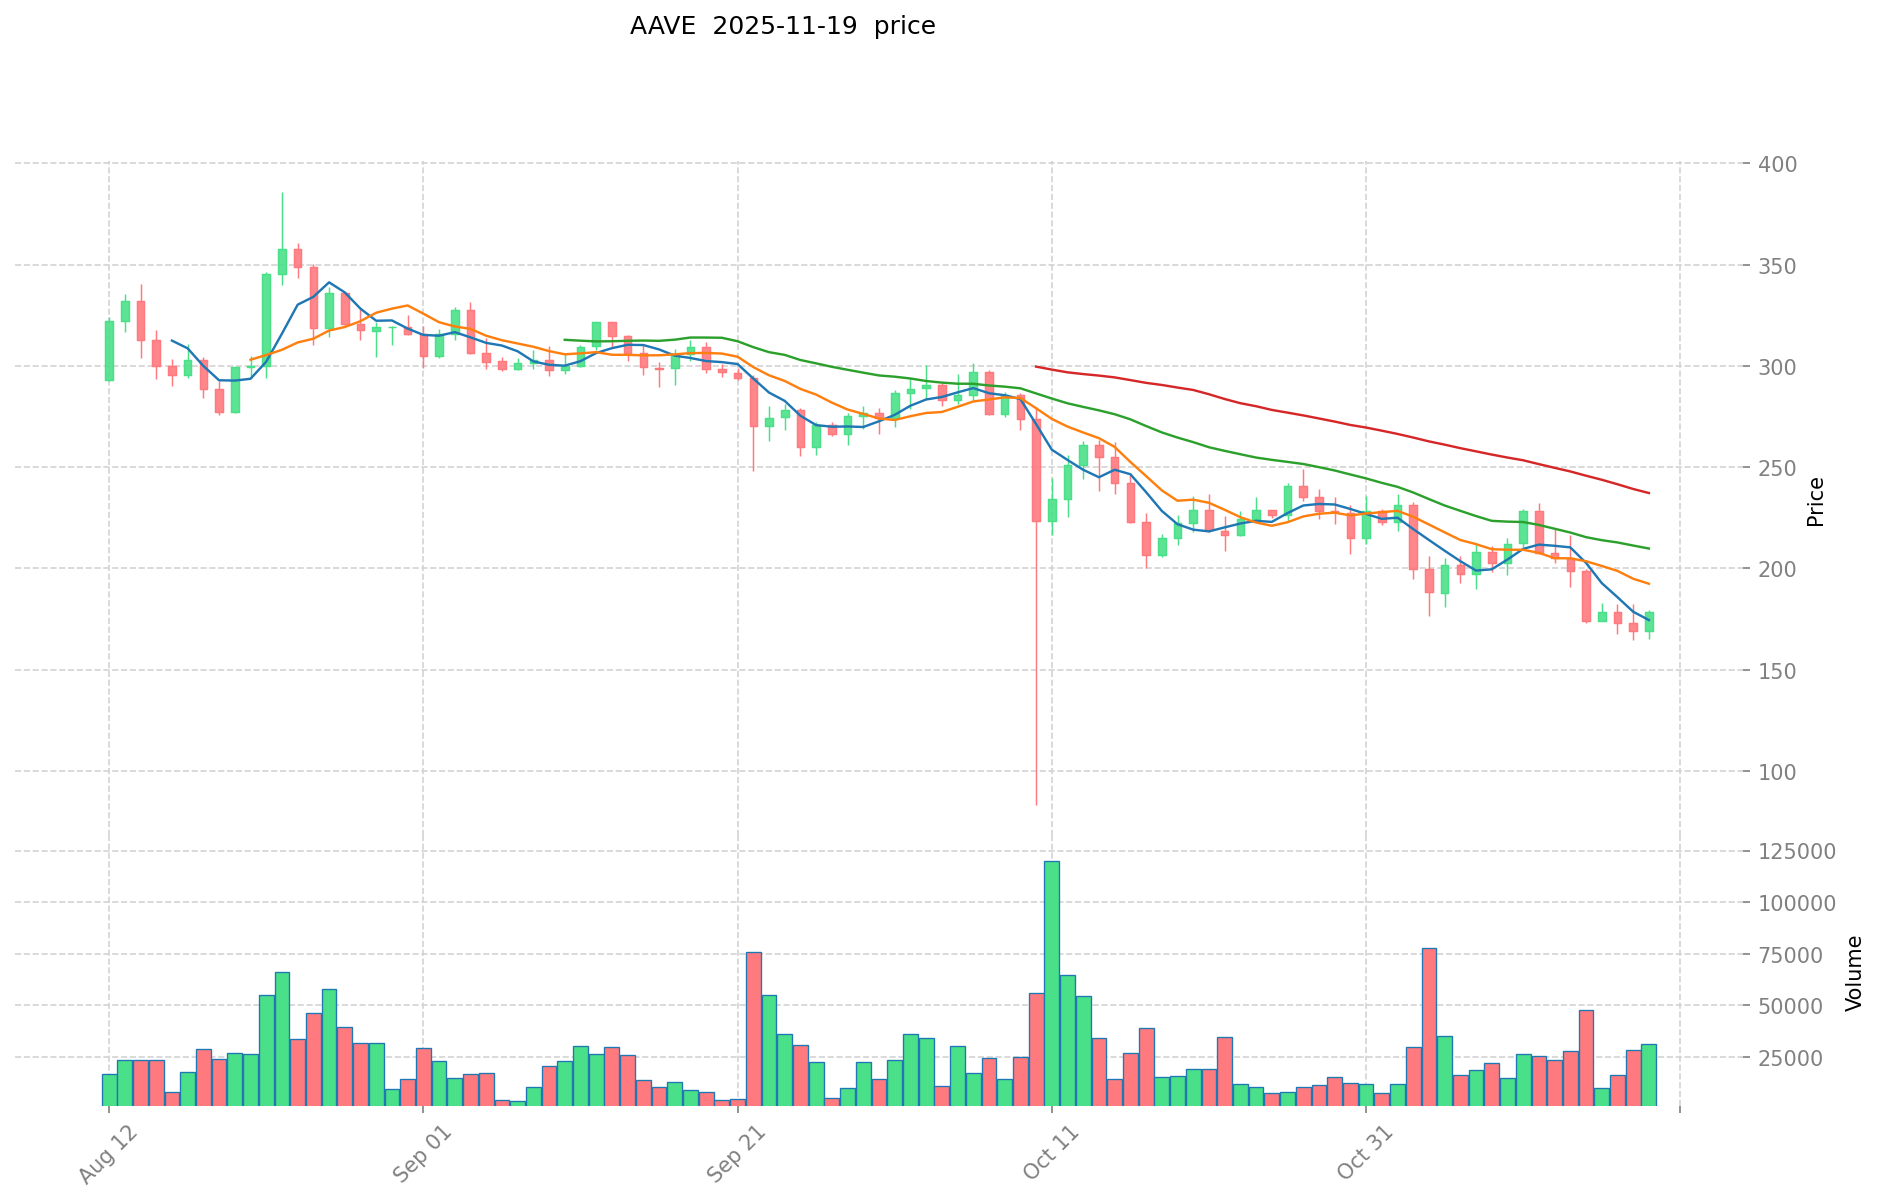
- 2021: AAVE registou o máximo histórico de 661,69 $ em 19 de maio de 2021, durante o bull market.
- Análise comparativa: No ciclo recente, MAV desvalorizou de 0,8186 $ para o mínimo de 0,01108 $, enquanto AAVE caiu de 661,69 $ para 26,02 $.
Situação de Mercado Atual (19 de novembro de 2025)
- Preço MAV: 0,02772 $
- Preço AAVE: 173,96 $
- Volume transacionado em 24 horas: MAV 17 171 012 $ vs AAVE 4 323 130 795 $
- Índice de Sentimento de Mercado (Fear & Greed Index): 15 (Medo Extremo)
Clique para consultar preços em tempo real:
Análise do Valor de Investimento em AAVE
I. Fatores-Chave que Influenciam o Valor de Investimento em AAVE
Fundamentos do Protocolo
- Posição de Mercado: AAVE é atualmente o maior e mais resiliente protocolo de empréstimos, com empréstimos ativos a totalizarem 7,5 mil milhões $, cinco vezes acima do concorrente mais próximo, Spark.
- Histórico: Após cinco anos desde o lançamento em janeiro de 2020 na Ethereum mainnet, AAVE consolidou-se como um dos protocolos mais fiáveis da DeFi.
- Histórico de Segurança: Ao contrário de muitos protocolos recentes, AAVE manteve a operação sem incidentes graves ao nível dos contratos inteligentes.
- Crescimento das Receitas: As receitas da AAVE superaram o pico do quarto trimestre de 2021, com crescimento trimestral acelerado de 50-60% durante a recuperação do mercado em 2024.
- Crescimento Sustentado: Mesmo durante a estagnação do mercado (novembro 2022 a outubro 2023), o crescimento das receitas manteve-se trimestre após trimestre.
- Expansão do TVL: Desde o início do ano, o Total Value Locked duplicou, recuperando para 51% do pico do ciclo de 2021, graças ao aumento de depósitos e valorização de ativos como WBTC e ETH.
Modelo Económico
- Safety Module: AAVE atua como "emprestador de último recurso" do protocolo em situações de perdas sistémicas, permitindo aos detentores optar por eventos de perda através do staking no Safety Module.
- Mitigação de Risco: As alterações recentes eliminaram o risco de slashing para $AAVE quando o Safety Module é acionado, beneficiando utilizadores e detentores do token.
- Geração de Rendimentos: Quem faz staking de AAVE recebe recompensas do ecossistema e taxas do protocolo, com rendimento anual (APR) próximo de 6%.
Vantagens Competitivas
- Segurança do Protocolo: O histórico sólido de gestão de risco e segurança da AAVE é decisivo para utilizadores DeFi e investidores institucionais.
- Diluição Total: $AAVE já se encontra praticamente totalmente diluído, sem desbloqueios relevantes de oferta previstos, ao contrário de tokens recentes, que frequentemente sofrem quedas após eventos de geração de tokens.
- Implementação Multi-chain: AAVE está presente em 13 blockchains e planeia expandir para Aptos, marcando a estreia em redes não EVM e reforçando a liderança multi-chain.
II. Catalisadores de Crescimento e Perspetivas Futuras
Desenvolvimentos Técnicos
- AAVE V4: A nova atualização V4 irá expandir a plataforma para mais redes e introduzir novas classes de ativos.
- Integração RWA: AAVE explora produtos Real World Asset baseados em GHO, potenciando a ligação entre finanças tradicionais e DeFi.
- Distribuição de Receitas: Novos mecanismos vão redistribuir rendimentos líquidos do protocolo aos stakers, aumentando a procura por $AAVE.
Correlação de Mercado
- Expansão do Mercado Cripto: AAVE beneficia do crescimento global do mercado cripto, já que mais de 75% dos ativos são não estáveis (sobretudo derivados BTC e ETH).
- Mercado das Stablecoins: AAVE pode beneficiar do crescimento das stablecoins, em especial se os bancos centrais globais avançarem para ciclos de corte de taxas, desviando capitais dos instrumentos tradicionais para farms DeFi.
- Apetite de Risco: Em bull markets, o aumento do apetite de risco impulsiona as taxas de utilização de empréstimos de stablecoins em plataformas como AAVE.
Métricas de Avaliação
- Divergência entre Preço e Fundamentos: Apesar do aumento do TVL e das receitas, os múltiplos de avaliação da AAVE comprimiram, sugerindo desconexão entre fundamentos e valorização de mercado.
- Oportunidade Ajustada ao Risco: O protocolo representa uma das melhores oportunidades ajustadas ao risco graças à sua posição consolidada e crescimento sustentável dos indicadores-chave.
- Captação de Valor: AAVE apresenta um modelo de receitas claro e métodos eficientes de captação económica do token, mantendo vantagem competitiva estável no segmento de empréstimo DeFi.
III. Previsão de Preço 2025-2030: MAV vs AAVE
Previsão de Curto Prazo (2025)
- MAV: Conservador 0,026372 - 0,02776 $ | Otimista 0,02776 - 0,036088 $
- AAVE: Conservador 92,9779 - 175,43 $ | Otimista 175,43 - 224,5504 $
Previsão de Médio Prazo (2027)
- MAV poderá entrar em fase de crescimento, com preços previstos entre 0,0306278856 $ e 0,0455491632 $
- AAVE poderá entrar em bull market, com preços entre 114,47439048 $ e 300,22528824 $
- Principais catalisadores: entrada de fundos institucionais, ETFs, desenvolvimento do ecossistema
Previsão de Longo Prazo (2030)
- MAV: Cenário base 0,0484668619686 - 0,054282885404832 $ | Cenário otimista 0,054282885404832 $+
- AAVE: Cenário base 365,447747182905 - 507,97236858423795 $ | Cenário otimista 507,97236858423795 $+
Consultar previsões detalhadas para MAV e AAVE
Declaração de responsabilidade: Esta análise baseia-se em dados históricos e projeções de mercado. Os mercados de criptomoedas apresentam volatilidade extrema e imprevisível. Esta informação não constitui aconselhamento financeiro. Realize sempre a sua própria investigação antes de investir.
MAV:
| Ano |
Preço Máximo Previsto |
Preço Médio Previsto |
Preço Mínimo Previsto |
Variação Percentual |
| 2025 |
0,036088 |
0,02776 |
0,026372 |
0 |
| 2026 |
0,04660904 |
0,031924 |
0,02138908 |
15 |
| 2027 |
0,0455491632 |
0,03926652 |
0,0306278856 |
41 |
| 2028 |
0,052161645168 |
0,0424078416 |
0,02332431288 |
52 |
| 2029 |
0,0496489805532 |
0,047284743384 |
0,03451786267032 |
70 |
| 2030 |
0,054282885404832 |
0,0484668619686 |
0,024718099603986 |
74 |
AAVE:
| Ano |
Preço Máximo Previsto |
Preço Médio Previsto |
Preço Mínimo Previsto |
Variação Percentual |
| 2025 |
224,5504 |
175,43 |
92,9779 |
0 |
| 2026 |
231,988632 |
199,9902 |
171,991572 |
14 |
| 2027 |
300,22528824 |
215,989416 |
114,47439048 |
24 |
| 2028 |
363,9313664892 |
258,10735212 |
237,4587639504 |
48 |
| 2029 |
419,87613506121 |
311,0193593046 |
158,619873245346 |
78 |
| 2030 |
507,97236858423795 |
365,447747182905 |
277,7402878590078 |
110 |
IV. Comparação de Estratégias de Investimento: MAV vs AAVE
Investimento a Longo Prazo vs Curto Prazo
- MAV: Adequado para investidores com foco em inovação DeFi e potencial de crescimento
- AAVE: Recomendado para quem procura protocolos sólidos e consolidados
Gestão de Risco e Alocação de Ativos
- Investidores conservadores: MAV 20% vs AAVE 80%
- Investidores agressivos: MAV 40% vs AAVE 60%
- Ferramentas de cobertura: stablecoins, opções, carteira multi-moeda
V. Comparação de Riscos Potenciais
Risco de Mercado
- MAV: Volatilidade mais elevada devido à capitalização de mercado reduzida e historial limitado
- AAVE: Risco de saturação no segmento de empréstimos DeFi
Risco Técnico
- MAV: Desafios de escalabilidade e estabilidade da rede
- AAVE: Vulnerabilidades de contratos inteligentes e concorrência de protocolos emergentes
Risco Regulatório
- As políticas regulatórias globais podem afetar ambos os tokens de forma distinta, com AAVE sujeito a escrutínio acrescido devido à sua relevância de mercado
VI. Conclusão: Qual é a Melhor Opção de Compra?
📌 Resumo do Valor de Investimento:
- Vantagens MAV: AMM inovador, potencial de crescimento acelerado
- Vantagens AAVE: Líder em empréstimos DeFi, segurança comprovada, implementação multi-chain
✅ Recomendações de Investimento:
- Novos investidores: Privilegie AAVE pela sua posição consolidada e perfil de risco inferior
- Investidores experientes: Opte por uma carteira equilibrada entre MAV e AAVE, ajustando à tolerância ao risco
- Investidores institucionais: Foque em AAVE pela liquidez, posição dominante e segurança institucional
⚠️ Aviso de Risco: O mercado de criptomoedas é altamente volátil. Esta análise não constitui aconselhamento financeiro.
None
VII. FAQ
P1: Quais as diferenças essenciais entre MAV e AAVE?
R: MAV é um projeto recente, centrado numa infraestrutura AMM inovadora; AAVE é um protocolo de empréstimos descentralizados consolidado, com maior capitalização de mercado, histórico comprovado e presença em múltiplas blockchains.
P2: Que token apresentou melhor desempenho recente?
R: Pelos dados apresentados, AAVE registou desempenho superior, recuperando de mínimos e negociando a preços significativamente mais elevados, enquanto MAV atingiu o máximo histórico em 2024.
P3: Quais os principais riscos ao investir em MAV e AAVE?
R: MAV apresenta volatilidade mais elevada e desafios de escalabilidade devido à sua capitalização reduzida e historial curto. AAVE enfrenta riscos de saturação do mercado de empréstimos e possível escrutínio regulatório.
P4: Como se comparam as perspetivas futuras de MAV e AAVE?
R: AAVE tem uma trajetória de crescimento consolidada, com atualizações previstas (V4), integração de ativos reais e maior adoção institucional. MAV tem uma perspetiva mais especulativa, mas pode apresentar elevado potencial se a inovação AMM se afirmar.
P5: Qual o token mais indicado para investidores conservadores?
R: AAVE é geralmente mais adequado para perfis conservadores, dada a sua posição no mercado, segurança comprovada e estabilidade financeira. Uma distribuição sugerida seria 80% AAVE e 20% MAV.
P6: Como se comparam as previsões de longo prazo para MAV e AAVE?
R: Em 2030, MAV deverá situar-se entre 0,0484668619686 - 0,054282885404832 $, enquanto AAVE poderá atingir 365,447747182905 - 507,97236858423795 $, com potencial de valorização superior para AAVE face aos preços atuais.
P7: Que fatores poderão impulsionar MAV e AAVE nos próximos anos?
R: Entre os principais catalisadores estão o crescimento do mercado cripto, adoção institucional, aprovação de ETFs e desenvolvimento do ecossistema. Para AAVE, destaca-se ainda a expansão multi-chain e integração com finanças tradicionais.
* As informações não se destinam a ser e não constituem aconselhamento financeiro ou qualquer outra recomendação de qualquer tipo oferecido ou endossado pela Gate.


