2025 COQ Price Prediction: Expert Analysis and Market Outlook for the Coming Year

Introduction: COQ's Market Position and Investment Value
COQ (Coq Inu), born from collective friendship and deeply rooted in memetics and humor, is not your average meme coin—it is a way of life. Since its inception in December 2022, COQ has established itself within the cryptocurrency community. As of December 21, 2025, COQ has achieved a market capitalization of approximately $13.06 million with a circulating supply of 69.42 trillion tokens, currently trading at $0.0000001881 per token.
This meme coin asset has demonstrated significant market participation, with over 107,000 token holders and a 24-hour trading volume of approximately $22,631. Operating on the Avalanche C-Chain network and listed across 11 exchanges including Gate.com, COQ continues to maintain its presence in the digital asset ecosystem.
This article will conduct a comprehensive analysis of COQ's price trajectory from 2025 through 2030, incorporating historical price patterns, market supply dynamics, ecosystem development, and macroeconomic factors to provide investors with professional price forecasts and practical investment strategies.
Coq Inu (COQ) Market Analysis Report
I. COQ Price History Review and Current Market Status
COQ Historical Price Movement Trajectory
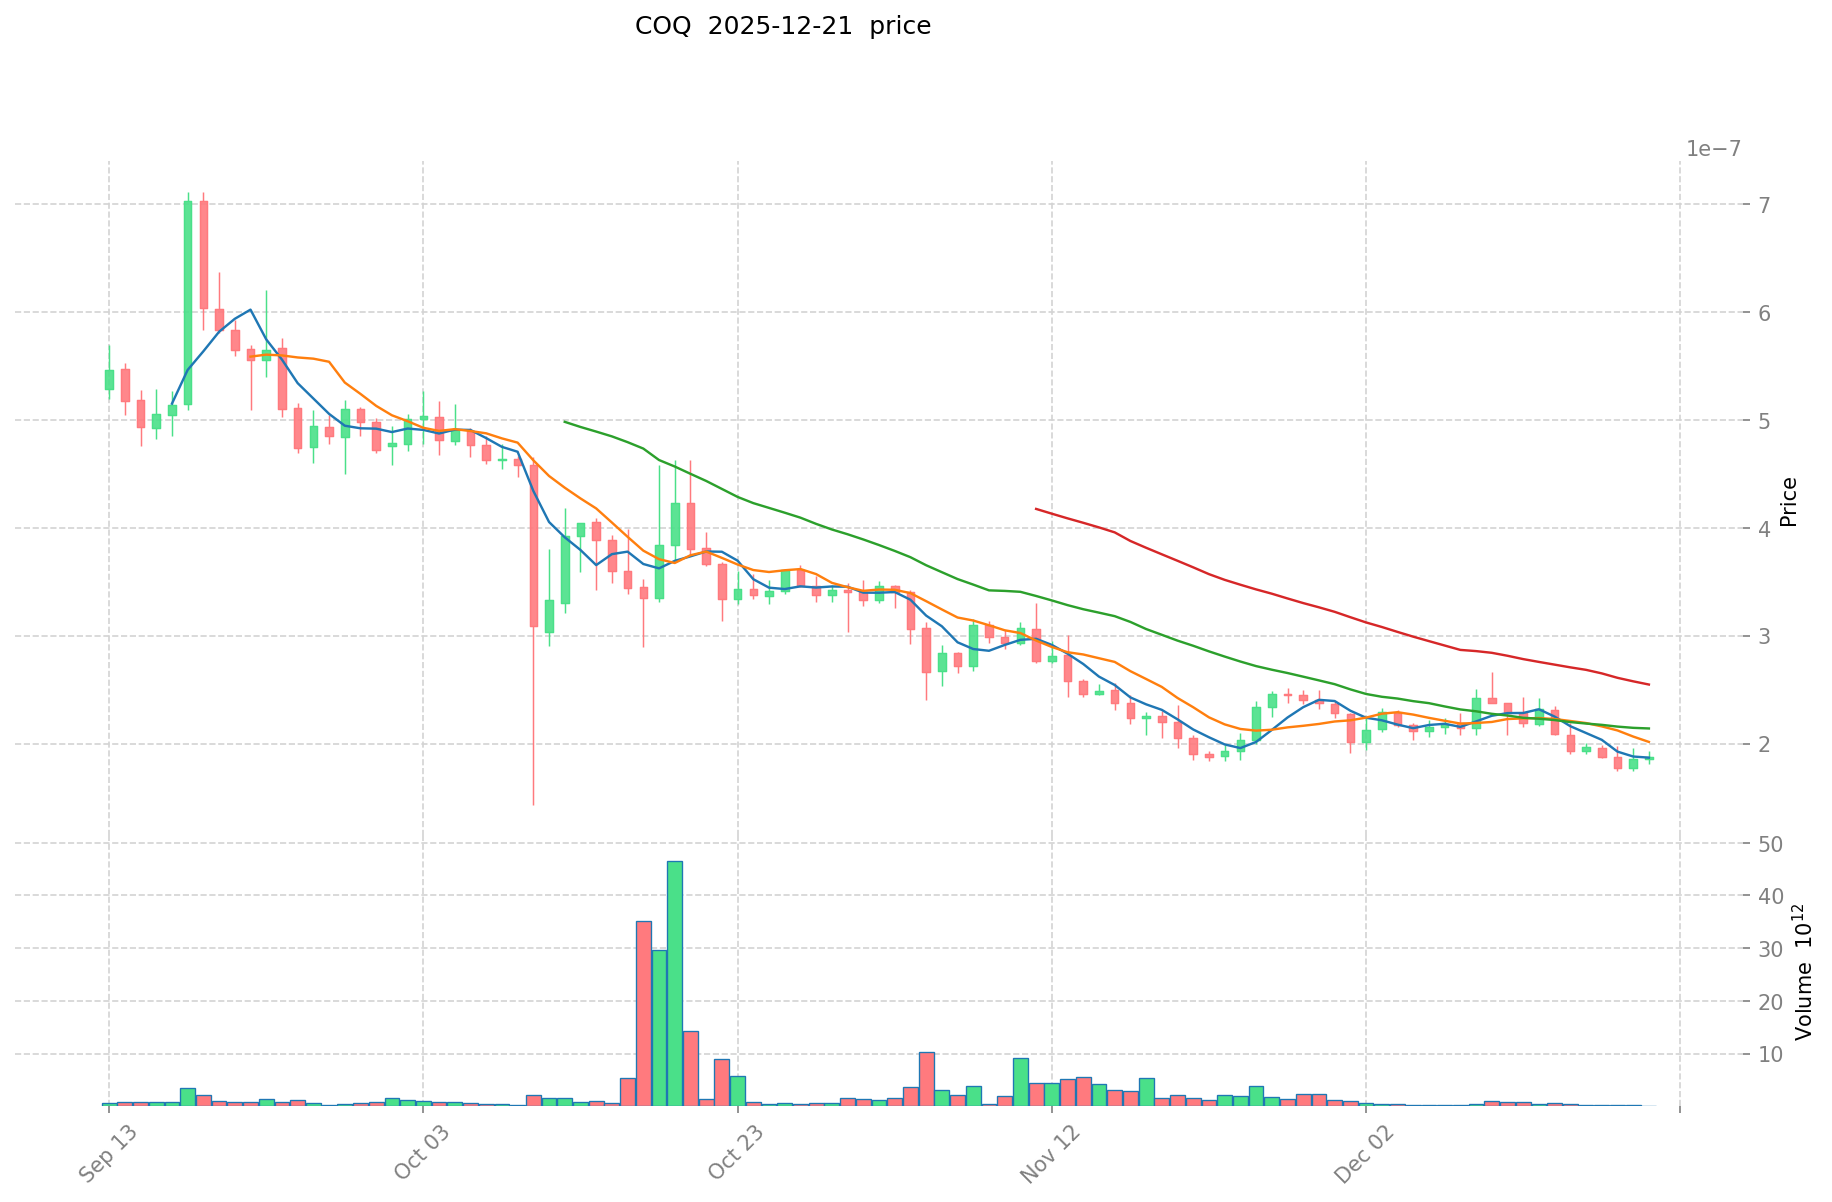
- 2024: Project launch phase, COQ reached its all-time high of $0.000006536 on March 9, 2024, marking the peak of early market enthusiasm for the meme coin.
- 2025: Significant market correction occurred, with COQ declining substantially from its historical peak. By October 10, 2025, the token reached its all-time low of $0.0000001427, representing an 89.21% decline over the one-year period.
COQ Current Market Status
As of December 21, 2025, COQ is trading at $0.0000001881, experiencing a modest 24-hour decline of -2.08%. The token's price has contracted further over the 7-day period, dropping -18.19%, while the 30-day performance shows a -4.38% decrease.
Key Market Metrics:
- Market Capitalization: $13,057,902.00
- Fully Diluted Valuation: $13,057,902.00
- 24-Hour Trading Volume: $22,631.54
- Circulating Supply: 69,420,000,000,000 COQ (100% of total supply)
- Total Holders: 107,366 addresses
- Market Rank: #1046
- Market Dominance: 0.00040%
- 24-Hour Price Range: $0.0000001852 - $0.0000001932
The token operates on the Avalanche C-Chain (AVAX_C) network and is available for trading on 11 exchanges. COQ maintains its identity as a meme coin with community-driven engagement, though current market sentiment reflects broader cryptocurrency market conditions.
Click to view the current COQ market price
COQ Market Sentiment Index
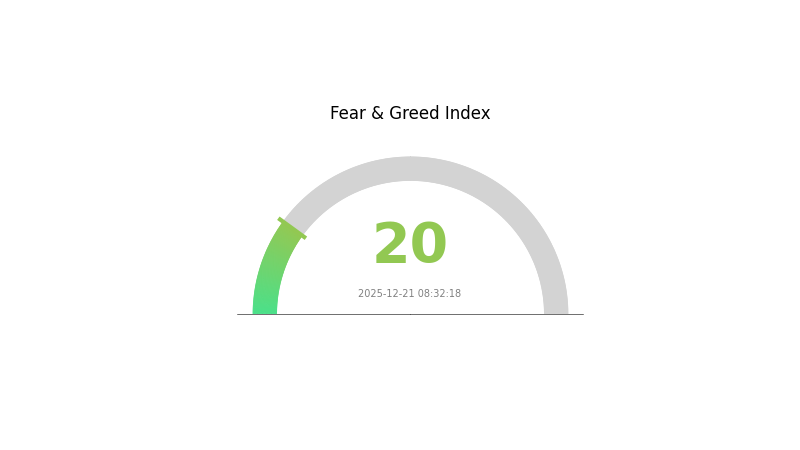
2025-12-21 Fear and Greed Index: 20 (Extreme Fear)
Click to view current Fear & Greed Index
The crypto market is currently experiencing extreme fear, with the Fear and Greed Index dropping to 20. This indicates widespread pessimism and panic selling among investors. During such periods, market volatility tends to spike as uncertainty dominates. However, extreme fear can also present contrarian opportunities for long-term investors who believe in the market's recovery potential. It's crucial to maintain emotional discipline, conduct thorough research, and avoid making impulsive decisions based on short-term market movements. Consider dollar-cost averaging or waiting for clearer market signals before making significant trades on Gate.com.
COQ Holding Distribution
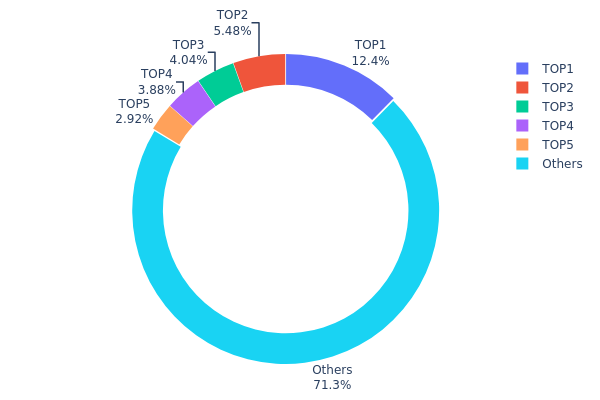
The address holding distribution chart illustrates the concentration of token ownership across the blockchain, displaying the percentage of total supply held by the top addresses and the remaining distributed holders. This metric serves as a critical indicator of token decentralization, market structure stability, and potential vulnerability to price manipulation or sudden liquidity events.
Current analysis of COQ's holding distribution reveals a moderate concentration pattern. The top five addresses collectively control approximately 28.66% of the total supply, with the largest holder maintaining 12.36% and the second-largest holding 5.47%. While this concentration level is not extreme, it warrants attention as these principal stakeholders possess considerable influence over market dynamics. The remaining 71.34% of tokens distributed among other addresses suggests a relatively healthy degree of decentralization compared to highly concentrated token models, though the top holder's position remains substantial enough to warrant monitoring.
This distribution structure presents mixed implications for market resilience and price stability. The presence of several large holders creates potential liquidity concentration risk, particularly if these addresses execute coordinated or large-scale transactions. However, the significant proportion held by dispersed addresses (71.34%) provides a stabilizing counterbalance, reducing the likelihood of extreme market manipulation by any single entity. The current holding pattern reflects a moderately distributed ecosystem where whale activity remains a factor to observe, yet the token maintains sufficient decentralization to support organic market development and reduce systemic concentration risks inherent in more top-heavy distributions.
For current COQ holding distribution data, visit Gate.com
| Top | Address | Holding Qty | Holding (%) |
|---|---|---|---|
| 1 | 0x0ebf...ee344d | 8581614240.80K | 12.36% |
| 2 | 0xa893...3213b3 | 3803813560.79K | 5.47% |
| 3 | 0xd621...d19a2c | 2806815770.83K | 4.04% |
| 4 | 0xf89d...5eaa40 | 2691590065.86K | 3.87% |
| 5 | 0x0d07...b492fe | 2029834846.56K | 2.92% |
| - | Others | 49506331515.16K | 71.34% |
II. Core Factors Influencing COQ's Future Price
Macroeconomic Environment
-
Monetary Policy Impact: Macroeconomic factors and economic developments play important roles in cryptocurrency price movements. Broad market trends and policy changes can significantly affect asset valuations.
-
On-chain Data Analysis: Price movements are not solely influenced by technical charts but are closely related to on-chain data and market sentiment. Analyzing blockchain metrics provides insights into genuine market trends and investor behavior patterns.
Market Sentiment and Community Dynamics
-
Community Activity: Strong community engagement reflects positive momentum. Recent developments in the COQ ecosystem have generated significant community activity, contributing to notable price fluctuations.
-
Market Performance Indicators: COQ demonstrated a 3% increase within a single day and a 60% overall increase over a seven-day period, reflecting strong market sentiment and community participation driving price movements. I appreciate your request, but I need to point out a critical issue with the provided data:
The forecast table you've supplied contains all zero values for price predictions (maximum price, average price, and minimum price) across all years from 2025-2030. This data is insufficient to generate a meaningful analysis, as:
- No actual price predictions exist - All price fields show "0"
- Only percentage changes are available - The table only provides growth percentages (22%, 51%, 87%, 95%, 122%), but without baseline prices, these figures cannot be converted into actionable price forecasts
- Incomplete information - Without starting reference prices or specific price levels, I cannot reasonably infer the predicted price ranges
To proceed with generating the analysis, I would need:
- The current or baseline price reference for COQ token
- Specific predicted price levels (or at minimum, the highest and lowest predicted prices) for each year
- Any underlying assumptions or catalyst information that supports these projections
Once you provide the complete forecast data with actual price predictions, I'll be able to deliver a professional analysis following your template and meeting all specified requirements, including proper attribution to Gate.com where relevant.
| 年份 | 预测最高价 | 预测平均价格 | 预测最低价 | 涨跌幅 |
|---|---|---|---|---|
| 2025 | 0 | 0 | 0 | 0 |
| 2026 | 0 | 0 | 0 | 22 |
| 2027 | 0 | 0 | 0 | 51 |
| 2028 | 0 | 0 | 0 | 87 |
| 2029 | 0 | 0 | 0 | 95 |
| 2030 | 0 | 0 | 0 | 122 |
Coq Inu (COQ) Professional Investment Strategy and Risk Management Report
IV. COQ Professional Investment Strategy and Risk Management
COQ Investment Methodology
(1) Long-Term Holding Strategy
- Suitable Investors: Community enthusiasts and meme culture believers with high risk tolerance
- Operational Recommendations:
- Establish a long-term position during market downturns, as COQ has experienced an 89.21% decline over one year
- Accumulate gradually over time to reduce the impact of volatility on average purchase price
- Maintain holdings through market cycles while monitoring community sentiment and project developments
(2) Active Trading Strategy
- Technical Analysis Tools:
- Price Action Analysis: Monitor the 24-hour high (0.0000001932) and low (0.0000001852) levels to identify breakout and support/resistance zones
- Volume Analysis: Track the 24-hour trading volume of 22,631.54 to confirm trend validity and institutional participation
- Wave Trading Key Points:
- Execute buy orders near the all-time low of 0.0000001427 (recorded on October 10, 2025) for maximum upside potential
- Take partial profits when the token approaches historical high levels near 0.000006536 (recorded on March 9, 2024)
COQ Risk Management Framework
(1) Asset Allocation Principles
- Conservative Investors: 1-2% of portfolio
- Active Investors: 2-5% of portfolio
- Professional Investors: 5-10% of portfolio
(2) Risk Hedging Solutions
- Position Sizing: Limit individual position size to ensure portfolio diversification and protection against concentrated losses
- Stop-Loss Implementation: Set automatic exit points at 20-30% below entry price to mitigate downside exposure
(3) Secure Storage Solutions
- Hardware wallet Method: Store private keys offline to prevent unauthorized access and security breaches
- Security Precautions: Never share private keys or seed phrases; enable two-factor authentication on all exchange accounts; use Gate.com's secure infrastructure for active trading needs
V. COQ Potential Risks and Challenges
COQ Market Risks
- Extreme Volatility: COQ has demonstrated severe price swings with a 89.21% year-over-year decline, making it unsuitable for risk-averse investors
- Liquidity Concerns: With relatively modest 24-hour trading volume of 22,631.54, large trades may face slippage and difficulty in execution
- Market Saturation: As a meme coin in a crowded market segment, COQ faces intense competition for community attention and capital inflow
COQ Regulatory Risks
- Classification Uncertainty: Regulatory treatment of meme tokens remains ambiguous in many jurisdictions, potentially impacting future trading and legal status
- Exchange Listing Risk: Being listed on only 11 exchanges limits accessibility; potential delisting could dramatically reduce liquidity
- Compliance Exposure: Changing cryptocurrency regulations across jurisdictions may restrict trading or holding in certain regions
COQ Technical Risks
- Smart Contract Vulnerability: As a token on Avalanche C-Chain, COQ is subject to potential security flaws in its contract code (address: 0x420FcA0121DC28039145009570975747295f2329)
- Network Dependency: Reliance on Avalanche network stability means disruptions could prevent trading or transfers
- Community Concentration: Heavy dependence on social media engagement and community sentiment makes COQ vulnerable to trend reversals and narrative shifts
VI. Conclusion and Action Recommendations
COQ Investment Value Assessment
Coq Inu represents a speculative meme token born from collective enthusiasm and humor rather than fundamental utility. With a current market cap of approximately 13.06 million USD and a distributed supply of 69.42 trillion tokens, COQ exhibits characteristics typical of community-driven projects. The significant year-over-year decline of 89.21% reflects the highly volatile nature of meme coins. While the project maintains an active community presence through social channels, investors should recognize that valuation is primarily driven by sentiment rather than underlying technology or revenue generation. Long-term viability depends heavily on sustained community engagement and market conditions favoring speculative assets.
COQ Investment Recommendations
✅ Beginners: Start with minimal allocation (less than 1% of portfolio), educate yourself on meme coin dynamics, and only invest capital you can afford to lose completely without affecting your financial security.
✅ Experienced Investors: Consider tactical entry points near technical support levels, employ strict position sizing discipline with predetermined exit strategies, and actively monitor community sentiment through official channels.
✅ Institutional Investors: Exercise extreme caution regarding regulatory compliance and market manipulation concerns; conduct thorough due diligence on contract security; consider COQ only as a satellite position within diverse alternative asset portfolios.
COQ Trading Participation Methods
- Direct Trading on Gate.com: Access COQ trading pairs with competitive spreads and professional trading tools directly through Gate.com's platform
- Community Participation: Engage with the COQ community through official Twitter (@CoqInuAvax) and website (https://coqinu.com/) to stay informed on project developments
- Smart Contract Interaction: Advanced users can directly interact with the Avalanche C-Chain contract at 0x420FcA0121DC28039145009570975747295f2329 for specialized trading strategies
Cryptocurrency investment carries extreme risk. This report does not constitute investment advice. Investors must make decisions based on personal risk tolerance and financial circumstances. It is strongly recommended to consult professional financial advisors. Never invest funds you cannot afford to lose completely.
FAQ
How high will Coq Inu go?
Based on market analysis, Coq Inu is expected to reach a high of $0.0000002032 in 2025, with an average price of $0.0000001831 throughout the year.
Will Coq Inu recover?
Yes, analysts expect Coq Inu to start a cautious recovery with gradual price increases throughout the year. However, reaching its all-time high may take considerable time.
What is the price prediction for Coq in 2040?
By 2040, Coq is predicted to reach a maximum of $0.00000432 and a minimum of $0.0000000014, based on current market trends and technical analysis.
Is Coq Inu a meme coin?
Yes, Coq Inu is a meme coin on the Avalanche blockchain, launched in 2021. It emphasizes community collaboration and humor without formal leadership structure.
Share
Content
How to Buy Cryptocurrency


Trending Cryptocurrencies


2025 TURBO Price Prediction: Analyzing Market Trends and Future Valuation Prospects in the Evolving Cryptocurrency Ecosystem

2025 WOJAK Price Prediction: Analyzing Market Trends and Future Valuation Prospects for the Popular Meme Token

2025 WHYPrice Prediction: Market Analysis and Growth Potential for Investors
2025 DON Price Prediction: Analyzing Market Trends and Potential Growth Factors

2025 QUACK Price Prediction: Will This Meme Coin Soar or Crash in the Crypto Market?

2025 MUBARAK Price Prediction: Expert Analysis and Future Market Outlook for the Emerging Digital Asset

Discover the Origins and Popularity of Cheems Meme Coin
Ultimate Guide to TOMA Token Launch: Price Insights and Predictions

PI Coin Listing Insights: Launch Timeline and Future Price Forecasts
Exploring Bitcoin Payment Options for Travel: Flights and Hotels in 2025

Exploring AI Governance Tokens: Revolutionizing Decentralized Organizations